

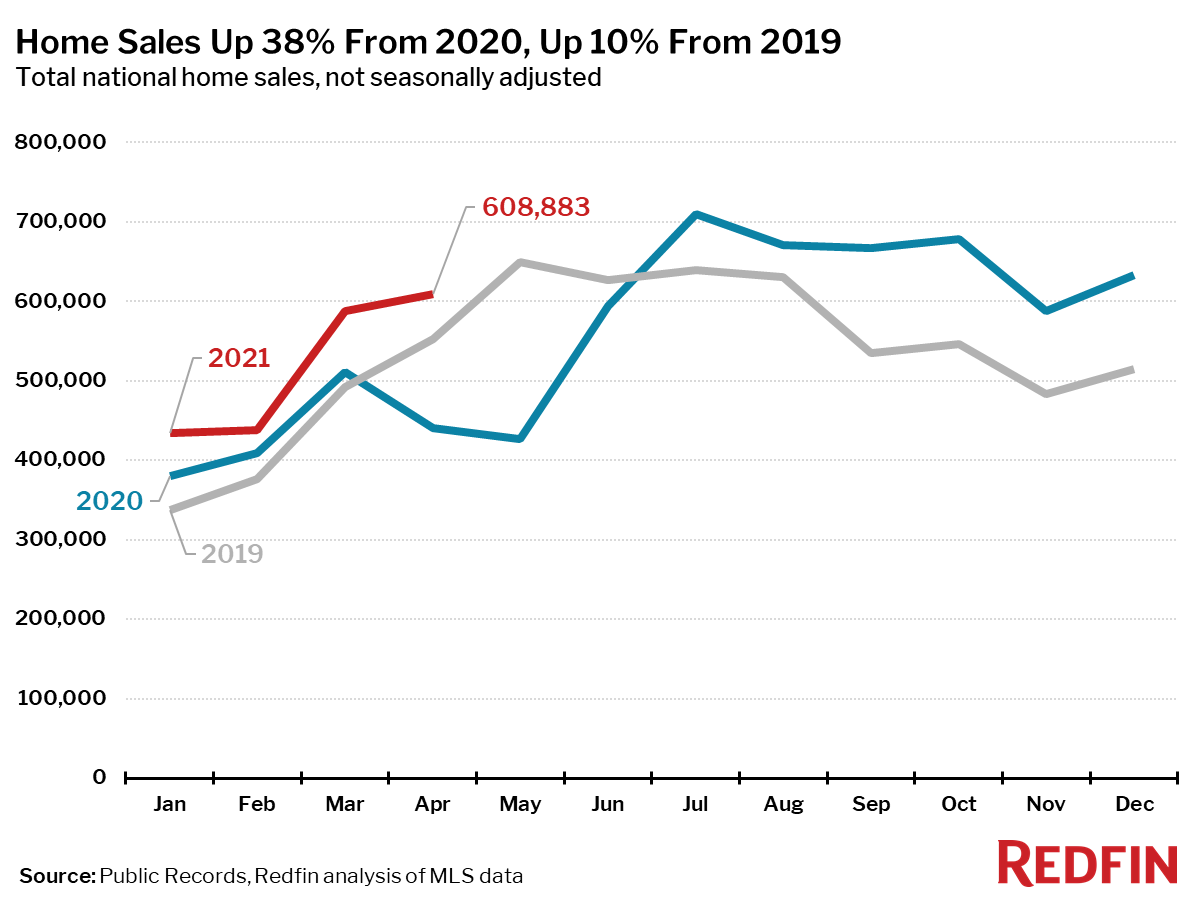
Note: Pandemic lockdowns significantly slowed homebuying and selling in April 2020, which means the year-over-year trends for home prices, pending sales, closed sales and new listings are somewhat exaggerated. For more context, we have added extra charts that zoom in on the last three years of home sales and new listings, without seasonal adjustments.
April was another history-making month for housing, with homes selling for higher prices and in fewer days since at least 2012, when Redfin began tracking national housing data. The following measures all hit new records:
“To put the scarcity of housing into context, there is plenty of room for supply to increase and demand to taper off, and we would still find ourselves in a historically strong seller’s market,” said Redfin Chief Economist Daryl Fairweather. “While Americans brace themselves for a lot of changes as workplaces and schools reopen, the story of the housing market will largely remain the same. There simply aren’t enough homes for sale in America for everyone with the desire and the means to buy one right now. Until new construction takes off–over the course of years, not months–home prices will continue to increase. This housing boom is nowhere close to over.”
Indianapolis is home to the country’s fastest housing market. The typical home in the Indianapolis metro went under contract after just four days on the market in April, down from 10 days a year earlier.
“I’m helping buyers understand the current market by advising them that it’s no longer unusual for a home to sell for up to $50,000 above asking price,” said Indianapolis Redfin agent Andrea Ratcliff. “Builders have waiting lists of at least a year and people are hesitant to sell their homes because there are so few options available for them to buy. Plus, remote workers are moving into the Indianapolis area, fueling even more homebuyer demand. Those factors are exacerbating our local housing shortage and fueling the competitive cycle.”
Homes in Denver, Omaha, NE, Portland, OR and Seattle also sold exceptionally fast in April, with half of all homes pending sale in just 5 days in each of those metros.
Three of the five most competitive markets of the month were in California. In Oakland, 81.5% of homes sold above list price, a higher share than any other metro. It’s followed by San Jose (78.2%), Tacoma, WA (73.7%), Austin (73.7%) and Sacramento (72.5%).
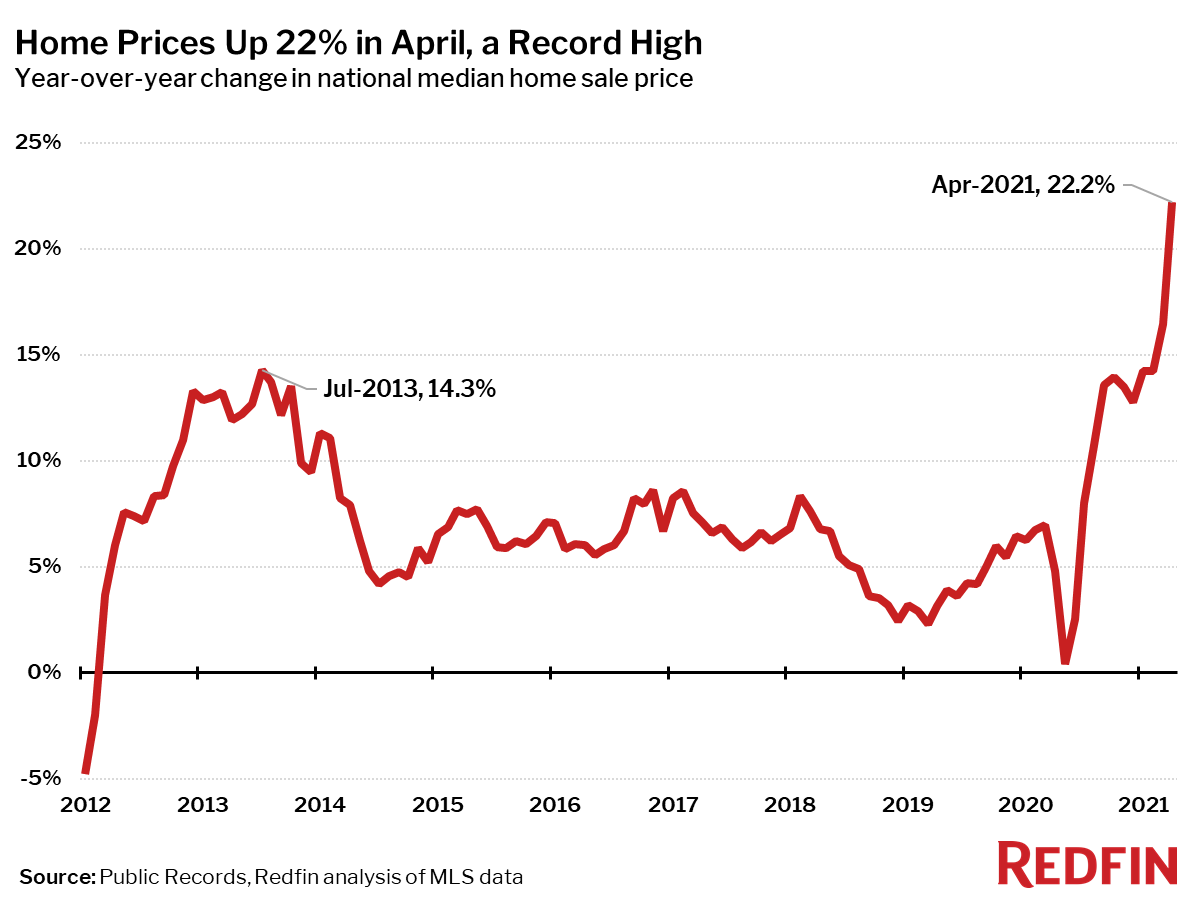
Median sale prices increased from a year earlier in all of the 85 largest metro areas Redfin tracks. The smallest increase was in Honolulu, where prices were up just 0.2% from a year ago. The largest price increases were in Austin, TX (+42%), Oxnard, CA (+26%) and Miami, FL (+26%).
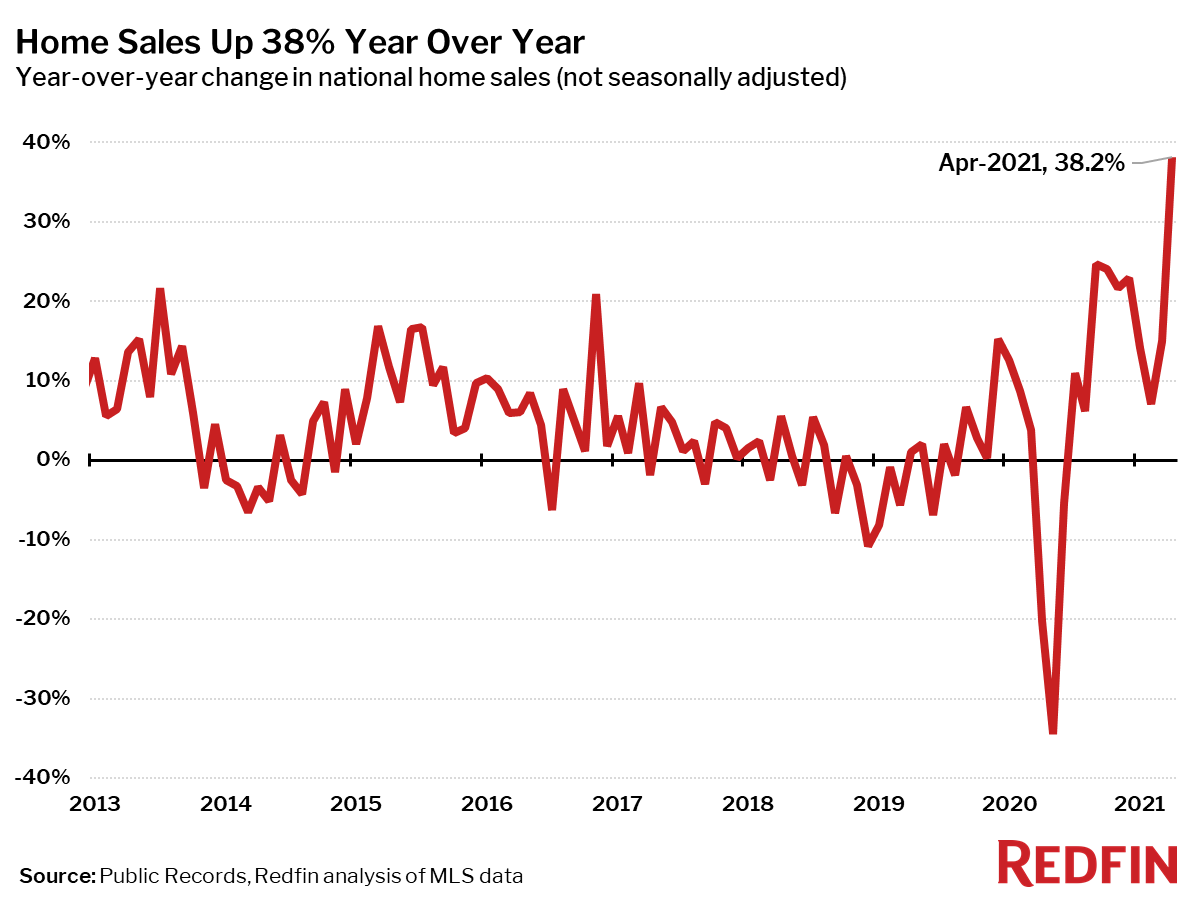
The number of homes sold in April was up 34% from a year earlier, but only 8% from the same time in 2019. Compared to April 2020, home sales rose in all but one of the 85 largest metro areas Redfin tracks. The only metro area that saw home sales decline was Rochester, NY (-3%). The largest gains in sales were in places that had the most abrupt slowdown of home sales in April 2020, including San Francisco (+184%), San Jose (+150%) and Miami, FL (+120%).
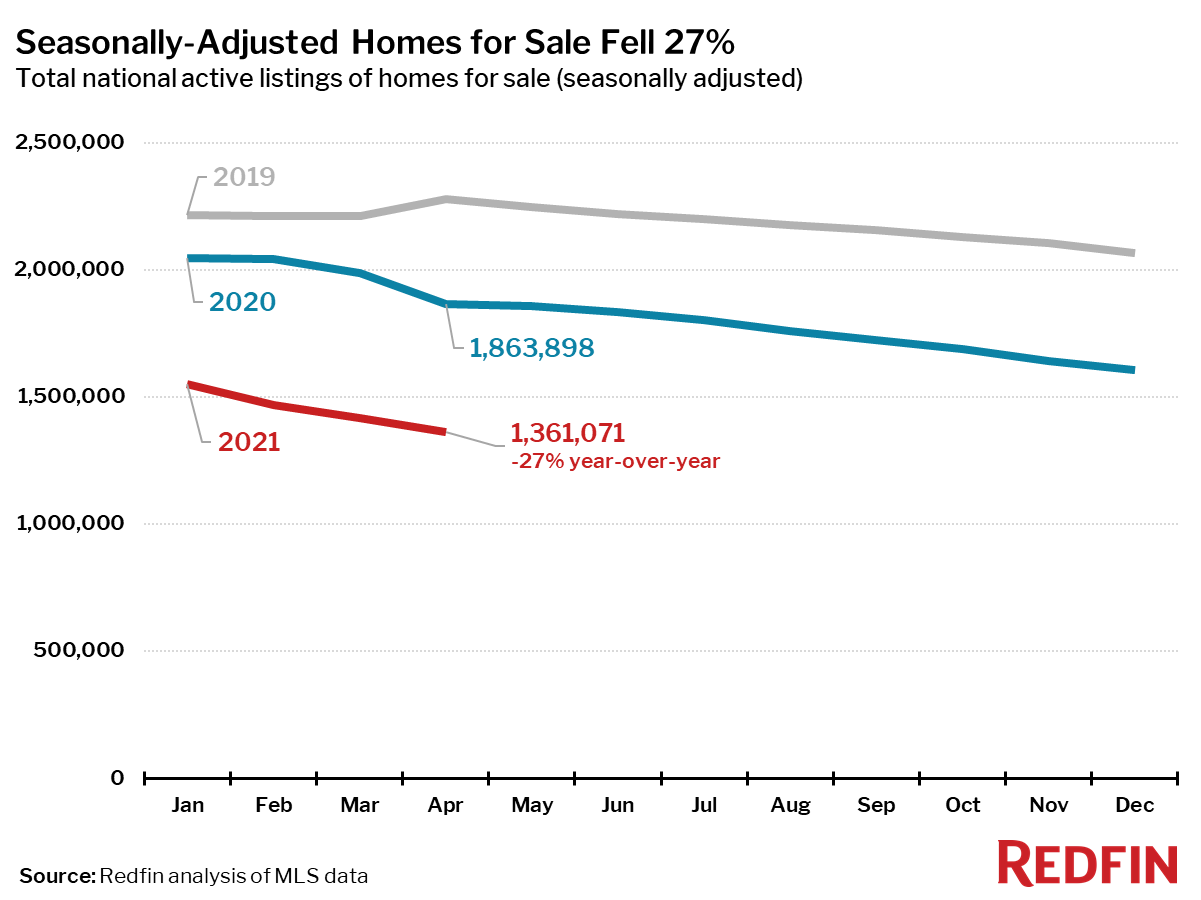
Active listings—the count of all homes that were for sale at any time during the month—fell 27% year over year to their lowest level on record. But the annual decline in the number of homes for sale slowed slightly from last month.
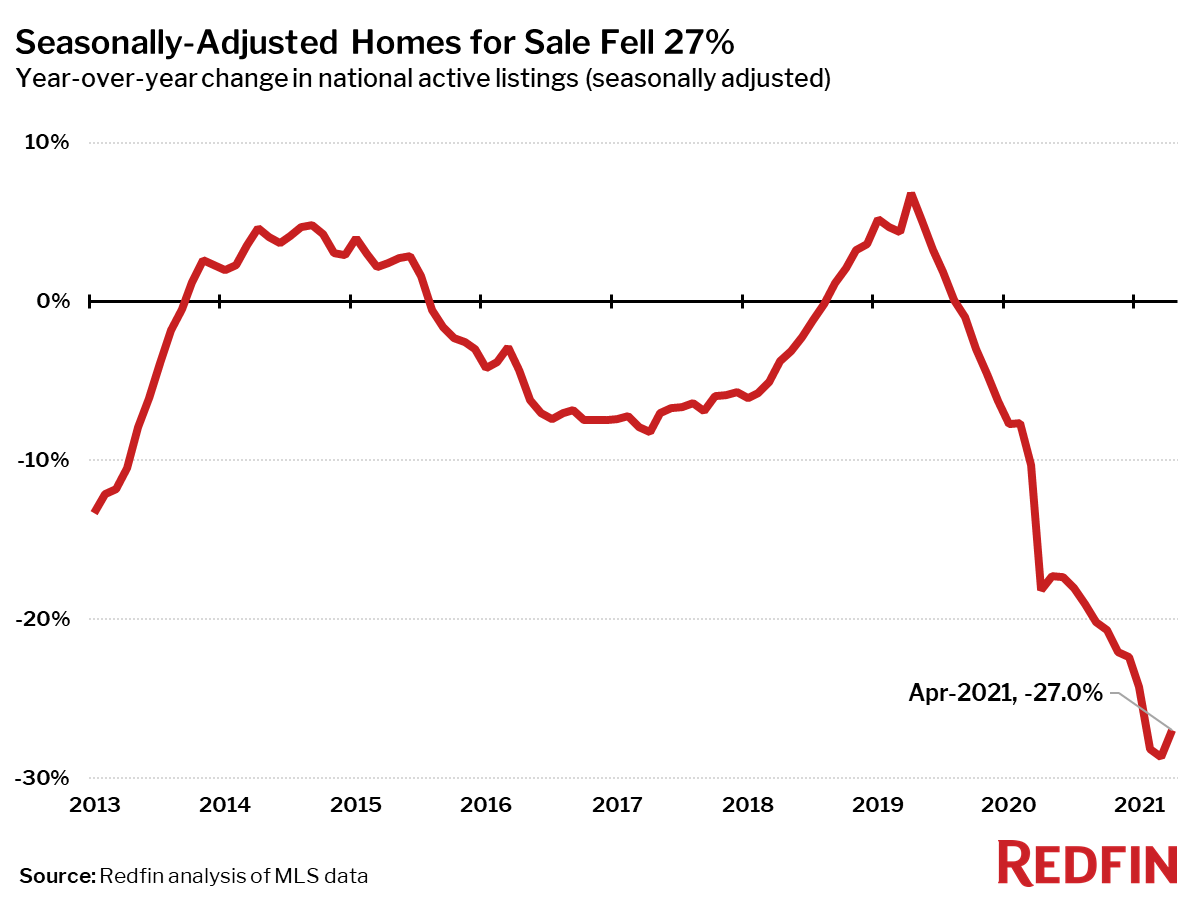
Only 12 of the 85 largest metros tracked by Redfin posted a year-over-year increase in the number of seasonally adjusted active listings of homes for sale: San Francisco (+54%), San Jose (+40%) and Oakland, CA (+27%) experienced the biggest gains.
The biggest year-over-year declines in active housing supply in April were in Salt Lake City (-70%), Baton Rouge, LA (-60%) and North Port, FL (-48%).
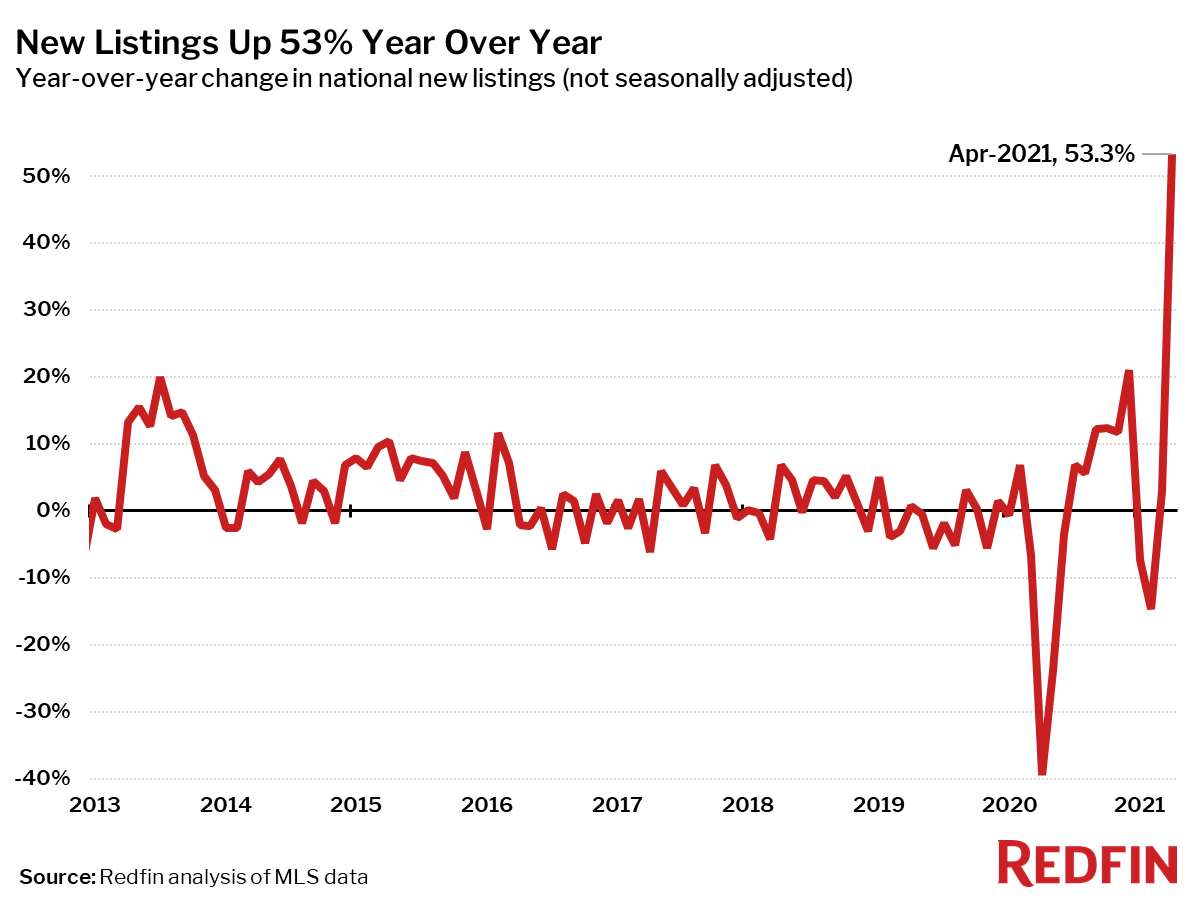
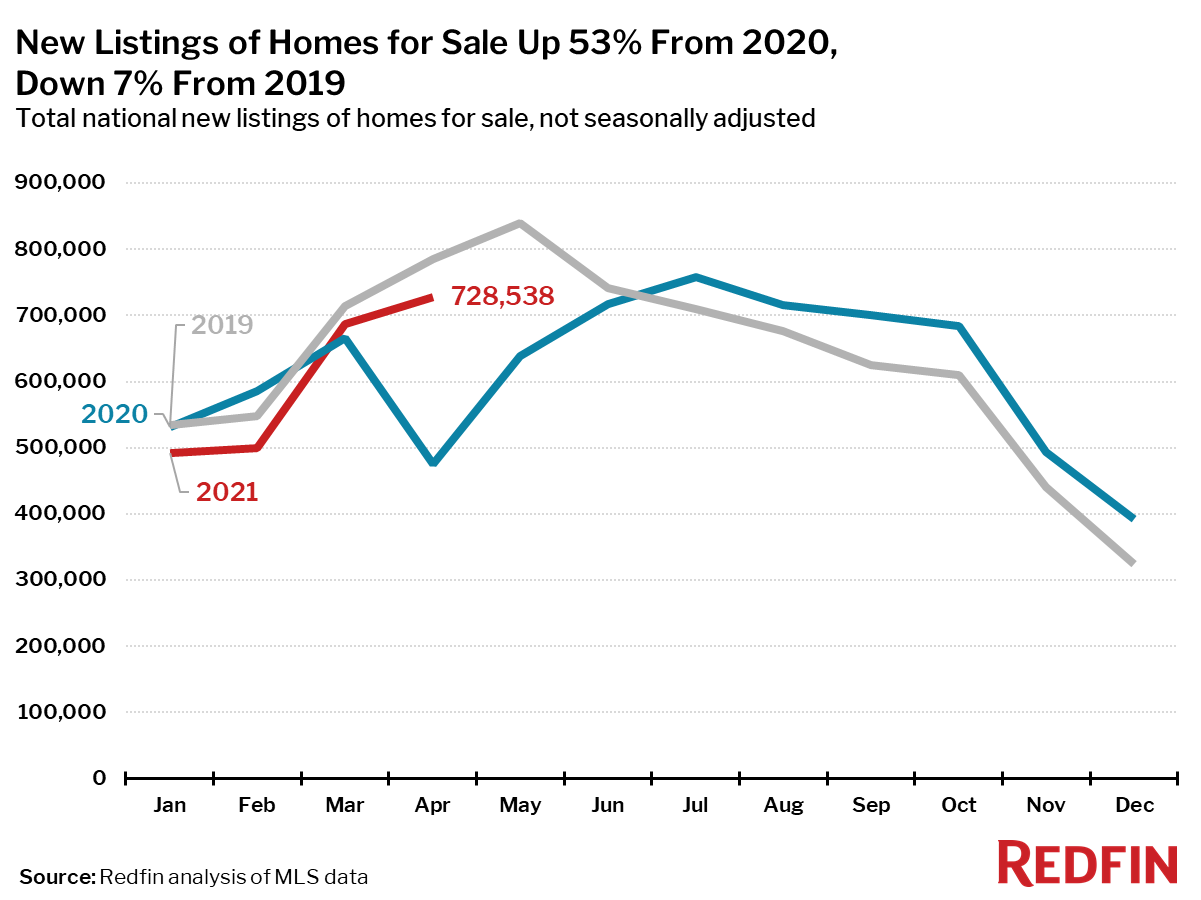
New listings of homes for sale were up 32% in April from a year earlier, but down 17% from the same time in 2019, offering little relief to homebuyers desperate for more choices.
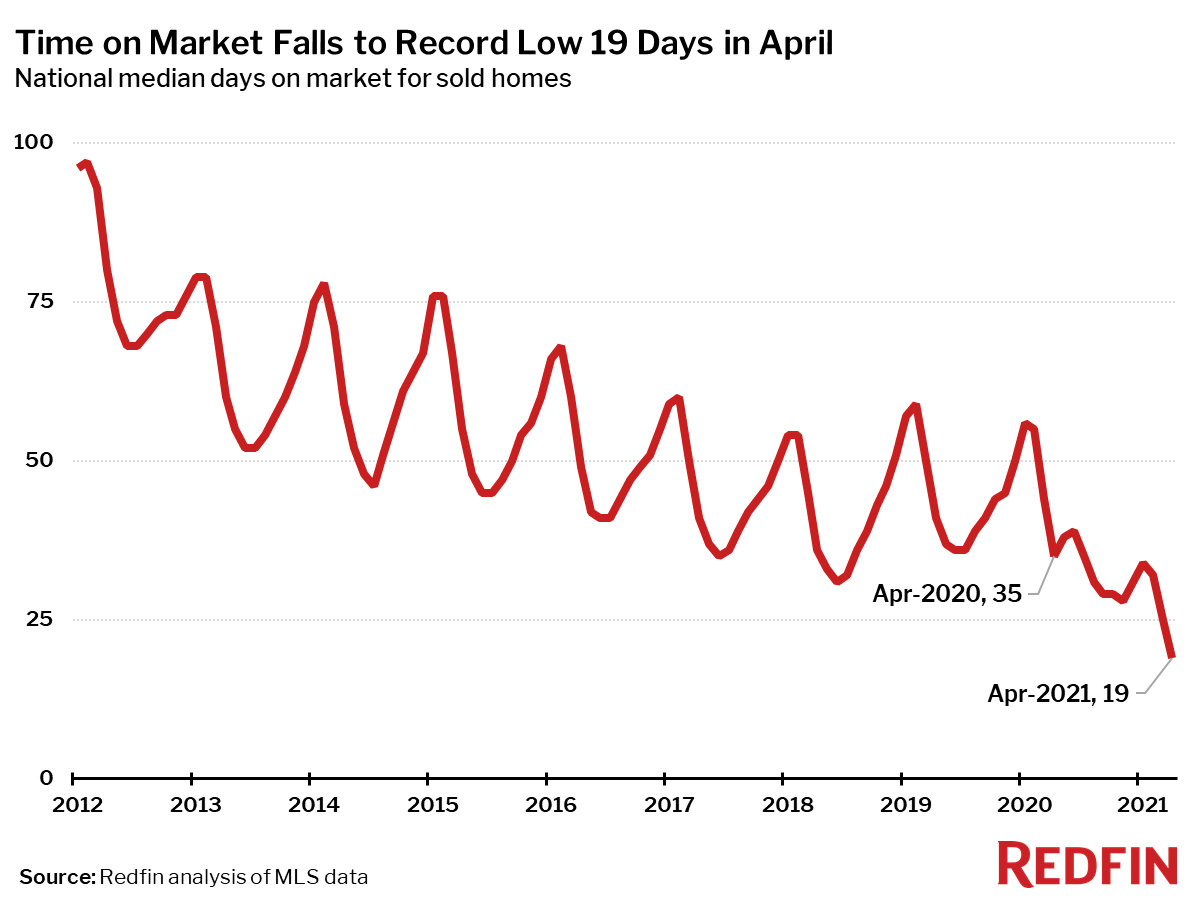
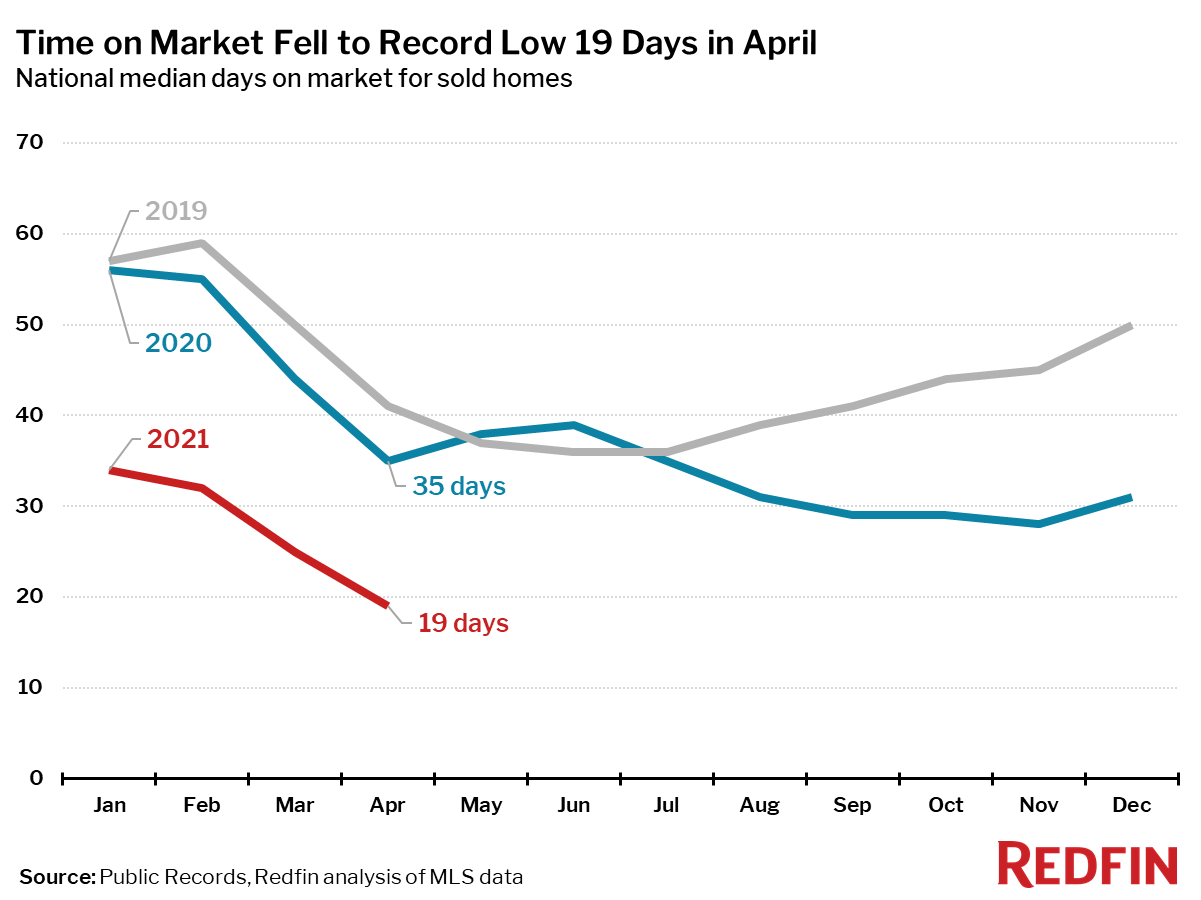
The housing market was more competitive in April than any time since Redfin began tracking national housing data in 2012.
The typical home that sold in April went under contract in 19 days—16 days fewer than a year earlier and the fastest pace on record.
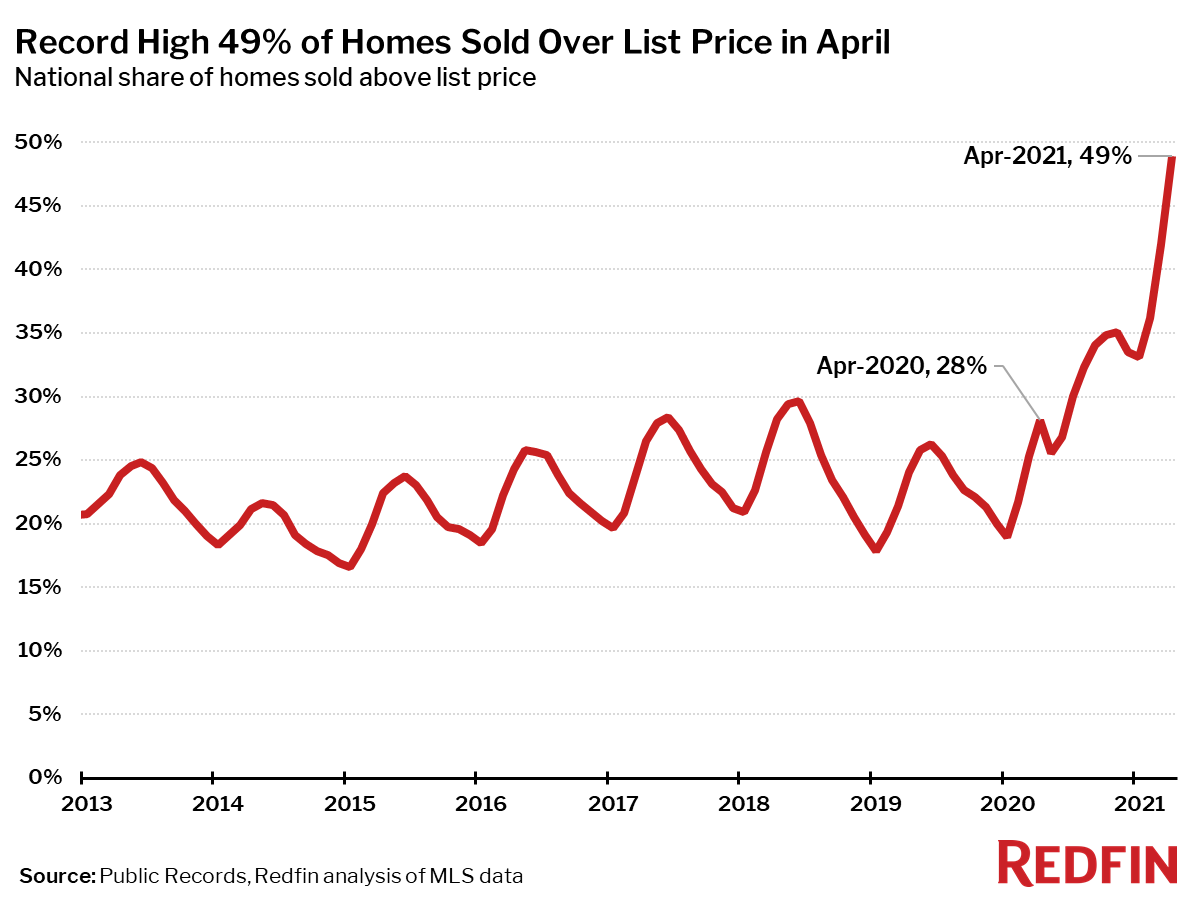
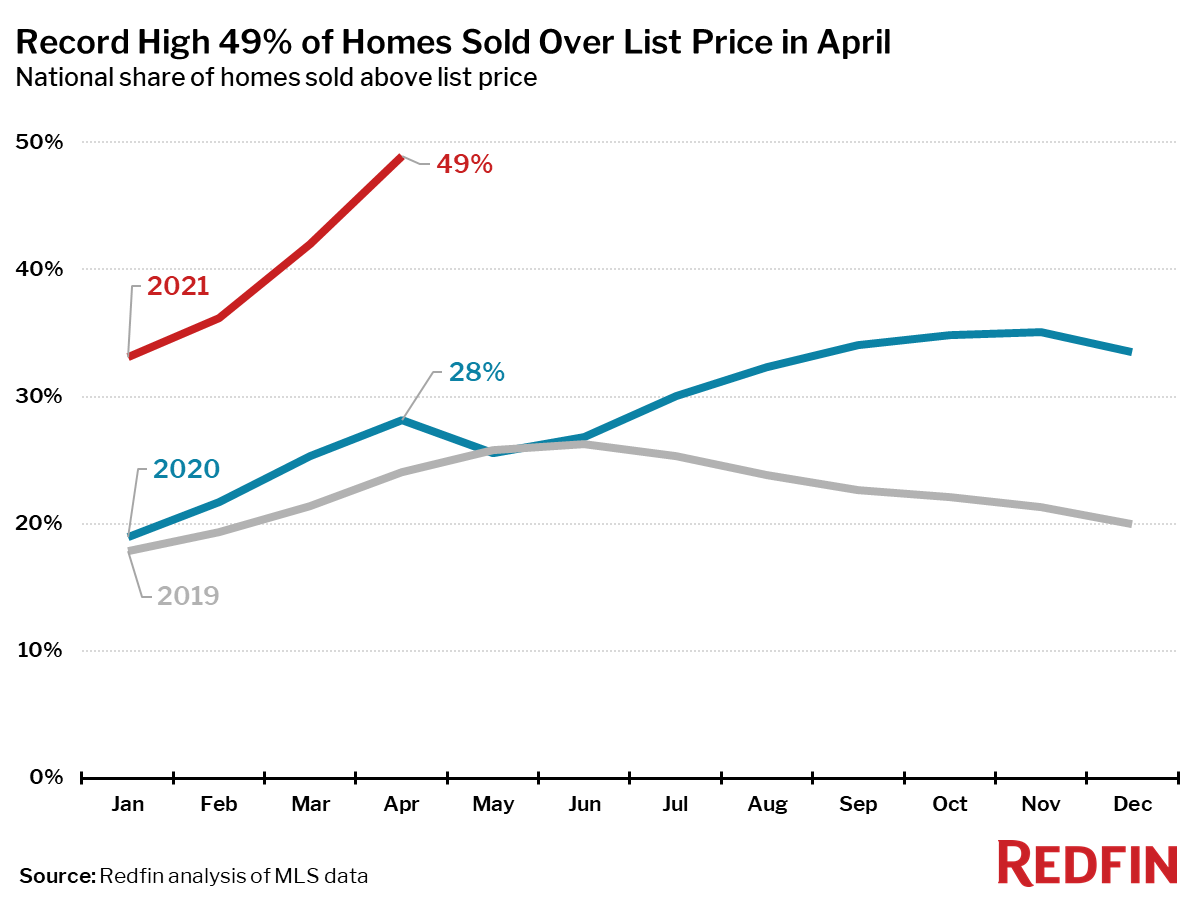
In April, 49% of homes sold above list price, the largest share on record. If this measure follows the typical seasonal pattern, it will likely hit new record highs again in May and June.
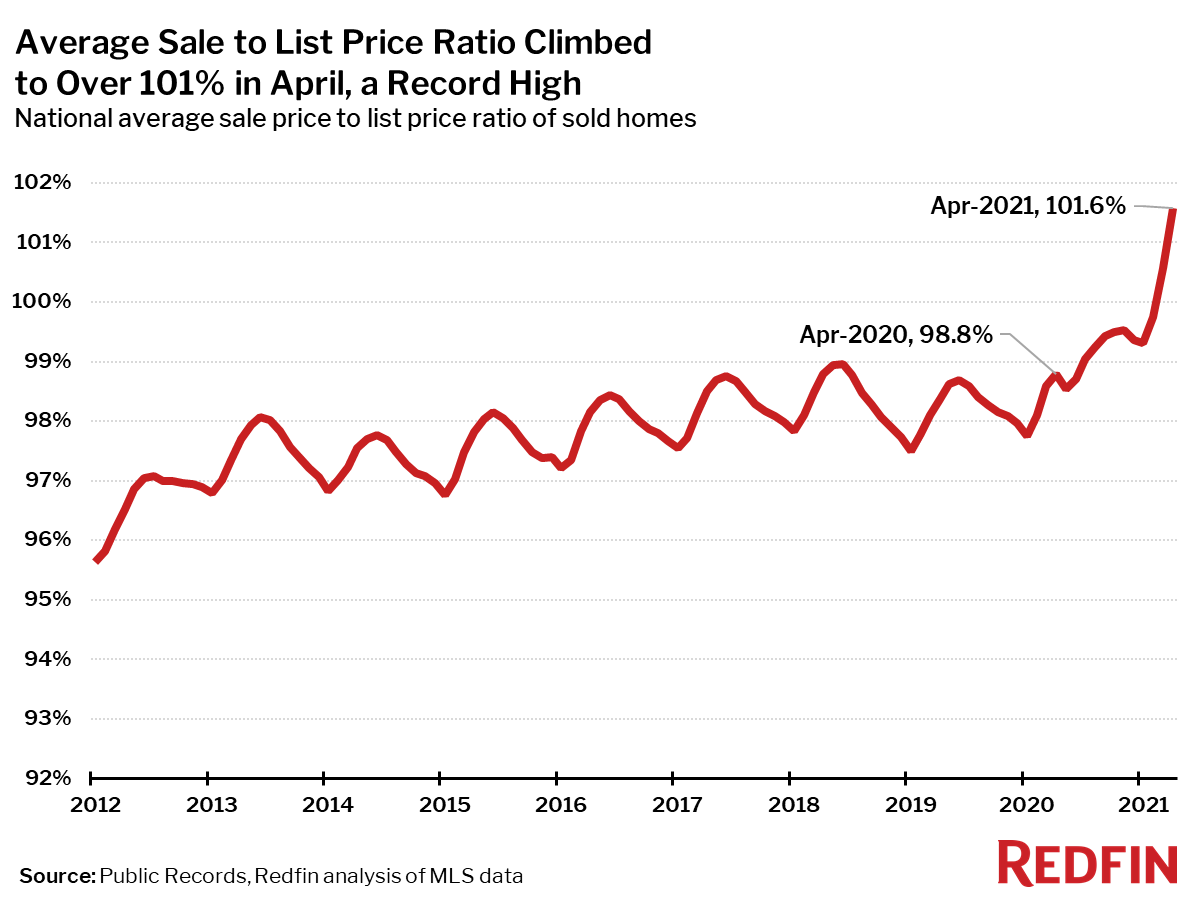
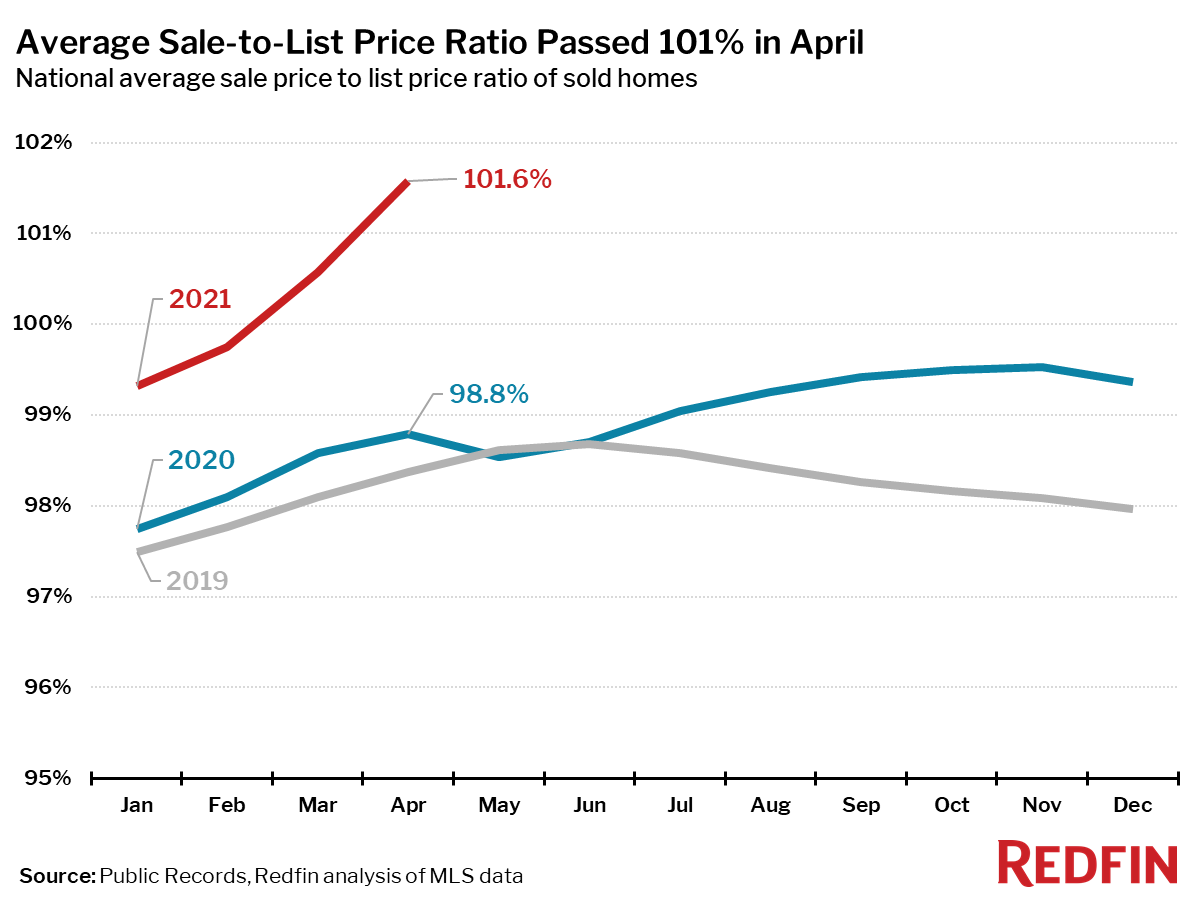
The average sale-to-list price ratio continued to surge well past 100% in April, hitting a record high of 101.6%. This measure also typically peaks in June, so are likely to see additional record highs for the next two months if the market continues to follow a typical seasonal pattern into summer.
Competition
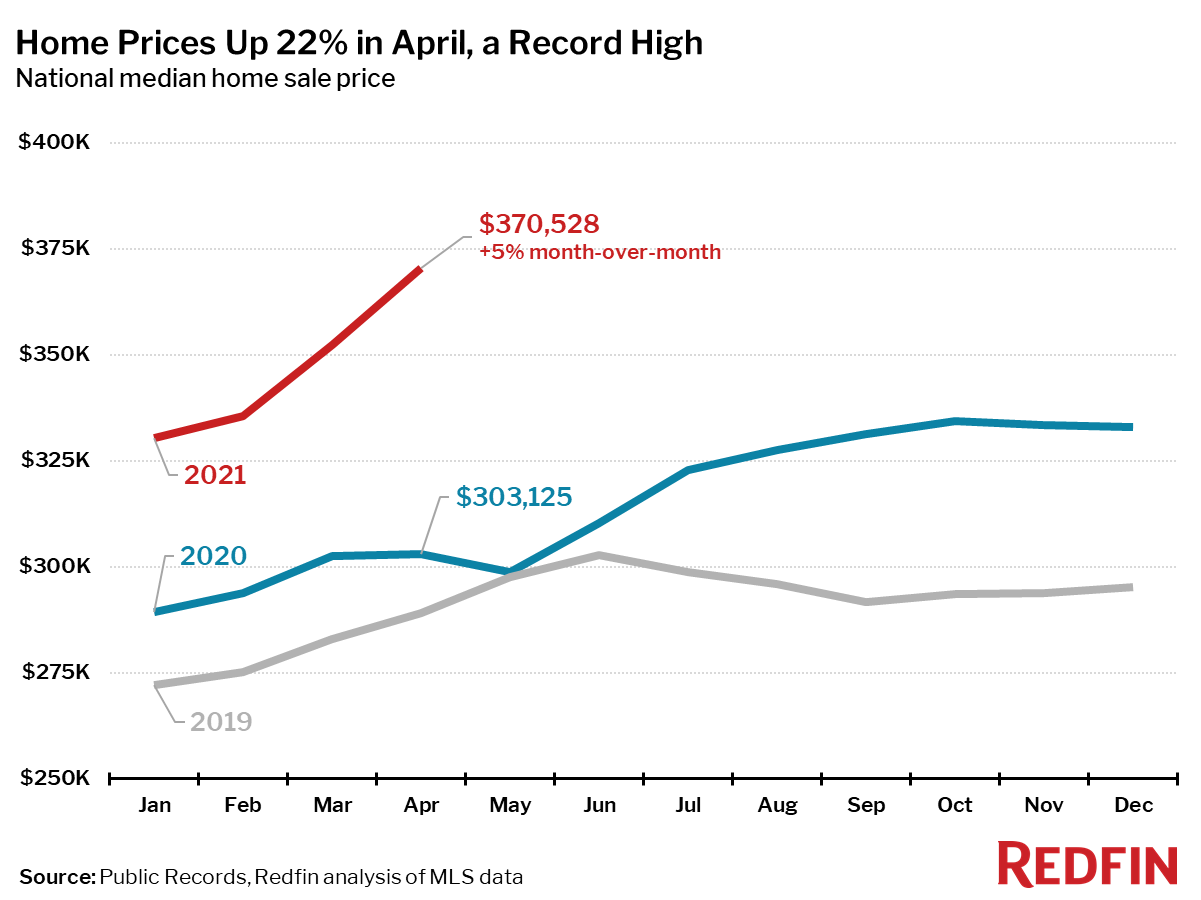
Prices
Sales
Inventory
Redfin Estimate
Below are market-by-market breakdowns for prices, inventory, new listings and sales for markets with populations of 750,000 or more. For downloadable data on all of the markets Redfin tracks, visit the Redfin Data Center. Refer to our metrics definition page for explanations of all the metrics used in this report.
