

New construction homes in the fourth quarter of 2017 accounted for 16.4 percent of all single-family homes for sale, the highest level since Redfin began tracking this data in 2012, up from from 14.2 a year earlier. This is a needed sign of progress in a housing market plagued by short supply.
The median price of new single-family homes that sold last quarter was $377,800, up 1.6 percent year over year.1 Compared with existing homes, new construction sold at an average premium of $86,400 in the fourth quarter.2 Existing home prices increased 7.3 percent year over year.
“New homes are more expensive than existing homes, and their prices tend to grow at a slower rate,” said Redfin chief economist Nela Richardson. “However, new homes’ slower price growth belies their advantage to buyers in the hottest markets. Buyers in these highly competitive markets have been attracted to new construction as a way to avoid bidding wars. They often find it’s easier to negotiate with a single builder than to compete with several buyers and negotiate with a traditional seller.”
A key factor in the high price of new homes is rising construction costs. The estimated labor and materials cost of constructing a single-family home increased 1.2 percent year over year in the fourth quarter to $244,000, the highest level since the Census Bureau began reporting it in 1988.3
Despite record-high construction costs, the National Association of Home Builders’ Housing Market Index, which measures builders’ confidence, has hovered at 72 in 2018, just two points shy of the two-decade high seen in December. The latest Census Bureau data also reflects this confidence as housing starts—the number of new residential homes that began construction— rose to 1.3 million in January, the strongest pace on record since 2007 and 7.3 percent above the January 2017 rate of 1.24 million. As housing starts provide insight into what’s ahead for the housing market, this growth marked a key milestone in post-downturn recovery for housing.
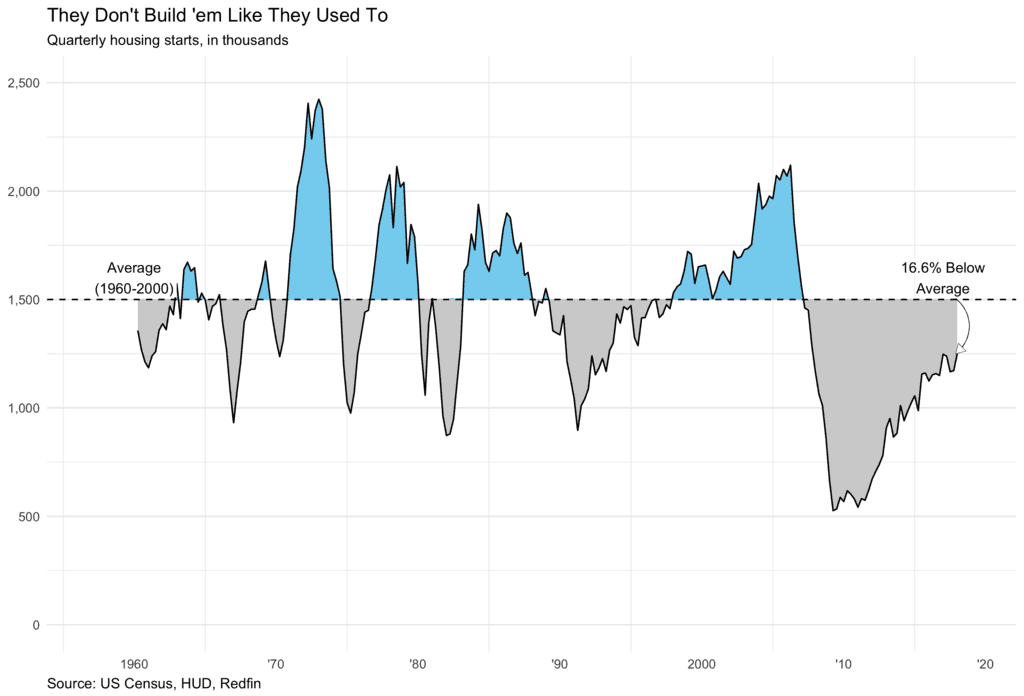
Still, the supply situation at present remains dire. In January, housing starts were 11.6 percent below the historical average (see chart). The total number of homes for sale in January was 14.4 percent below where it was a year prior, marking 28 consecutive months of declining inventory. With strong buyer demand expected to continue this year, there are still not nearly enough homes for sale. Though building more homes would seem like the obvious solution, a number of obstacles are standing in the way of construction.
“We are growing, but not fast enough to keep up with demand,” said Robert Dietz, chief economist for the National Association of Home Builders.
The largest challenges facing homebuilders and hindering residential construction, according to Dietz, include:
New construction has added few affordable homes since the great recession, according to Dietz, a problem for which he offered a recommendation.
“In light of rising construction costs, builders have often favored higher-priced homes that can absorb the costs,” said Dietz. “Townhouse construction solves a number of supply-side issues at once, making greater use of land, and adding homes in a price tier that needs building the most. The only question is whether communities will allow builders to add the density that comes along with them.”
In conjunction with its quarterly report on new residential construction, Redfin makes available on its Data Center a downloadable set of monthly data on new construction prices, sales, inventory and other new residential market statistics. Redfin is also releasing building permit data—provided by the Census—allowing users to analyze average construction costs and compare the number of units built per capita across regions. Both datasets are available for download at the National, Metro, and County Levels since 2012.
1December throughout this report is a rolling three-month measure and includes October, November, and December for all new construction data.
2 The price premium varies considerably when accounting for size and location however. New homes are being built larger than existing as the price per square foot premium was about 2 percent lower for new construction homes, but they also tend to be further away from the urban core; in the Nashville metro area, for example, new construction homes bought in 2017 were typically 22.9 percent further from the city-center than existing homes.
3 The average permit valuation for constructing each single-family home varies widely from just $87,000 in Allentown, PA to more than $400,000 in Long Island, NY in the fourth quarter of 2017.
4 Only metropolitan divisions with populations greater than 750,000 people were included in this highlights section.
