How likely is it that a teacher and a surgeon will use the same bike lane or take their kids to the same playground? In a handful of U.S. cities including Seattle, Washington, D.C., Boston and Denver, it turns out it’s actually pretty likely.
Redfin analyzed the mix of affordable and high-end homes in neighborhoods across 30 of the largest American cities to determine which places are the most economically integrated. Overall, 1 in 5 residential properties across those 30 cities were in economically integrated neighborhoods, or areas with roughly equal numbers of affordable and high-end homes. Seattle took the number-one spot, with an even higher share. Scroll to the bottom of this report to see the full city-by-city breakdown.
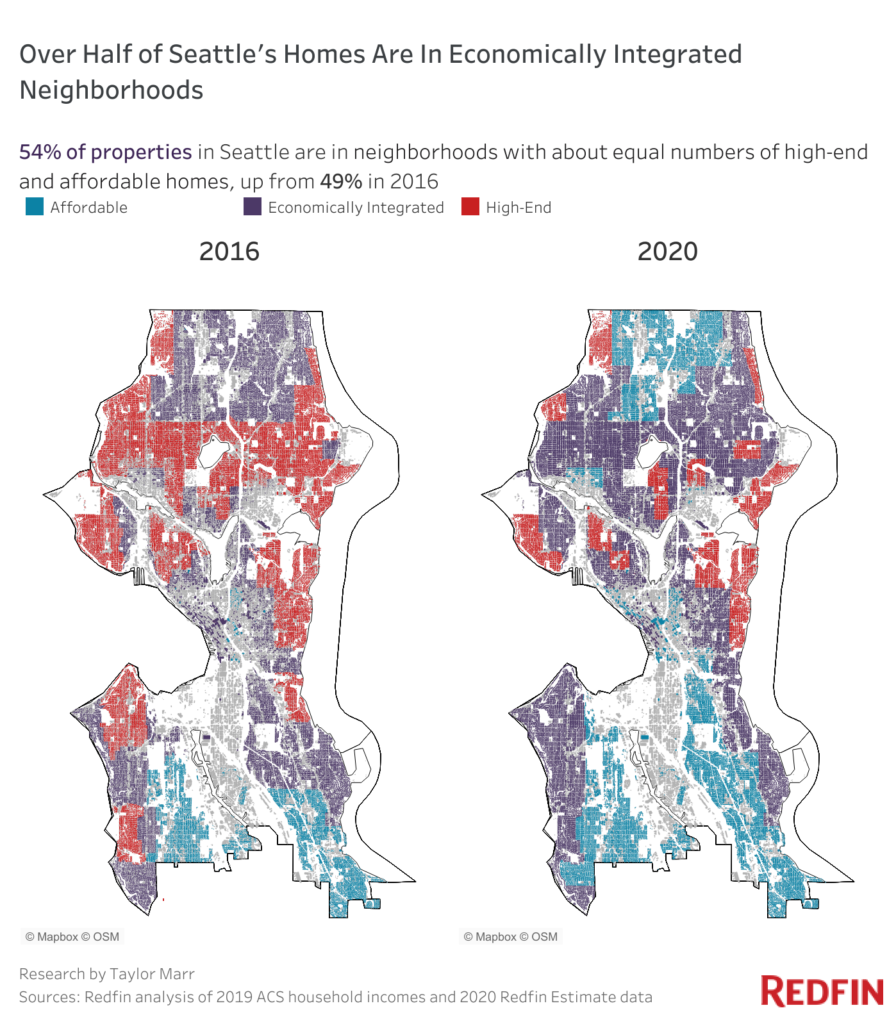
More than half (54.2%) of Seattle’s homes in 2020 were located in neighborhoods with about the same amount of affordable and high-end homes. We define an affordable home as a property with a monthly mortgage payment that’s no more than 30% of the local median monthly household income as of 2019. In Seattle, where the median 2019 income was $102,486, that would be a home with a monthly mortgage payment of no more than $2,562, or a total market value of $786,500. Seattle’s tech boom has resulted in increased incomes for many (but not all) residents.
Washington, D.C. was the only other city where about half of homes (49.5%) were in economically integrated neighborhoods. Boston and Denver rounded out the top four, at 41.6% and 41.0%, respectively.
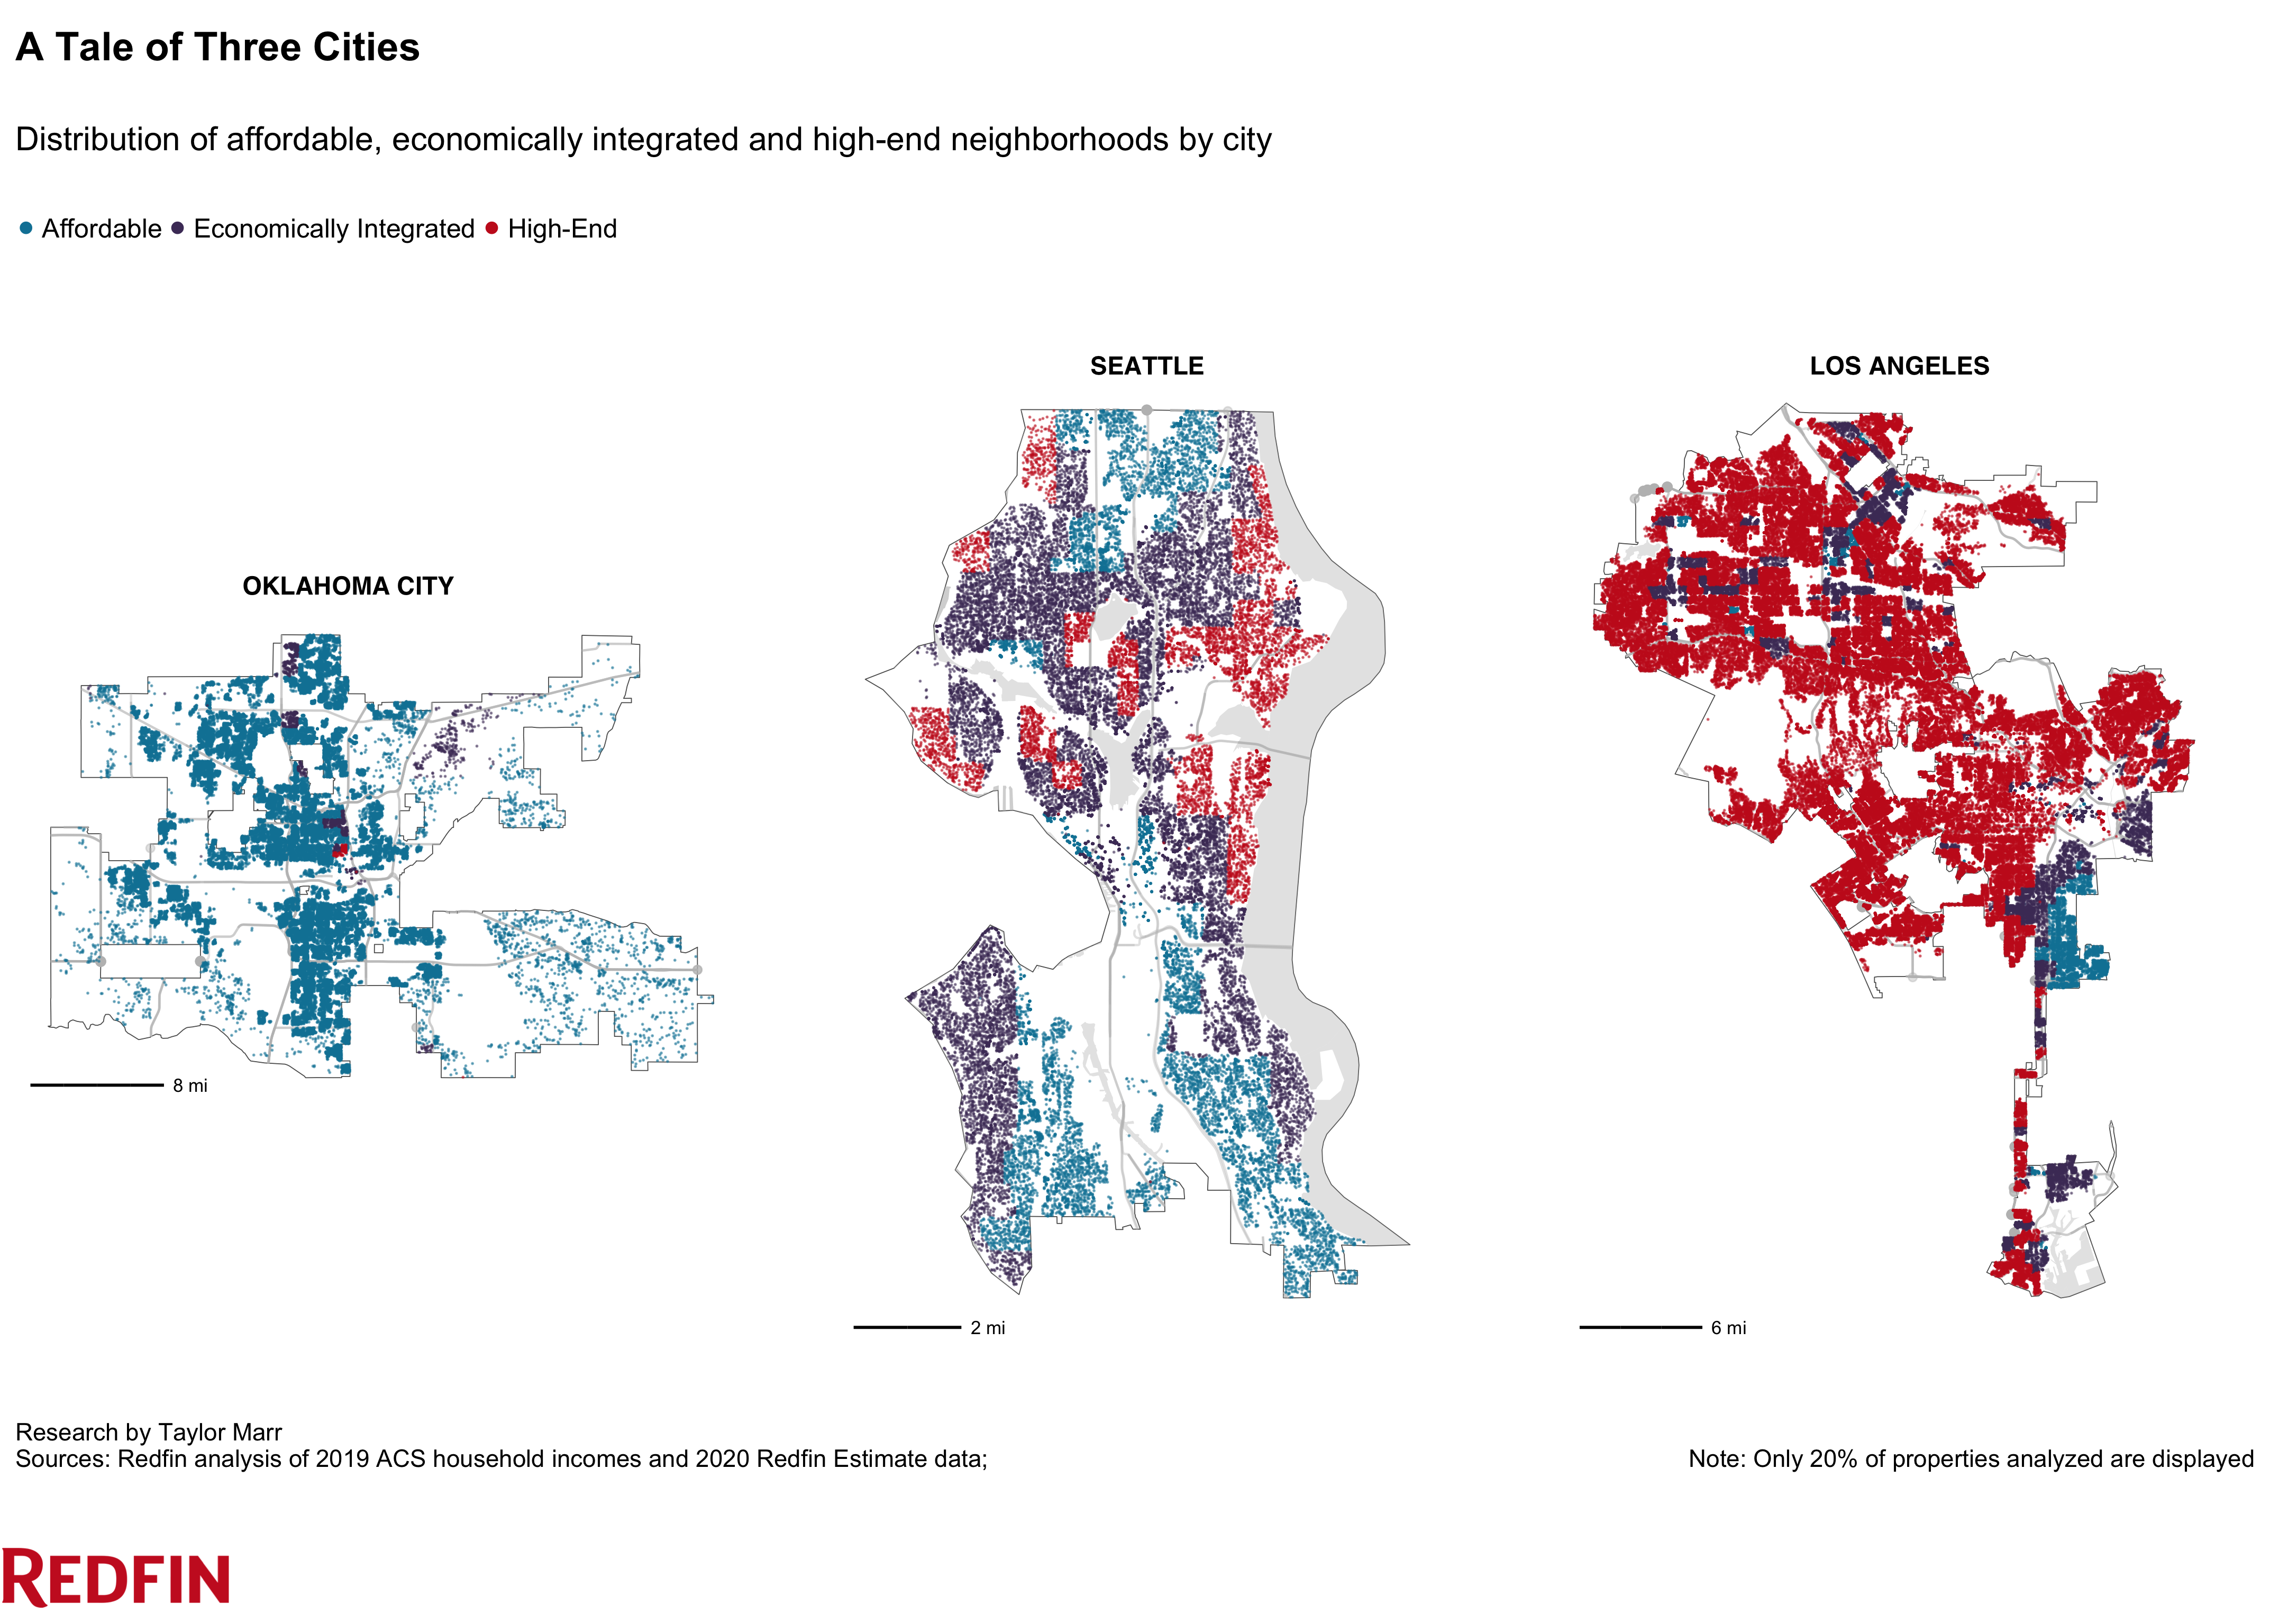
These cities exist in stark contrast to places like Los Angeles, where more than three-quarters of homes (79.1%) are in high-end neighborhoods, and Oklahoma City, where almost all homes (96.7%) are in affordable neighborhoods. This is likely contributing to varying rates of homeownership in these two cities. Oklahoma City is relatively affordable, with more than half (57.5%) of residents owning homes in 2019—the third highest rate among the 30 cities in this analysis. Meanwhile, closer to a third (36.5%) of L.A. residents owned homes, the second lowest rate, behind only Boston. Affordable housing in L.A. exists, but is more difficult to come by and often more competitive, leading many residents to rent instead, according to Redfin Lead Economist Taylor Marr.
“When affluent Americans cluster in luxury gated communities, their wealth stays concentrated in those areas,” Marr said. “When affluent Americans share neighborhoods, parks and restaurants with lower- and middle-income Americans, wealth and economic opportunity is distributed more evenly throughout our cities.”
Where you live can play an important role in defining your future success. It can determine where you work, who you meet and what school you send your children to.
Research has shown that children who grow up in impoverished neighborhoods are more likely to be incarcerated and have lower earnings, while children who live in economically integrated neighborhoods have comparable economic and health statuses as children from higher-income families.
Of course, having a mix of affordable and high-end homes isn’t synonymous with equality, Marr noted.
“Some neighborhoods may appear to have a good balance of affordable and high-end homes, when in reality it’s just an affordable neighborhood transitioning into a high-end neighborhood due to gentrification,” Marr said.
One strategy local governments can use to foster economically integrated neighborhoods is upzoning—changing zoning regulations to allow for dense multifamily buildings instead of just single-family homes. Seattle is one city that has had success with upzoning, which we discuss in more detail below. Another method is inclusionary zoning, by which certain portions of newly-built residential buildings are reserved for people with low to moderate incomes. Local governments can also encourage people to invest in opportunity zones, or economically underserved areas that offer tax benefits in exchange for investment.
It may come as a surprise that Seattle ranked first in this analysis, as it has a reputation for being one of the most expensive places to live in the U.S., but local leaders have made significant strides in recent years when it comes to balancing out expensive neighborhoods with affordable housing.
Seattle officials used upzoning to expand housing supply and provide less expensive options for families who can’t afford to buy single-family homes. The Seattle City Council voted as recently as 2019 to upzone 27 additional neighborhoods and require developers in those areas to include low-income apartments in their buildings or pay fees.
This effort has helped transform some high-end Seattle neighborhoods into economically integrated neighborhoods, Marr said. The share of Seattle homes that are in economically integrated neighborhoods increased from 48.7% in 2016 to 54.2% in 2020. Over the same period, the share of homes that are in high-end neighborhoods decreased from 39.9% to 15.6%, and the share of homes that are in affordable neighborhoods increased from 11.3% to 30.3%.
Ballard, which used to be reserved mostly for single-family homes, is one example of an economically integrated Seattle neighborhood. Take a walk there today and you’ll notice scores of newly-built townhouses and five-story apartment complexes next to single-family homes. Many of the units in these buildings are significantly smaller than single-family homes, but provide a living option for people who want to be close to the heart of the city and can’t afford or don’t need a larger home.
Other Seattle neighborhoods with a mix of affordable and high-end homes include Alki and Mount Baker.
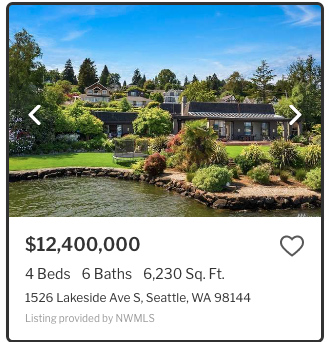
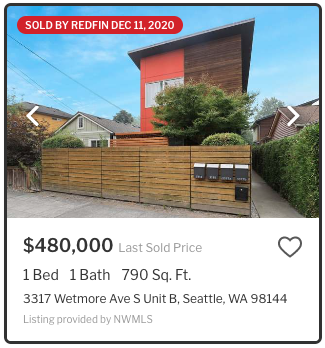
In Mount Baker, one homeowner is currently asking $12.4 million for their waterfront mansion that boasts stunning views of Mount Rainier and Lake Washington. It’s a five-minute drive from this relatively modest townhouse that sold for $480,000 in December.
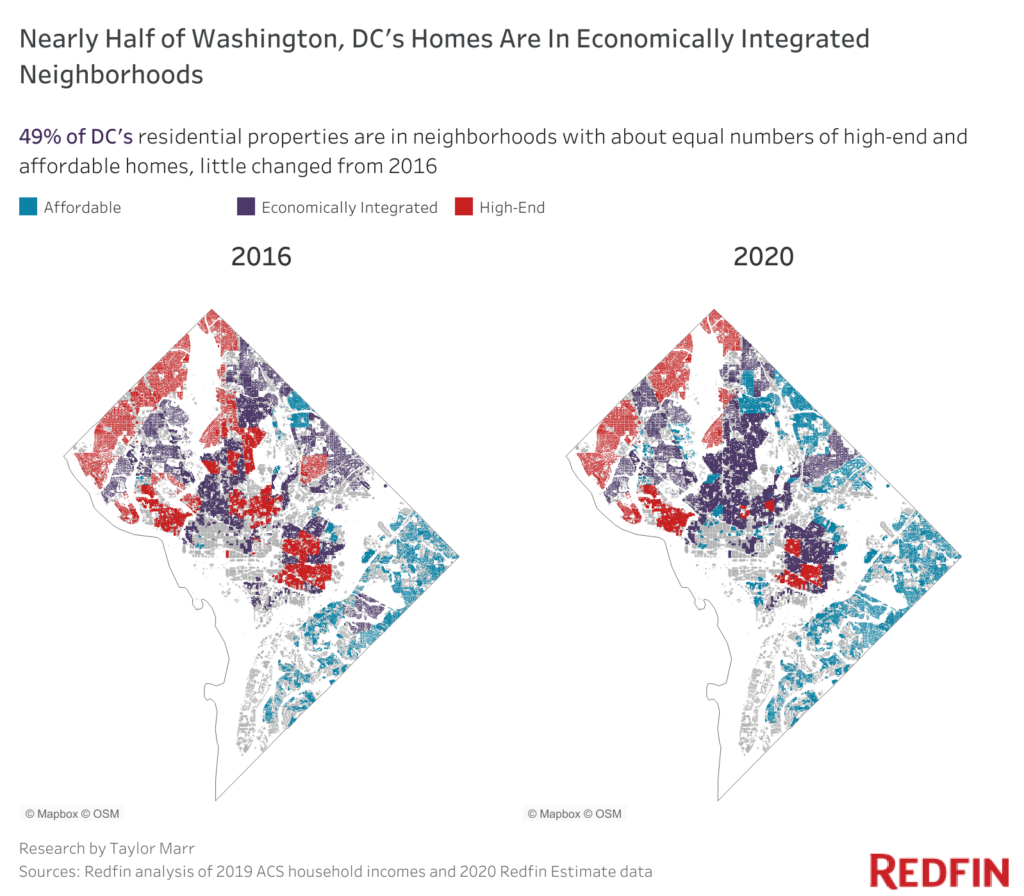
About half (49.5%) of Washington, D.C.’s homes in 2020 were located in economically integrated neighborhoods, little changed from 2016. However, during the same period, the share of homes that are in high-end neighborhoods decreased from 32.0% to 15.0%, and the share of homes that are in affordable neighborhoods increased from 18.6% to 35.5%.
For the purposes of this analysis, an affordable home in Washington, D.C. (based on the 2019 median income of $92,266) is a property with a monthly mortgage payment of no more than $2,307, or a total market value of $708,200.
“Washington, D.C. is diverse in income, occupation, race and place of life,” said local Redfin real estate agent Leslie White, who lives in D.C.’s Mount Pleasant neighborhood. “Mount Pleasant has four-story tall rowhouses that sell for $2 million, but it also has small, simple condos that go for $400,000—although there are many folks who wouldn’t consider $400,000 affordable. The people who have the ability to get loans and become homebuyers tend to be wealthier than the people who are renting.”
In some D.C. neighborhoods, including Woodley Park, the supply of high-end homes is balanced out by more affordable multifamily buildings constructed in the 1950s and 1960s. While these buildings aren’t single-family homes and often lack modern amenities like in-unit laundry, buyers can get good prices and a convenient location, said White.
In other neighborhoods, including Columbia Heights, the supply of luxury homes is balanced out by single-family homes that are being converted into multifamily buildings, she said.
“Big, four-story rowhouses are being turned into individual condos, so instead of paying $2 million for the whole home, you’ll pay $700,000 for one floor,” White said. “Does that make it more affordable? I’m not sure.”
It’s important to keep in mind that gentrification could be playing a role in making once-affordable D.C. neighborhoods appear economically integrated. While Washington, D.C. recently fell to 13th place from 1st place on the National Community Reinvestment Coalition’s ranking of the most intensely gentrifying cities, the region continues to experience gentrification and displacement.
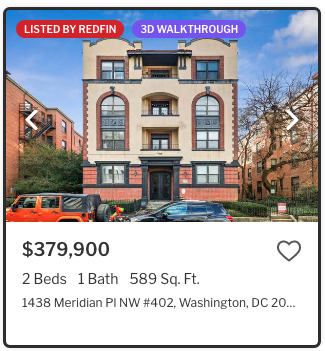
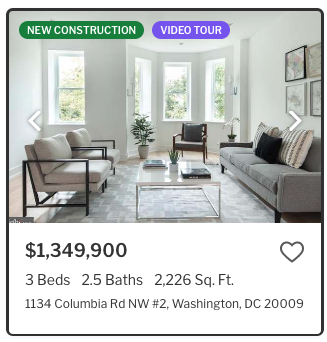
A top-floor condo in a pre-war building was recently on the market for $379,900 in Washington, D.C.’s Columbia Heights neighborhood, just a short walk from where a $1.3 million new-construction home was for sale.
In Los Angeles, more than three-quarters of homes (79.1%) are in high-end neighborhoods. While that’s an improvement from 88.6% in 2016, it still makes L.A. the city in this analysis with the highest share of properties in expensive neighborhoods. Just 16.3% of homes in L.A. are in economically integrated neighborhoods, and only 4.6% are in affordable neighborhoods.
Other expensive California cities, including San Francisco, San Jose and San Diego, also had relatively high proportions of homes in high-end neighborhoods.
“For the most part, L.A.’s neighborhoods are homogenous. Expensive homes are typically in expensive neighborhoods, and more affordable homes are in affordable neighborhoods,” said local Redfin real estate agent Sylva Khayalian. “A good example is Pasadena, where it’s almost impossible to find a home for under $900,000.”
Detroit falls on the other end of the spectrum, with 95.2% of homes in affordable neighborhoods. Just 3.5% of the city’s residential properties are in economically integrated neighborhoods, and only 1.3% are in high-end neighborhoods.
“Detroit is highly segregated by economic status,” said Redfin Chief Economist Daryl Fairweather. “Although the downtown and midtown areas have gone through a revitalization in recent years, much of the rest of the city remains trapped in a cycle of poverty where low property values lead to underfunding of schools and public services, which causes more affluent residents to leave, and further degrades property values.”
All values represents 2020, unless otherwise noted
For this analysis, we looked at more than 7.6 million properties across the 30 most populous U.S. cities for which there was sufficient data on home values. We define an affordable property as one with a monthly housing budget that’s no more than 30% of the local median 2019 monthly household income.
We estimated the monthly mortgage payment for each property by using the latest Redfin Estimate, along with the latest mortgage rate. We did not factor in property tax rates, income taxes, or utility costs. All properties were classified as either affordable or high-end to the median household.
Then, for each census tract (referred to as “neighborhoods” throughout the report), we calculated the ratio of affordable properties to high-end properties. If a census tract had three affordable homes for each high-end home, we deemed the neighborhood affordable. If it had three high-end homes for each affordable home, we labeled the neighborhood high-end. If it had about a proportionate number of affordable and high-end homes, we deemed the neighborhood economically integrated.


