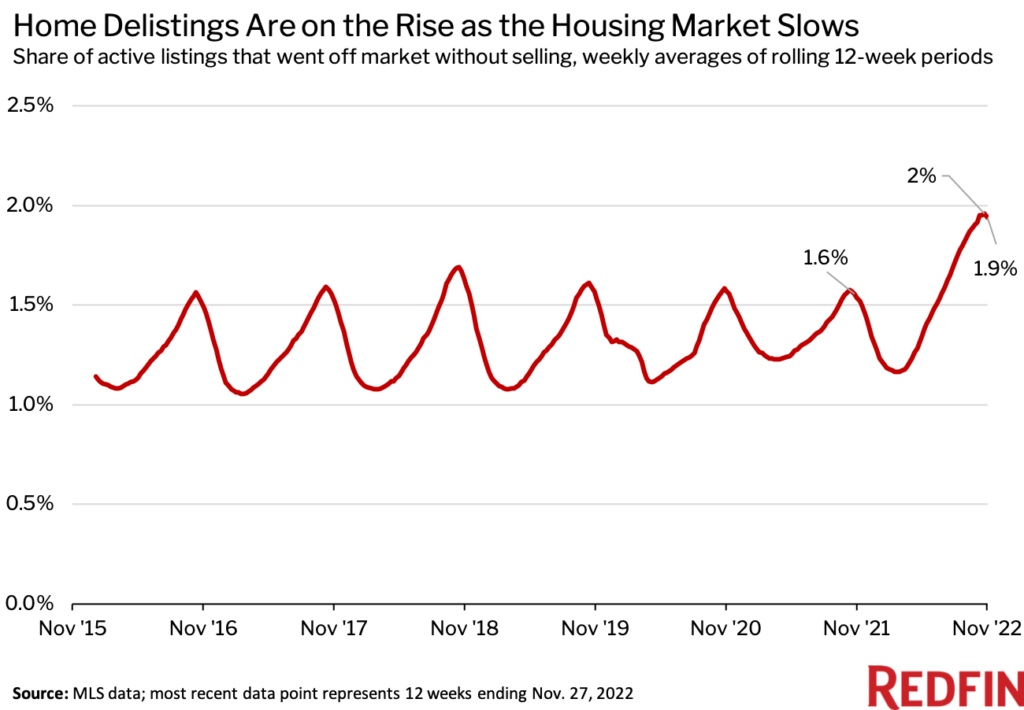
A record 2% of U.S. homes for sale were delisted each week on average during the 12 weeks ending Nov. 20, compared with 1.6% one year earlier. The share has come down a touch since then, declining to 1.9% during the 12 weeks ending Nov. 27, which include the Thanksgiving holiday.

This is according to a Redfin analysis of MLS data across 43 of the 50 most populous U.S. metropolitan areas—those with sufficient data. We define a delisting as a listing that went from active to off market without being sold. Homes delisted during the 12 weeks ending Nov. 27 could have been listed during that period or beforehand.
Sellers are taking their homes off the market because they’re often receiving no offers for the price they want to sell for, and sometimes, no offers at all. That’s due to a sharp drop in homebuyer demand driven by rising mortgage rates and persistently high home prices. While mortgage rates have dipped slightly since mid-November, the monthly mortgage payment on the median-asking-price home is still 40% higher than it was one year ago.
“Some sellers are having a hard time grasping that we’re not in a housing-market frenzy anymore—it’s tough for them to swallow that they missed the boat on getting a high price,” said Heather Kruayai, a Redfin real estate agent in Jacksonville, FL. “By the time sellers realize their listing was priced too high, it has already been on the market for too long and is considered stale. I recently had two sellers take their homes off the market after 45-plus days.”
In Sacramento, CA, 3.6% of active listings were delisted per week on average during the 12 weeks ending Nov. 27, up 1.6 percentage points from one year earlier—the largest increase among the metros Redfin analyzed. Next comes Austin, TX (1.5 ppts), Seattle (1.4 ppts), Phoenix (1.3 ppts) and Denver (1.2 ppts).
All five aforementioned housing markets saw home prices skyrocket during the pandemic, as most surged in popularity among remote workers. Now, with many buyers priced out, they’re among the fastest cooling markets in the country. In Austin, for example, the median home-sale price was up a record 43.5% year over year in the spring of 2021, but growth had shrunk to just 3.7% as of October 2022. And in Sacramento, there was 0% annual home-price growth in October, compared with as much as 29.3% last spring.
“I’ve had many sellers cancel listings,” said David Palmer, a Redfin real estate agent in Seattle. “Usually, sellers who pull their listings off the market in the fall do it with the intention of listing again in the spring. But with the word `recession’ out there, there’s not as much optimism about spring being a better market. Now people are talking about trying again in another year or two once the economy improves.”
There were six metros that saw a decrease in the share of delistings from a year earlier. The share fell by less than one percentage point in Warren, MI, Chicago, Newark, NJ, New Brunswick, NJ, Detroit and Montgomery County, PA—markets that have been relatively resilient during the housing-market slowdown.
Sacramento not only saw the biggest year-over-year jump in delistings; it also had the highest overall share, with 3.6% of for-sale homes delisted per week on average during the 12 weeks ending Nov. 27. It was followed by San Francisco (3.4%), Oakland, CA (3.3%), Seattle (3.2%) and San Jose, CA (3%).
One reason the most expensive housing markets tend to have the highest share of delistings is that the pool of buyers who can afford pricey homes is relatively small, meaning there’s a higher chance a seller will receive low interest in their home.
Pittsburgh had the lowest share of delistings, at 1.3%, followed by Cincinnati, at 1.4%. Rounding out the bottom five are New Brunswick (1.5%), Newark (1.6%) and Virginia Beach, VA (1.6%).


