

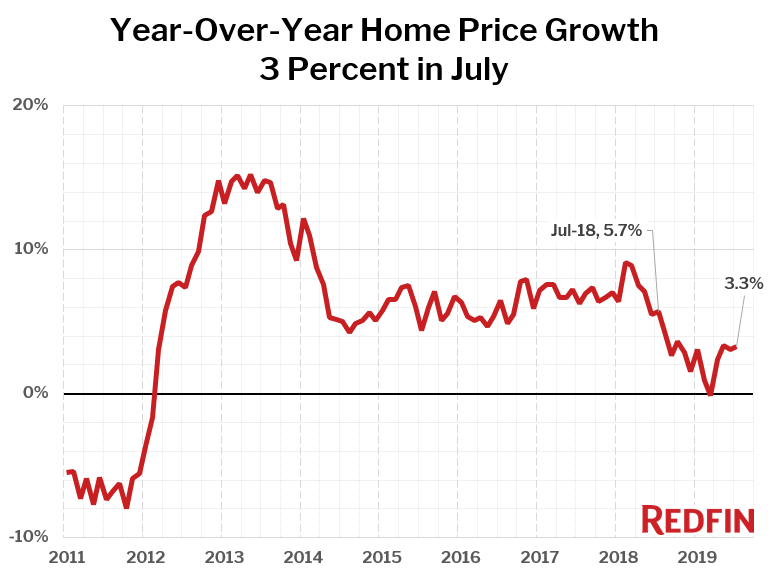
U.S. home-sale prices grew at a steady 3.3 percent rate year over year to a median of $318,100 across the metros Redfin tracks. Home prices have been growing in the healthy 3 percent range since May.
Overall the market in July didn’t hold any big surprises, although it is notable that the number of homes for sale at the end of the month fell for the first time in a year. Home sales were down for the second month in a row.
Just seven of the 85 largest metro areas Redfin tracks saw a year-over-year decline in their median sale price, the biggest of which was in Bridgeport, CT, where home prices were down 6.2 percent from a year earlier. San Jose (-3.3%), New York (-3.1%), Oakland, CA (-2.6%), Seattle, WA (-1.7%), New Haven, CT (-0.9%) and San Diego (-0.2%) rounded out the list of metro areas with price drops.
“July home prices and sales were weaker than I had expected, especially given that falling mortgage rates have been luring homebuyers back to the market since early spring,” said Redfin chief economist Daryl Fairweather. “Even though we’ve seen increased interest from homebuyers—especially compared to a year ago when mortgage rates were climbing—uncertainties in the overall economy and talk of a looming recession have people feeling jittery about making a huge purchase and investment. But I think the odds are that we won’t see a recession within the next year. If rates stay low and the economy continues to grow, we’ll see more homebuyers come back in a serious way in 2020, and the market will be much more competitive.”
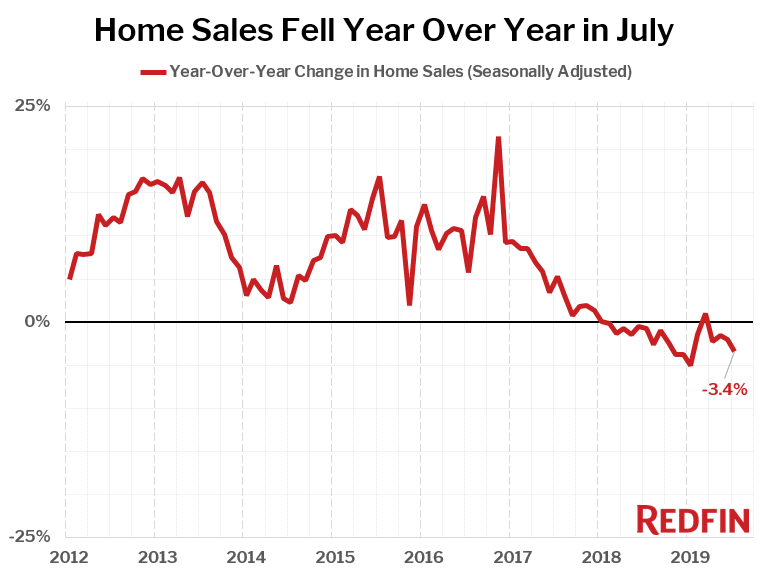
Home sales fell 3.4 percent in July compared to a year earlier. A majority of the metro areas tracked by Redfin—70 of 85—saw declining home sales compared to July a year ago.
The metro areas with the largest declines in sales were Miami, FL (-22.9%), Detroit, MI (-18.9%) and New York, NY (-13.9%).
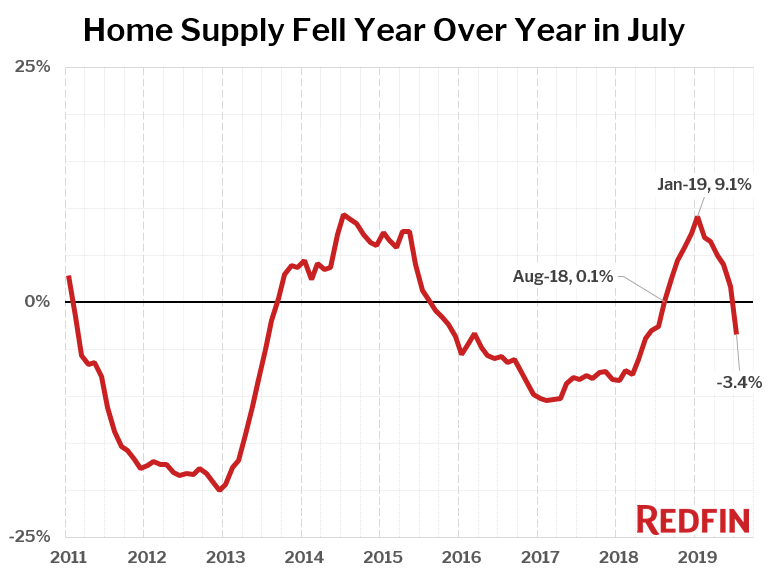
The supply of homes for sale fell 3.4 percent year over year, the first decline in a year. Just 28 of the 85 metros tracked by Redfin saw an increase in the number of homes for sale compared to a year earlier.
The three metro areas with the biggest increases in the number of homes for sale were spread all across the country: Oxnard, CA (+22.4%), Boston, MA (+18.1%) and Honolulu, HI (+17.4%). All three of the metros with the biggest increases in homes for sale have home prices well above the $318,100 national median. The biggest declines in the number of homes for sale were in New Orleans, LA (-28.3%), Rochester, NY (-27.9%) and Tulsa, OK (-22.5%)—all metros with home prices significantly below the national median price.
Measures of competition in the housing market indicated a moderate cooling trend in July. The speed at which homes went off the market slowed slightly, to 38 days, up from 36 a year earlier. This is a continuation of the trend over the past seven months, when the speed of sales has slowed by an average of two days compared to last year. The share of homes sold above list price was 23.9 percent in July, down from 27.1 percent a year earlier, following the declining trend that we have seen over the last 12 months.
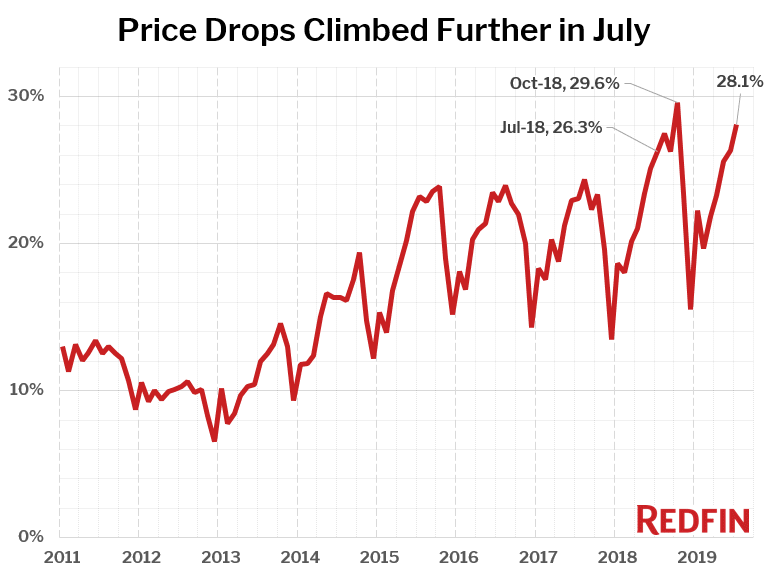
Also, 28.1 percent of homes listed for sale had a price drop in July, up from 26.3 percent in July 2018. This is the second-highest rate of price drops on record, only surpassed by the 29.6 percent rate last October.
Competition
Prices
Sales
Inventory
Home Sale Price Predicted Discounts and Premiums
Below are market-by-market breakdowns for prices, inventory, new listings and sales for markets with populations of 750 thousand or more. For downloadable data on all of the markets Redfin tracks, visit the Redfin Data Center.
