

The median home-sale price in urban areas nationwide rose 15.9% year over year to $292,263 in the four weeks ending February 21, compared with a 15.5% increase to $332,291 for homes in suburban neighborhoods and a 14.3% increase to $284,593 for those in rural neighborhoods.
Although price growth is just slightly higher for homes in urban areas than the two other neighborhood types, it marks the first time since March 2020 that home-price growth in urban areas has surpassed that of suburban and rural places.
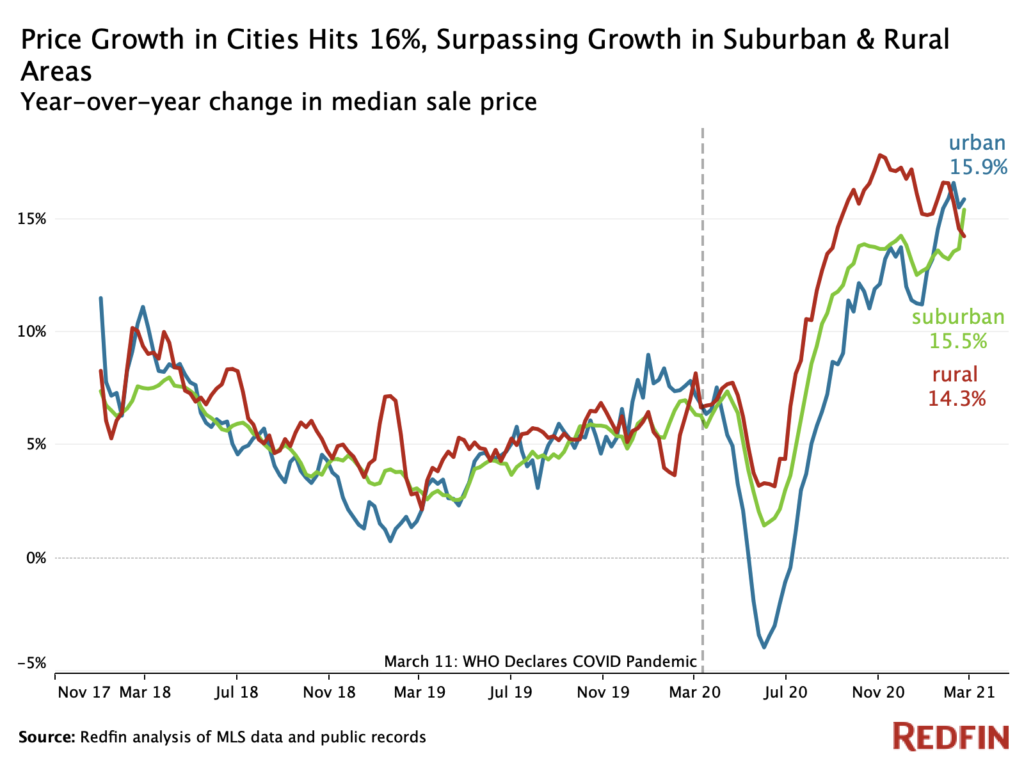
While suburban and rural homes are still hot, housing market data is illustrating renewed homebuyer interest in urban areas as coronavirus vaccines deliver hope for a return to an urban lifestyle. Price growth in urban areas is near a record high, while rural price growth reached a peak of 17.9% in October and has declined since then.
Homebuyer interest in rural areas spiked at the beginning of the pandemic in April when city life ground to an abrupt halt and remote work and homeschooling became commonplace, and the rural housing market remained hot through the summer and fall.
“For all the talk of an urban exodus, the housing market in cities is as hot as we’ve ever seen it, especially for single-family homes,” said Redfin Chief Economist Daryl Fairweather. “There are plenty of buyers out there with deep pockets who are coming out ahead financially during the pandemic. They want a house with lots of space while they are still working from home, but they also want to live in a walkable area near urban amenities as shops and restaurants reopen. Those wealthy buyers are willing to pay high prices to have it all.”
Baltimore, Detroit and Cleveland, all relatively affordable metro areas, are helping drive national urban price growth. Home prices in urban parts of Baltimore were up 37.8% to $180,938 in the four weeks ending February 21, the highest growth of the 50 largest U.S. metros. Prices in urban Detroit were up 37.7% to $78,990, and they were up 33.4% to $103,875 in Cleveland.
On the other end of the spectrum, urban price growth is slowest in expensive metros. Home prices in urban parts of San Francisco, the only place where urban prices dropped in the four weeks ending February 21, declined 1.4% to roughly $1.3 million. Prices in urban parts of New York rose just 2.2% to $664,350, the smallest growth of any metro, followed by a 5.5% increase to $475,321 in Washington, D.C.’s urban areas. The suburban neighborhoods in all three of those metros are experiencing bigger price growth: 7.1% in San Francisco, 13.5% in New York and 8.3% in Washington, D.C. Scroll down to see the 10 metros with the biggest and smallest price growth in urban areas.
Nationwide, price per square foot has been growing fastest in urban areas since the beginning of February. Like overall price growth, it’s the first time that has happened since before the pandemic. The median price per square foot of homes in urban areas rose 17.9% in the four weeks ending February 21, compared with 15.9% for suburban neighborhoods and 15.5% for rural neighborhoods. The fact that price per square foot is growing fastest in urban areas is an indication that homebuyers are placing a premium on space inside cities.
Prices are rising faster for single-family homes in urban areas than single-family homes overall. Price per square foot for single-family homes inside cities nationwide rose 16% year over year in January, compared with a 14% increase for single-family homes in metro areas, which include suburbs, rural areas and cities. Condos in metro areas saw price per square foot rise 6% year over year, and condos in cities experienced 4% growth.
“During the summer and fall, buyers were searching for more indoor and outdoor space, even if it meant moving out past the suburbs. But I think we’ve passed the peak of that trend and people are starting to come back to the city,” said Seattle Redfin agent Bliss Ong. “The hottest areas are residential neighborhoods inside city limits. Buyers aren’t necessarily looking for condos downtown, but some of them are placing a premium on walkability and proximity to shops and restaurants again.”
Pending home sales were up 25% year over year in urban areas in the four weeks ending February 21, compared with 20.8% in suburban areas and 32.1% in rural areas. Growth in pending sales–an indicator of current homebuyer interest–in urban areas started to outpace that of suburban areas since the beginning of February, a reversal from the trend since at least the beginning of the pandemic.
Closed home sales were up slightly in all three neighborhood types in the four weeks ending February 21: 4.7% in urban areas, and 3.6% each in suburban and rural neighborhoods.
The total number of homes for sale in urban areas fell 21% in the four weeks ending February 21, compared with a 42.9% in suburban neighborhoods and a 46.6% drop in rural areas. There’s a severe shortage of homes for sale throughout the country, regardless of neighborhood type.
New listings of homes for sale were down 5.2% in urban areas over the same time period, the biggest drop since June. Meanwhile, new listings declined 13.7% in both suburban and rural neighborhoods.
The typical home in an urban area spent 38 days on the market before going under contract in the four weeks ending February 21, versus 31 days in suburban areas and 42 days in rural areas.
Homes in urban areas are selling 16 days faster than a year ago. Homes in suburban neighborhoods are selling 24 days faster than last year, and in rural areas they’re selling 35 days faster.
Homes in all three neighborhood types hit record lows in terms of days on market in the fall before swinging slightly upward over the last three months.
Pageviews of homes in large metro areas–which includes cities and their surrounding suburbs– on Redfin.com increased 43% from the year before in February. That’s up from a low of 5% in April, just after the onset of the pandemic, and down from a peak of 200% growth in October.
Redfin.com pageviews of homes in rural areas increased 57% year over year in February, a return to pre-pandemic growth rates and a major deceleration from a 273% peak in August. The story is similar in small towns, where pageviews rose 62% year over year in February, making a return to growth rates last seen in late 2019.
The fact that growth of pageviews of homes on Redfin.com in all neighborhood types could be an indication that overall homebuyer demand is calming slightly from the frenzy of late 2020.

The housing market data in this report divides rural, suburban and urban based on categories from the U.S. Department of Housing and Urban Development, which built a model to describe neighborhood types based on responses to the 2017 American Housing Survey.
Note that the categories in the section about Redfin.com pageviews are different from the categories in the section on Redfin housing market data. The pageviews section divides areas into large metro areas (metro areas with a population of more than 1 million, which includes both urban and suburban neighborhoods), small towns and rural areas, while the Redfin housing market section divides areas into rural, suburban and urban neighborhoods.
