Home sales fell 35.1% year over year in November on a seasonally-adjusted basis—the largest decline in Redfin’s records that date back to 2012. Home-price growth also lost momentum. The median U.S. home-sale price rose just 2.6% from a year earlier, the smallest gain since May 2020, when the onset of the coronavirus pandemic brought the housing market to a near halt.
The housing market continued to cool in November as elevated housing costs kept buyers and sellers on the sidelines. New listings slumped 28.4% year over year, the biggest drop on record aside from April 2020. Despite the decrease in listings, overall supply rose 4.6% from a year earlier—a sign that homes lingered on the market as demand ebbed. Indeed, the typical for-sale home took 37 days to go under contract, up from 23 days a year earlier.
But there are early signs that demand may be starting to creep back as mortgage rates fall. There was a slight downtick in the portion of home-purchase agreements that were canceled in November, and mortgage applications and Redfin’s Homebuyer Demand Index have both been on the rise. Still, these early indicators haven’t translated into more home sales.
Mortgage rates reversed course in late November, dropping below 6.5% after soaring to the highest level in roughly two decades (7.08%) earlier in the month, but they’re still twice as high as they were a year ago. The recent decline was driven by signs of easing inflation, which this week prompted the Federal Reserve to slow the pace of interest-rate hikes. But the Fed signaled that it has more work to do to quell inflation and isn’t yet finished raising rates.
“The worst of inflation is likely in the rearview mirror,” said Redfin Economics Research Lead Chen Zhao. “We do anticipate that mortgage rates will decline slightly further in 2023 as the Fed’s actions continue to bring inflation down, which should ultimately bring more homebuyers back to the market. Still, we have a ways to go until we reach recovery mode, and we may see sales continue to ebb in the short term.”
Zhao continued: “Prospective buyers in places like San Francisco and Austin, where prices have already fallen from a year ago, should pay close attention to a potential turnaround; it could be the time to take action as demand and competitive offers could pick up in the coming months.”
Note: Data is subject to revision
Data in the bullets below came from a list of the 90 U.S. metro areas with populations of at least 750,000, unless otherwise noted. For national and metro-level charts and trends, head to the Redfin Data Center. Refer to our metrics definition page for explanations of metrics used in this report.
Scroll down for market-by-market breakdowns on competition and home-purchase cancellations, which can’t be found in the Data Center.
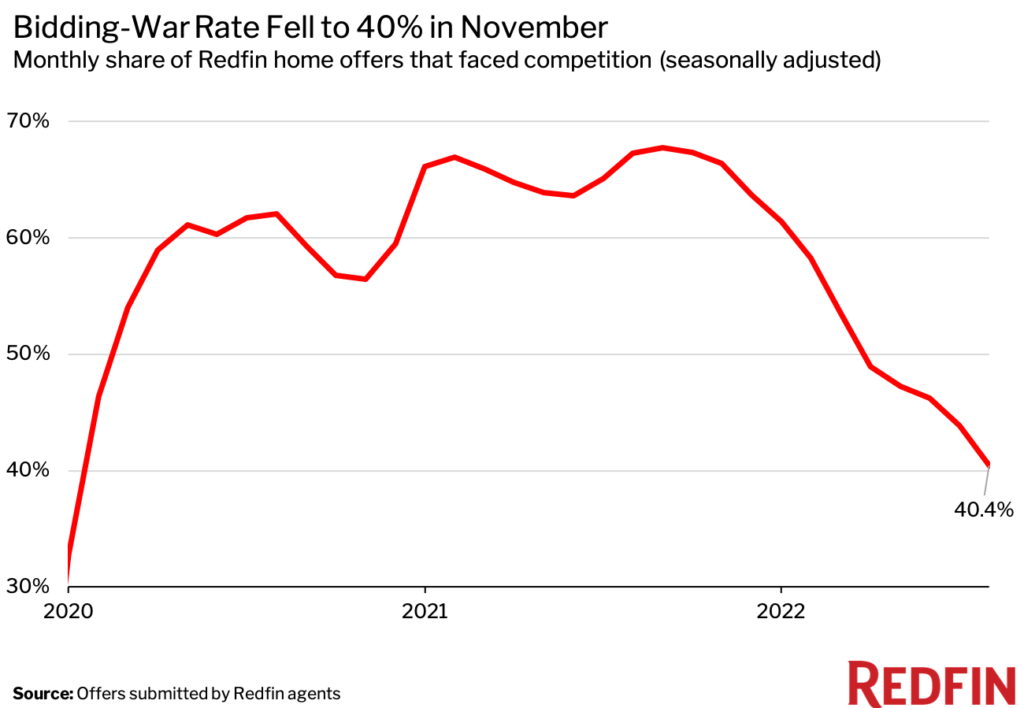
Data below came from a list of 35 metros—those that had a monthly average of at least 50 offers submitted by Redfin agents from March 2021 to March 2022. An offer is considered part of a bidding war if a Redfin agent reported that it received at least one competing bid. The table is ranked from lowest competition rate to highest.
Note: Metro-level competition data is not seasonally adjusted.
Data below came from a list of the 50 most populous metro areas and is ranked from highest percentage of cancellations to lowest. San Antonio is excluded due to insufficient data.