
![]()
Denver Sees 6.8% Increase in Inventory, First Growth Since October 2010
Sales of Multifamily Units in Nashville Up an Astonishing 166.7%
Median Sale Price in Washington, DC Area Falls 0.3%, First Drop Since February 2011
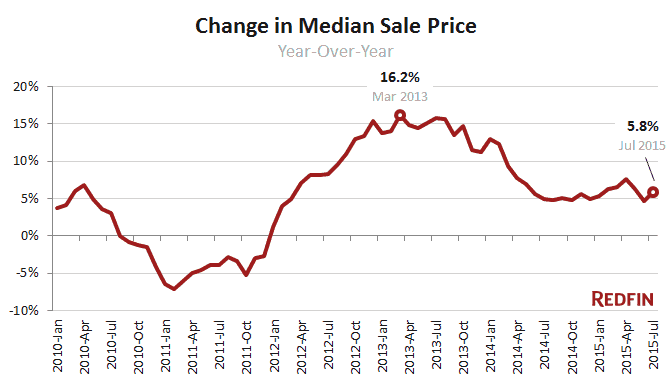
The supply of homes for sale remained very low at the end of July at just 2.9 months, a small uptick from the record low set in June. Home sales remained strong with an increase of 13.4 percent over last July, and price growth jumped to 5.8 percent year over year, up from 4.6 percent in June. New listings were up 8.1 percent.
Sales and price growth were right in line with what the Redfin Demand Index forecasted last month for the 15 metro areas it tracks.
Amid the competition this year, more buyers have been willing to make concessions in order to win their bid on a home. In July, 12.7 percent of Redfin offers waived inspection contingencies, up from 8.6 percent a year ago, while 15.3 percent waived financing contingencies, up from 11.5 percent. Furthermore, 15.2 percent of Redfin customers submitted offers with price escalation clauses, more than in any prior month since Redfin launched Offer Insights.

Competition continued to be extremely heated in San Francisco, San Jose, Oakland, Seattle and Denver. The typical home in San Francisco sold for 8.7 percent above the listing price.


While the market overall in July did not differ greatly from June, a small month-over-month drop in new listings (-2.3%), sales (-2.2%), and an increase in median days on market (+1) signal the start of a cooling housing market. We expect a normal seasonal transition away from the peak of buying and selling activity seen in June and July, and a gradual easing of competition heading into fall and winter.
You can download data from the July Market Tracker in an Excel Spreadsheet.
For additional local analysis, see: Chicago | San Francisco | Washington, D.C.
Methodology: Redfin’s National Market Tracker follows housing trends in the country’s largest metropolitan divisions (those with population 500,000 or greater) served by Redfin agents. Analysis by Redfin is based on all residential home sales transacted on the multiple-listing service and supplemented by county recorder data where available. Data may be subject to revision. Metropolitan divisions are based the latest definitions released by the Bureau of Labor Statistics. To view a breakdown of these regions, click here.
