

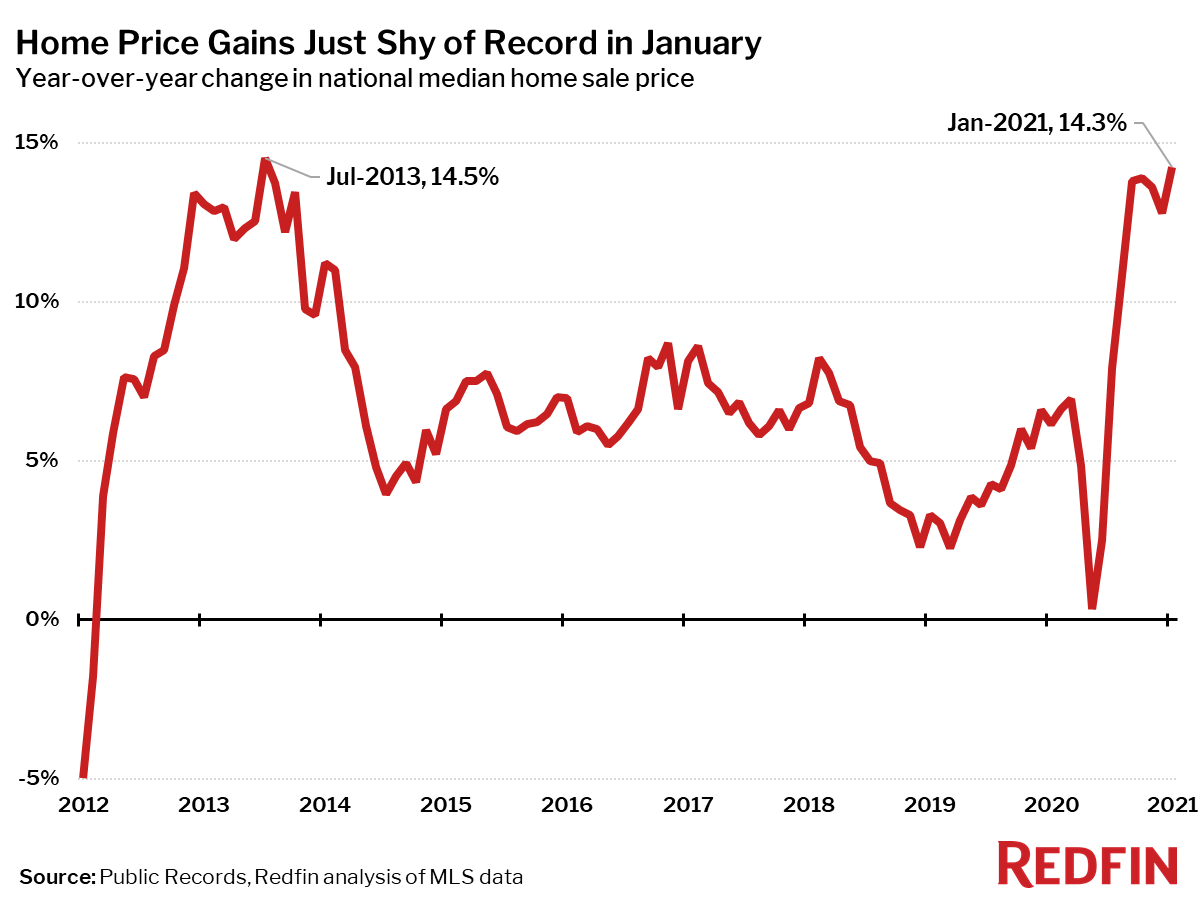
The national median home-sale price rose 14% year over year to $330,500 in January, an annual gain just shy of the largest increase seen since 2013, which was 14.5% in July 2013. Closed home sales were up 20% from a year earlier and pending sales were up 37%, while new listings fell 6%.
“The imbalance between supply and demand reached a new high in January,” said Redfin Chief Economist Daryl Fairweather. “Buyers were eager to make offers and make them quickly to take advantage of historically low mortgage rates while they last. But many homeowners who want to move feel stuck with limited options of homes to move to, frustrated about homes finding buyers within hours of hitting the market and defeated after repeatedly losing out in bidding wars. People who are committed to finding a home this season should plan for the harsh reality that they may need backup homes in mind when they go on a home tour and when they submit an offer, or be prepared to wait weeks or months for another ideal home to hit the market..”
Median prices increased from a year earlier in all 85 of the largest metro areas Redfin tracks. The smallest price gains compared to a year earlier were in San Francisco (+3%) and New York City (+5%). The largest price increases were in Camden, NJ (+29%), Allentown, PA (+26%) and Detroit (+25%).
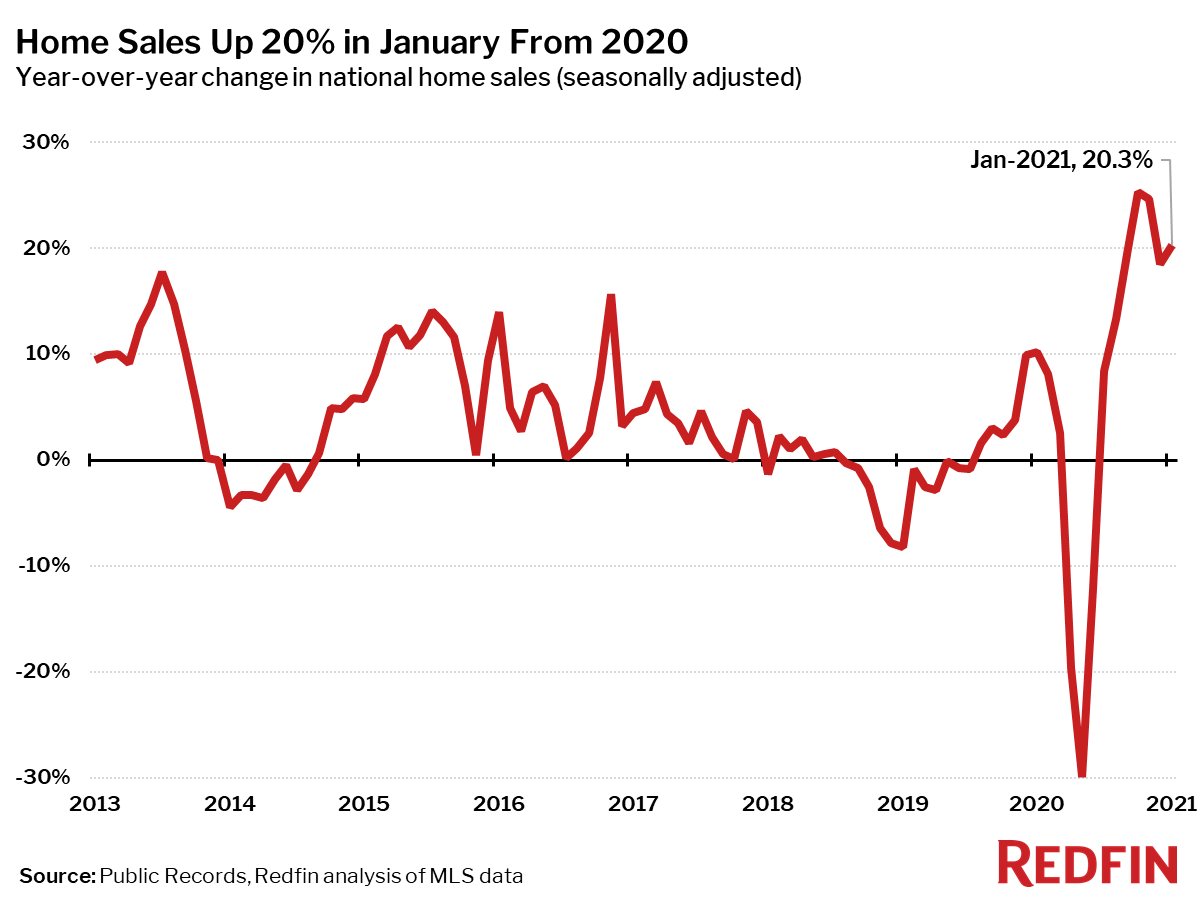
Home sales were up 20% in January from a year earlier on a seasonally-adjusted basis, down from the record high of 25% set in October, but still the third-highest gain on record since at least 2013.
The number of homes sold in January was up from a year earlier in all but five of the 85 largest metro areas Redfin tracks. The largest gains in sales were in San Francisco (+44%), San Jose, CA (+43%) and Bridgeport, CT (+42%). The metro areas where home sales fell the most were Grand Rapids, MI (-8%) and Denver (-2%). Sales were down less than 1% in Detroit, Memphis, TN and Salt Lake City.
Active listings—the count of all homes that were for sale at any time during the month—fell 24% year over year to their lowest level and the largest year-over-year drop on record in January, the 18th-straight month of declines.
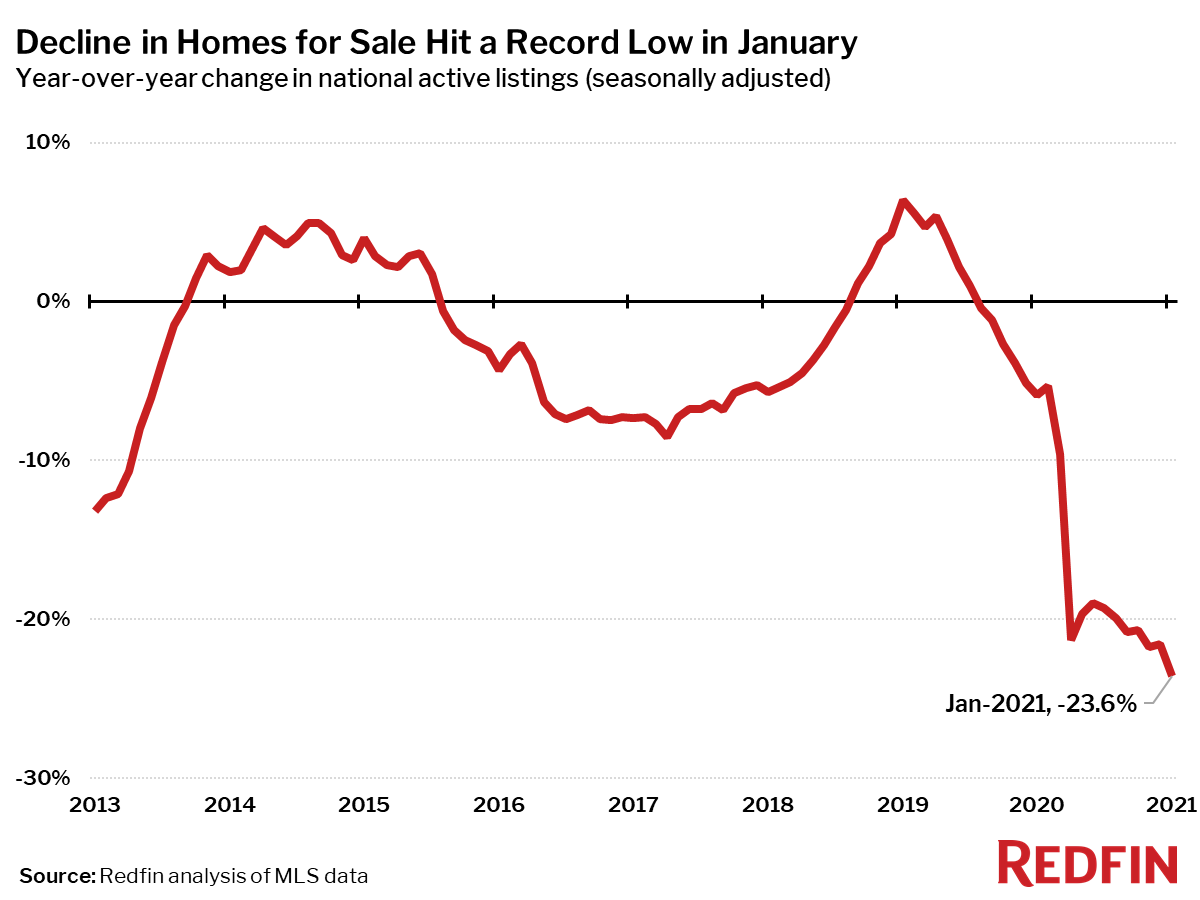
Only four of the 85 largest metros tracked by Redfin posted a year-over-year increase in the count of seasonally-adjusted active listings of homes for sale. The largest gains were in San Francisco (+51%), San Jose, CA (+26%) and Oakland, CA (+3%). New York City also saw a small increase of less than 1%.
Compared to a year ago, the biggest declines in active housing supply in January were in Salt Lake City (-66%), Allentown, PA (-55%) and Baton Rouge, LA (-54%).
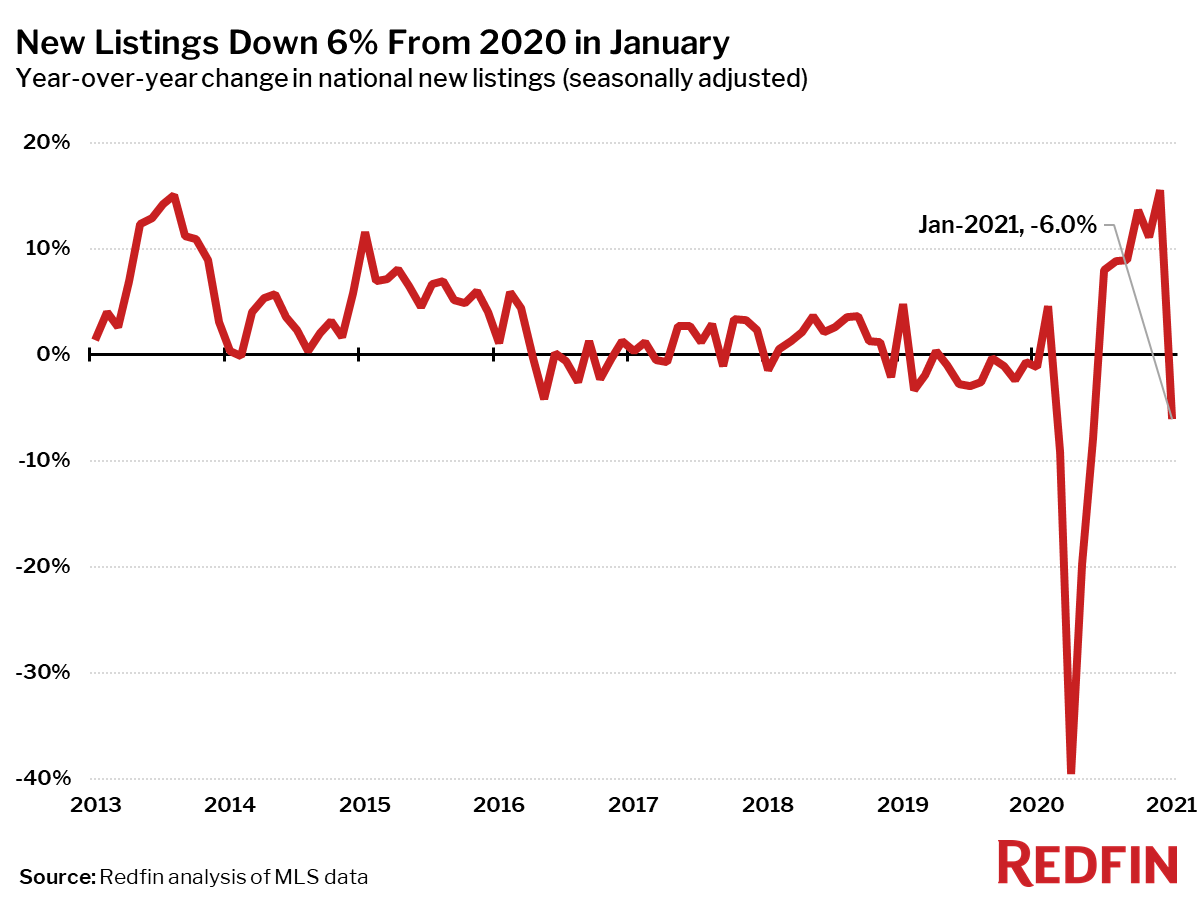
New listings of homes for sale fell 6% in January from a year earlier, a reversal from the previous six months of gains, while pending sales continued to soar, up 37% from 2020.
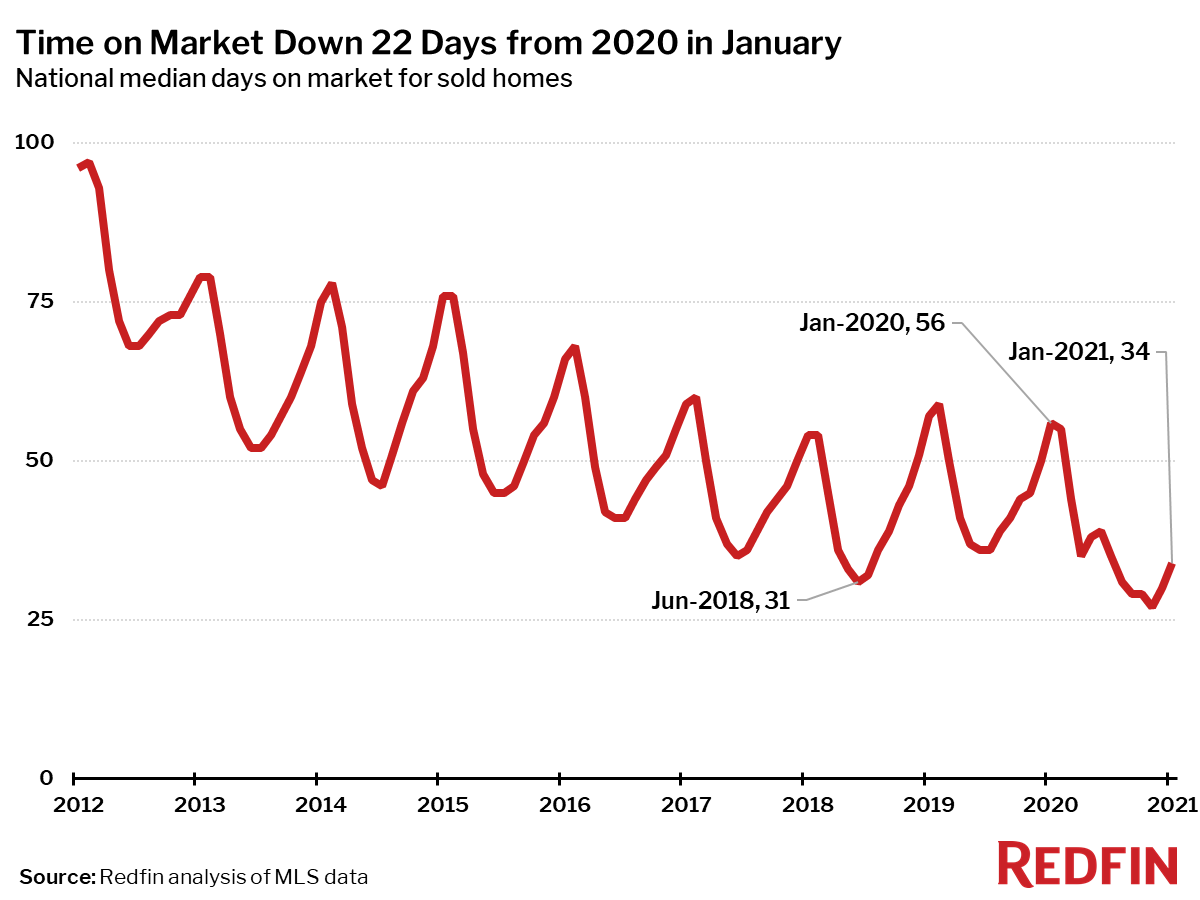
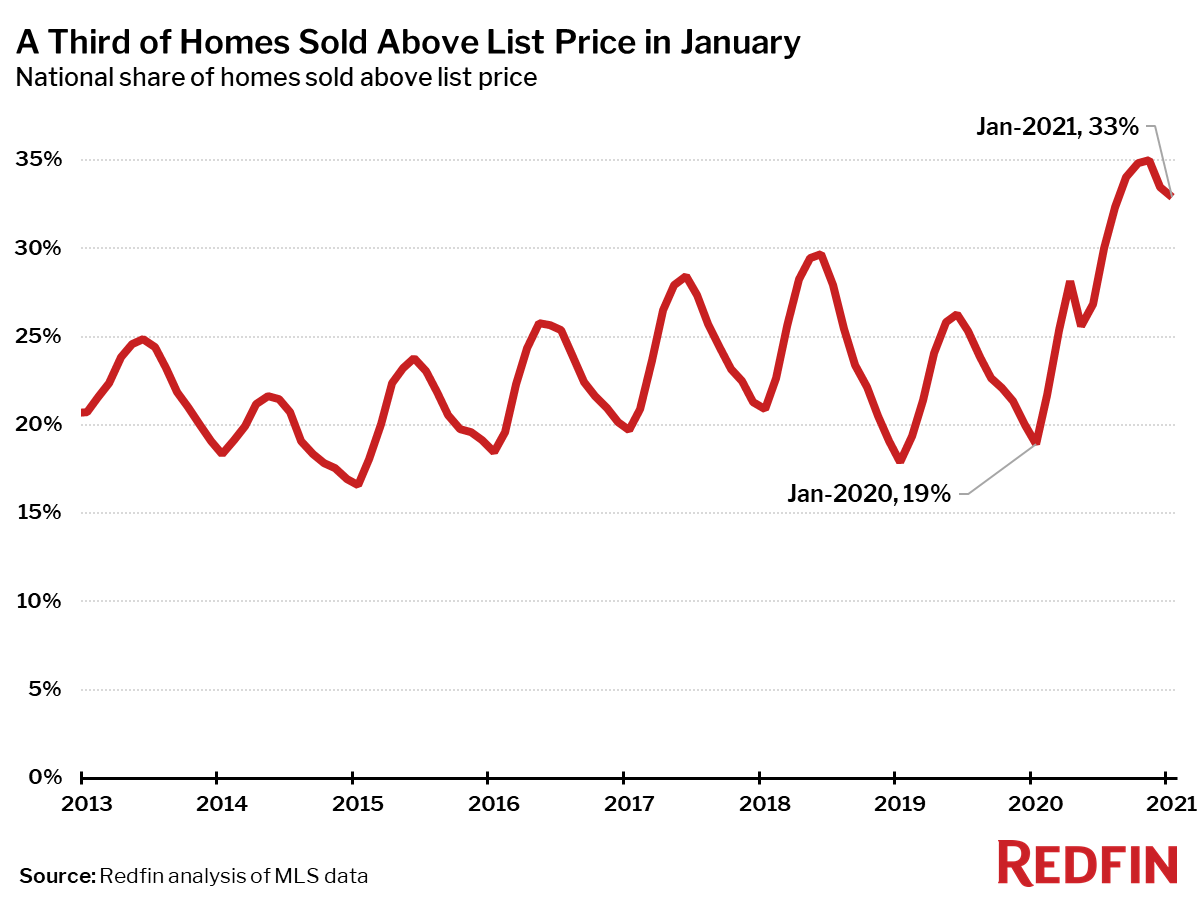
Measures of competition such as time on market and the share of homes sold above list price showed some seasonal softening in January, but remain at the most extreme levels ever seen for this time of year, providing little relief for hopeful homebuyers.
The typical home that sold in January went under contract in 34 days—22 days fewer than a year earlier.
In January, 33% of homes sold above list price, down slightly from the peak of 35% in November, but up from 19% a year earlier.
Competition
Prices
Sales
Inventory
Redfin Estimate
Below are market-by-market breakdowns for prices, inventory, new listings and sales for markets with populations of 750,000 or more. For downloadable data on all of the markets Redfin tracks, visit the Redfin Data Center.
