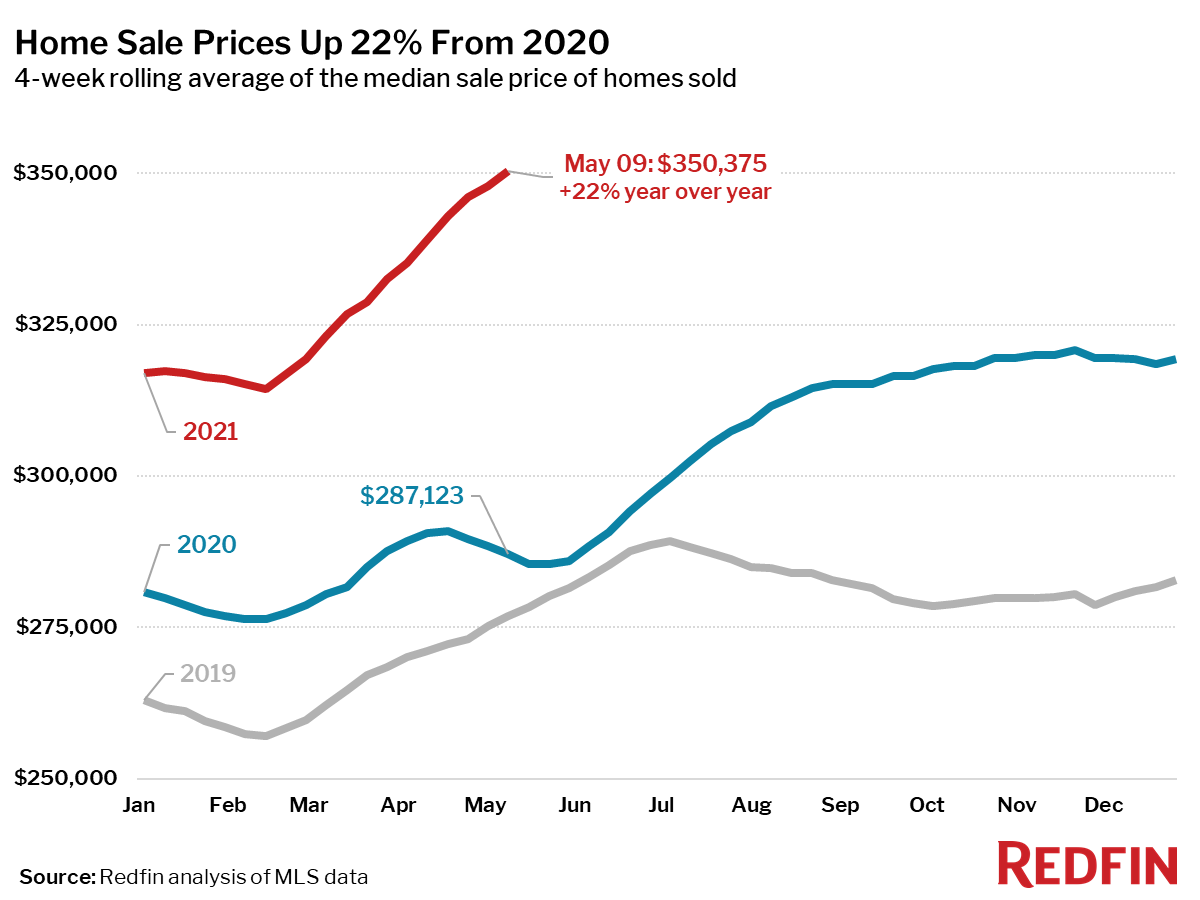
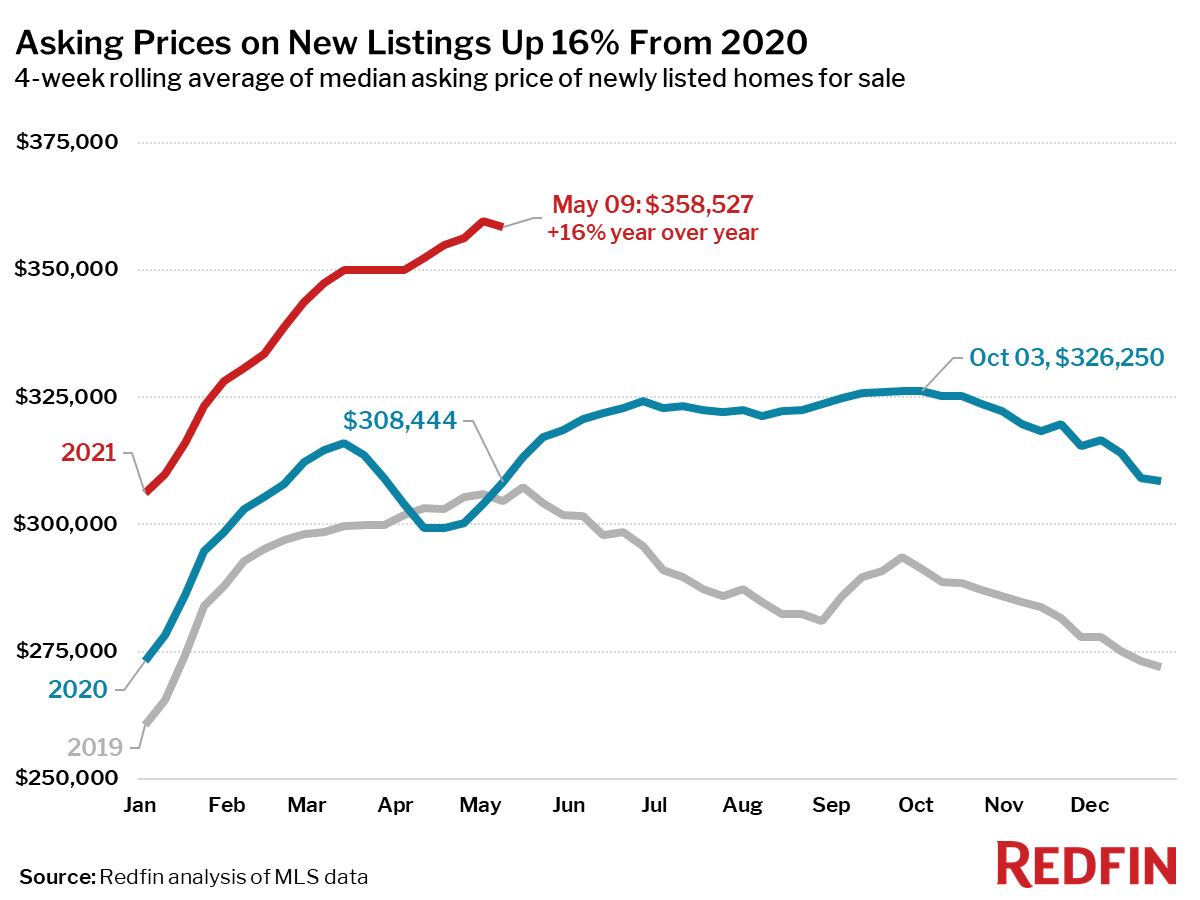
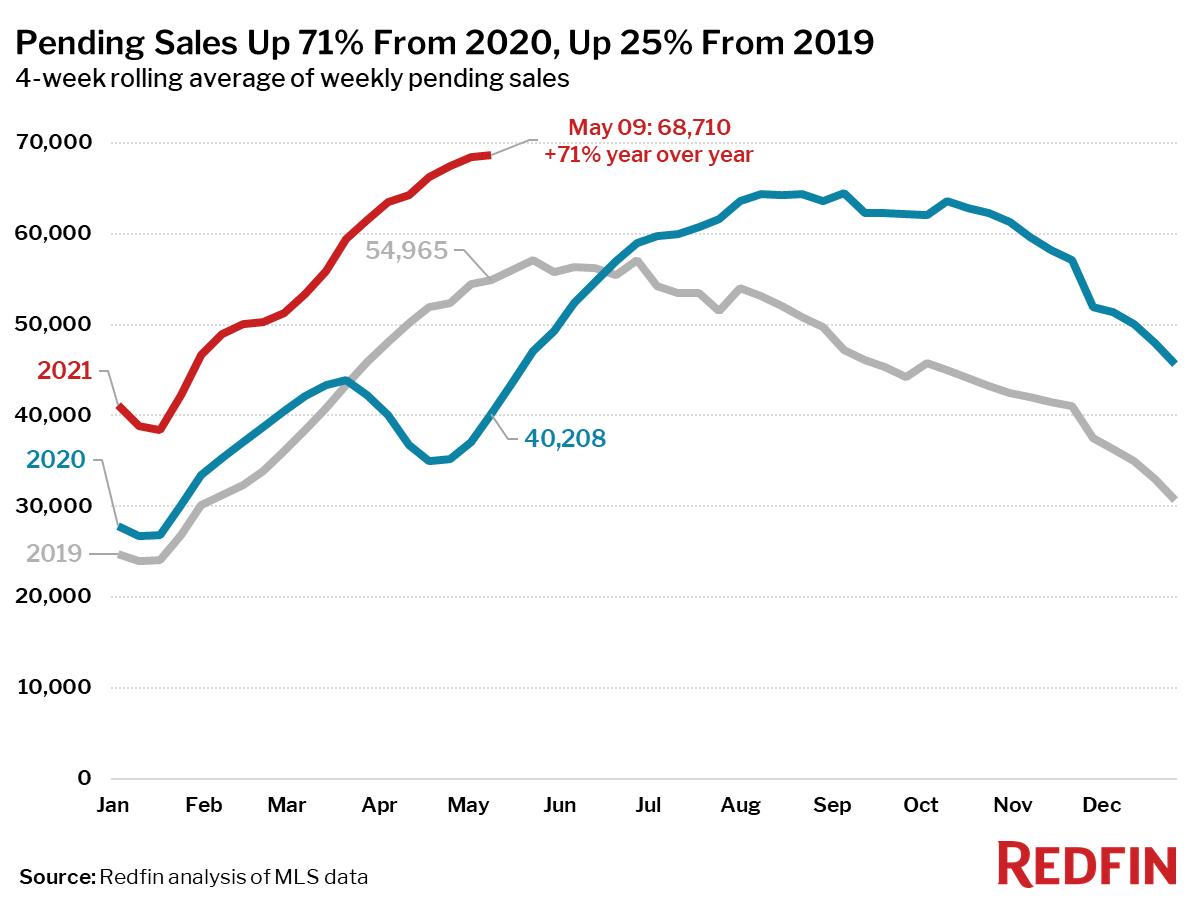
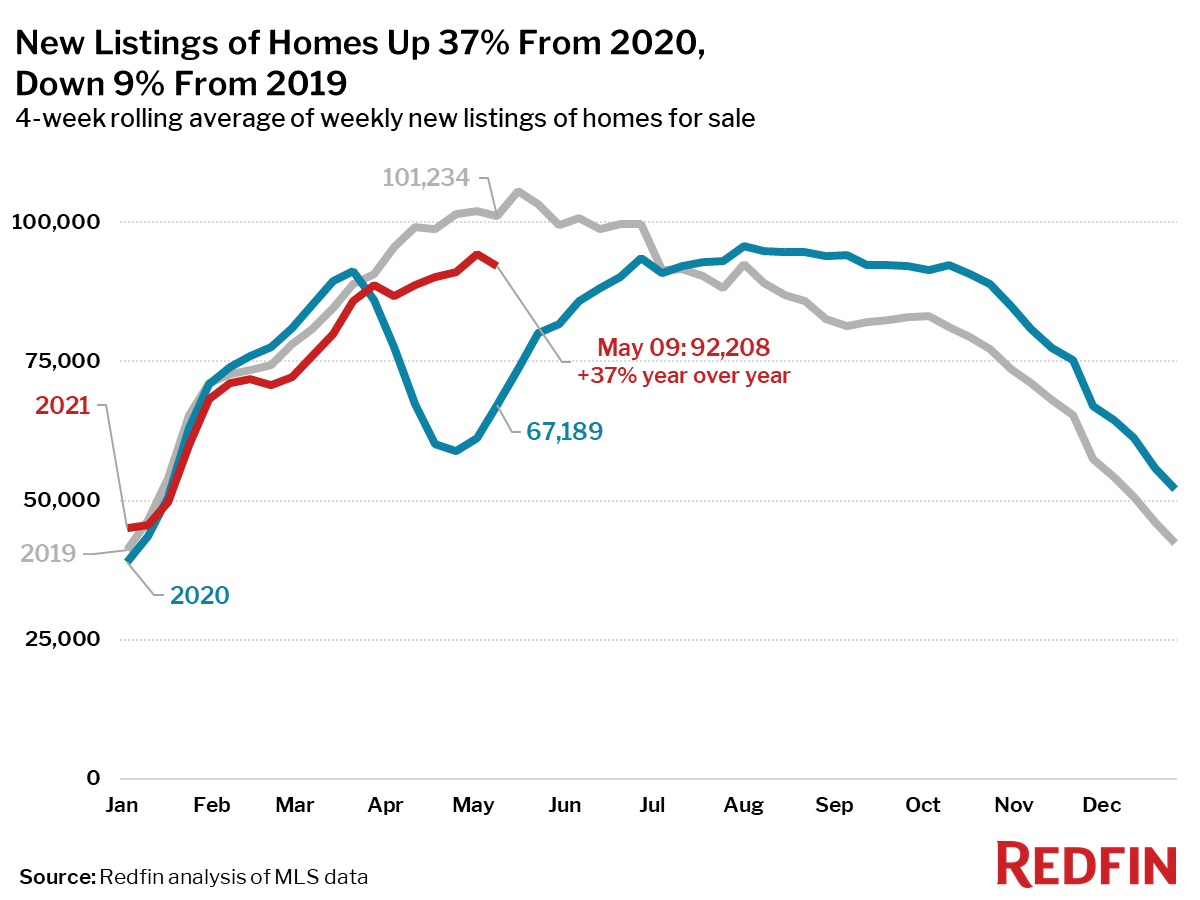
Unless otherwise noted, this data covers the four-week period ending May 9.
Note: At this time last year, pandemic stay-at-home orders halted homebuying and selling, which makes year-over-year comparisons unreliable for select housing metrics. As such, we have broken this report into two sections: metrics for which a year-over-year comparison remains most relevant, and metrics for which it makes more sense to compare to the same period in 2019.
Each of the metrics highlighted in the following list set a new housing record going back at least as far as 2012, when Redfin’s data began.
Mortgage purchase applications increased 1% week over week (seasonally adjusted). For the week ending May 13, 30-year mortgage rates decreased slightly to 2.94%.
“The housing market has gone from one extreme—the onset of the pandemic—to another—the rush to buy primary and second homes while mortgage rates remain near historic lows,” said Redfin Chief Economist Daryl Fairweather. “Later this year the dust will settle to reveal the new normal for both the economy and the housing market. Many people are getting new clarity on what their personal new normal will be like, and oftentimes that new reality will involve a new home to match their new lifestyle. So I expect home sales to continue to grow for the foreseeable future, even as home price growth slows a bit. This home sale boom is nowhere close to over.”
Refer to our metrics definition page for explanations of all the metrics used in this report.