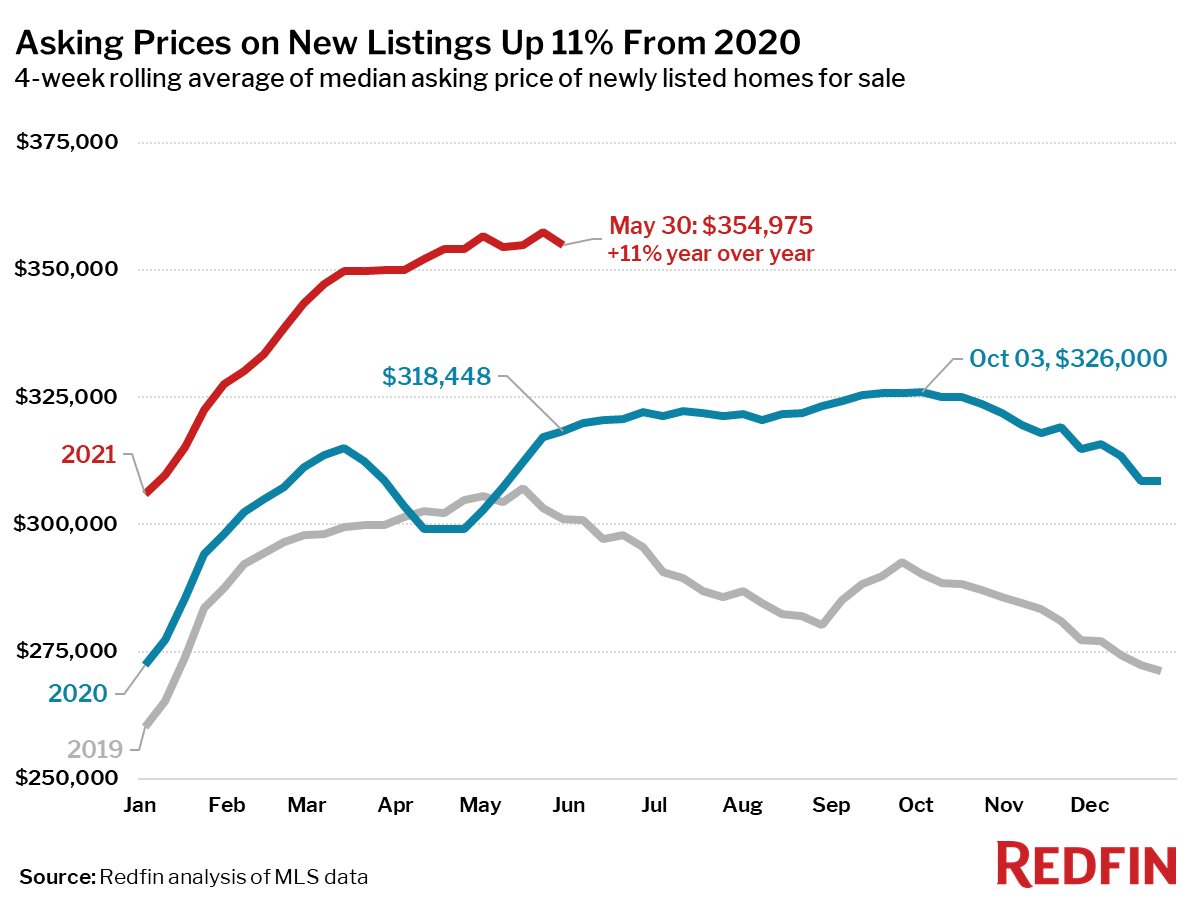
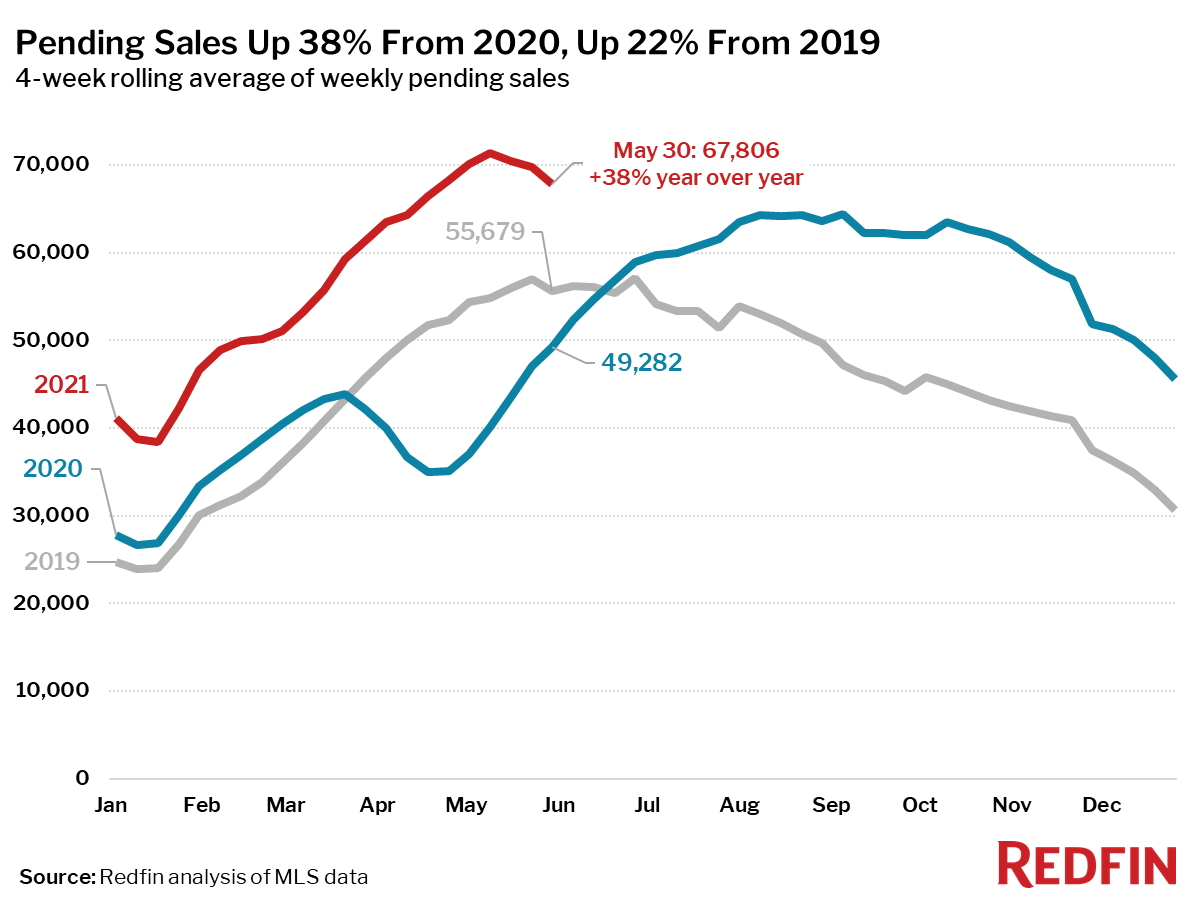
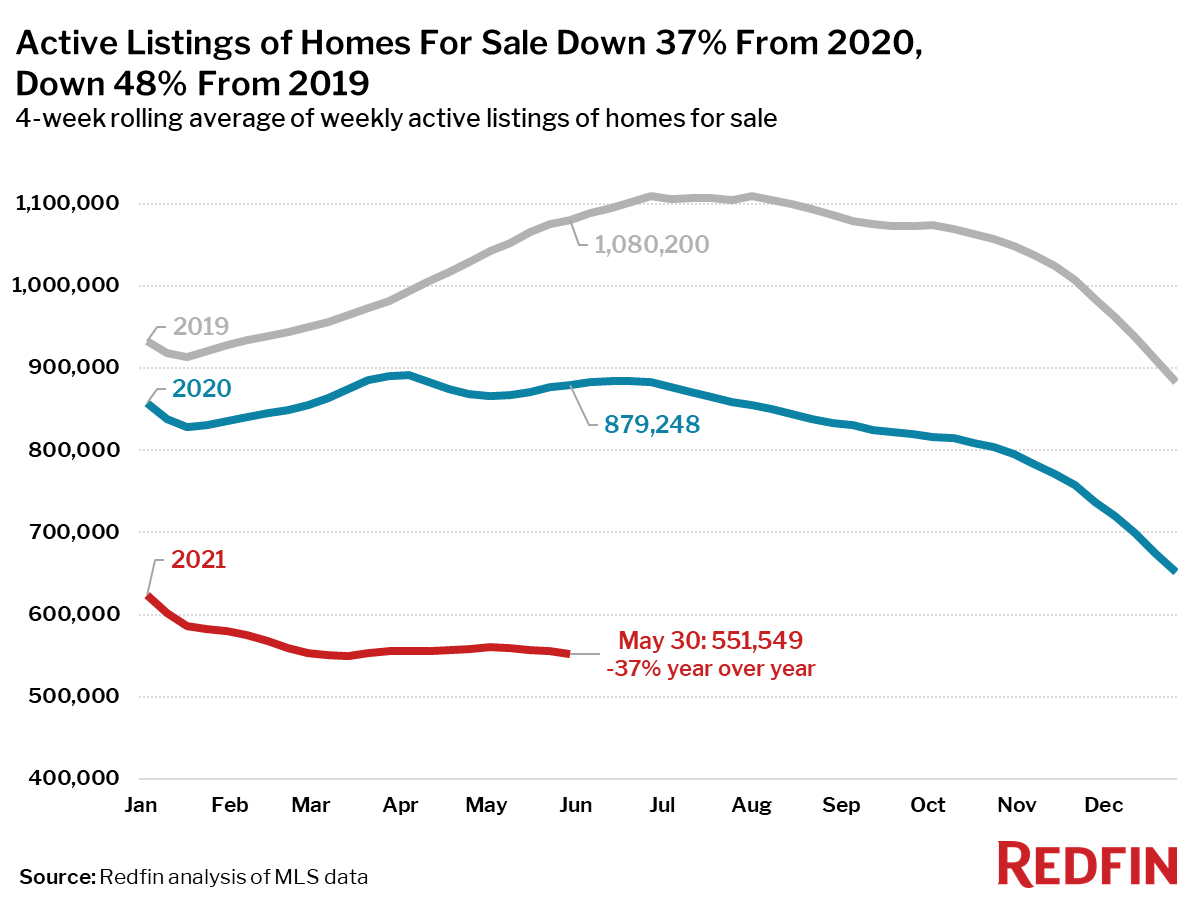
The housing market’s temperature may be starting to drop by a degree or two. Both pending sales and asking prices began to decline or flatten in the four weeks ending May 30. It’s too soon to tell if these are early seasonal changes or the start of the post-pandemic cooldown we predicted earlier this year. The period in question includes the beginning of Memorial Day weekend, which this year marked a return to “normal” life. It may also have marked the beginning of a return to a more “normal” housing market. We should know more as we continue to track the latest data over the next few weeks.
“The housing market was going 100 miles per hour and now it’s down to 80,” said Redfin Chief Economist Daryl Fairweather. “This is not the bursting of a bubble. Rather, it’s a sign that consumers might rather spend their time and money on other things besides housing now that travel, dining and entertainment are resuming in full force.”
Unless otherwise noted, this data covers the four-week period ending May 30.
Note: At this time last year, pandemic stay-at-home orders halted homebuying and selling, which makes year-over-year comparisons unreliable for select housing metrics. As such, we have broken this report into two sections: metrics for which a year-over-year comparison remains most relevant, and metrics for which it makes more sense to compare to the same period in 2019.
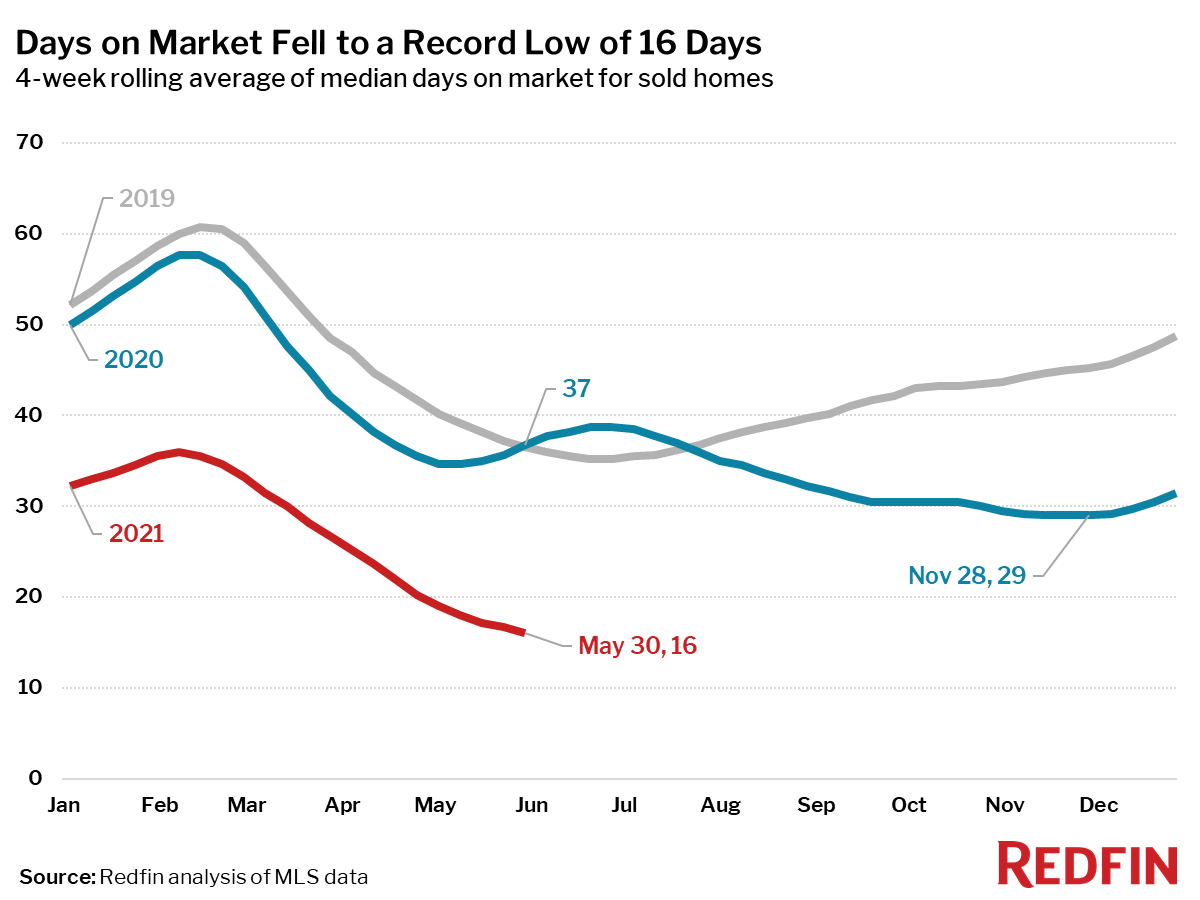
Each of the metrics highlighted in the following list set a new housing record going back at least as far as 2012, when Redfin’s data began.
“There are some signs that buyers may be pulling back,” said Seattle Redfin real estate agent Alysan Long. “Homes are staying on the market past the date the sellers had planned to review offers and other homes are being listed without an offer review date, neither of which was happening earlier this spring. We’re increasingly seeing homes only get one offer, and even homes that are still getting multiple offers are receiving fewer offers than they would have a few weeks ago.”
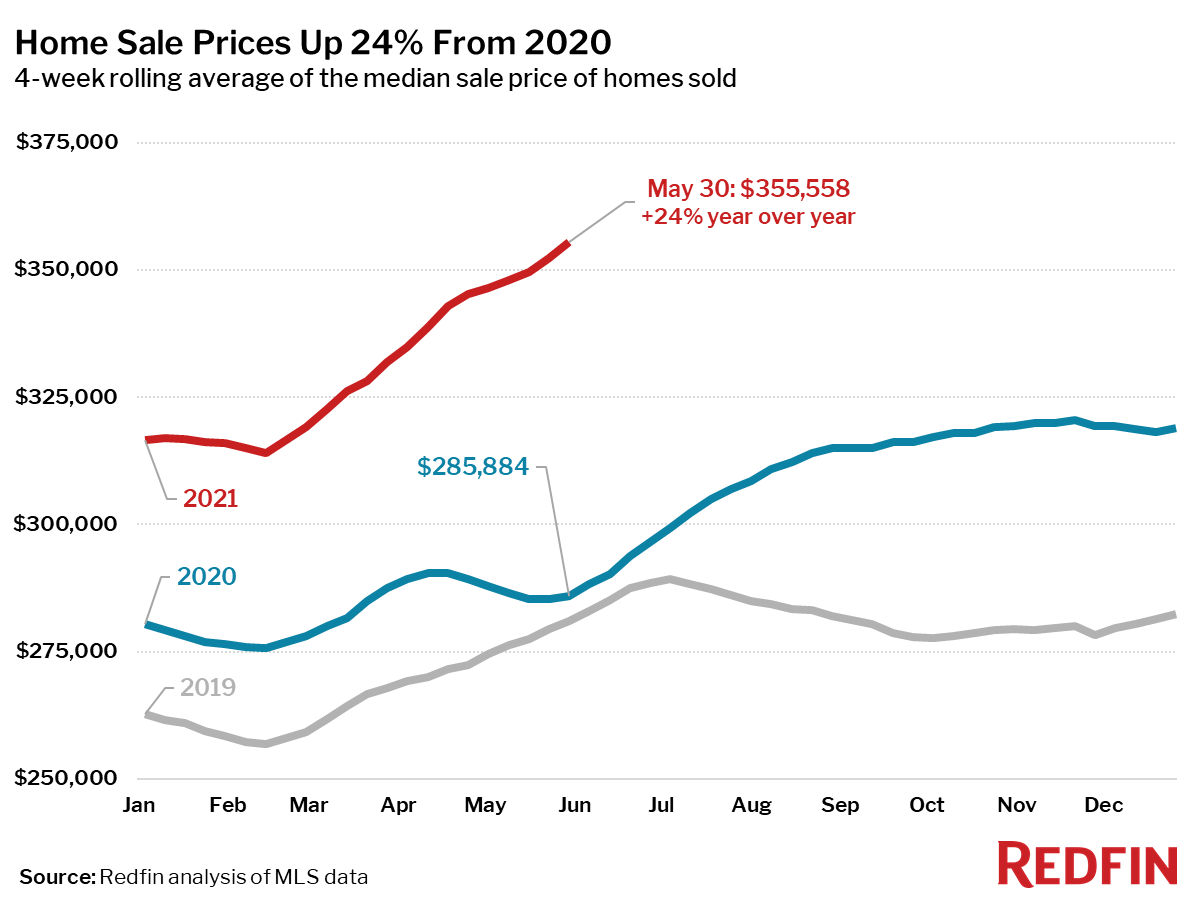
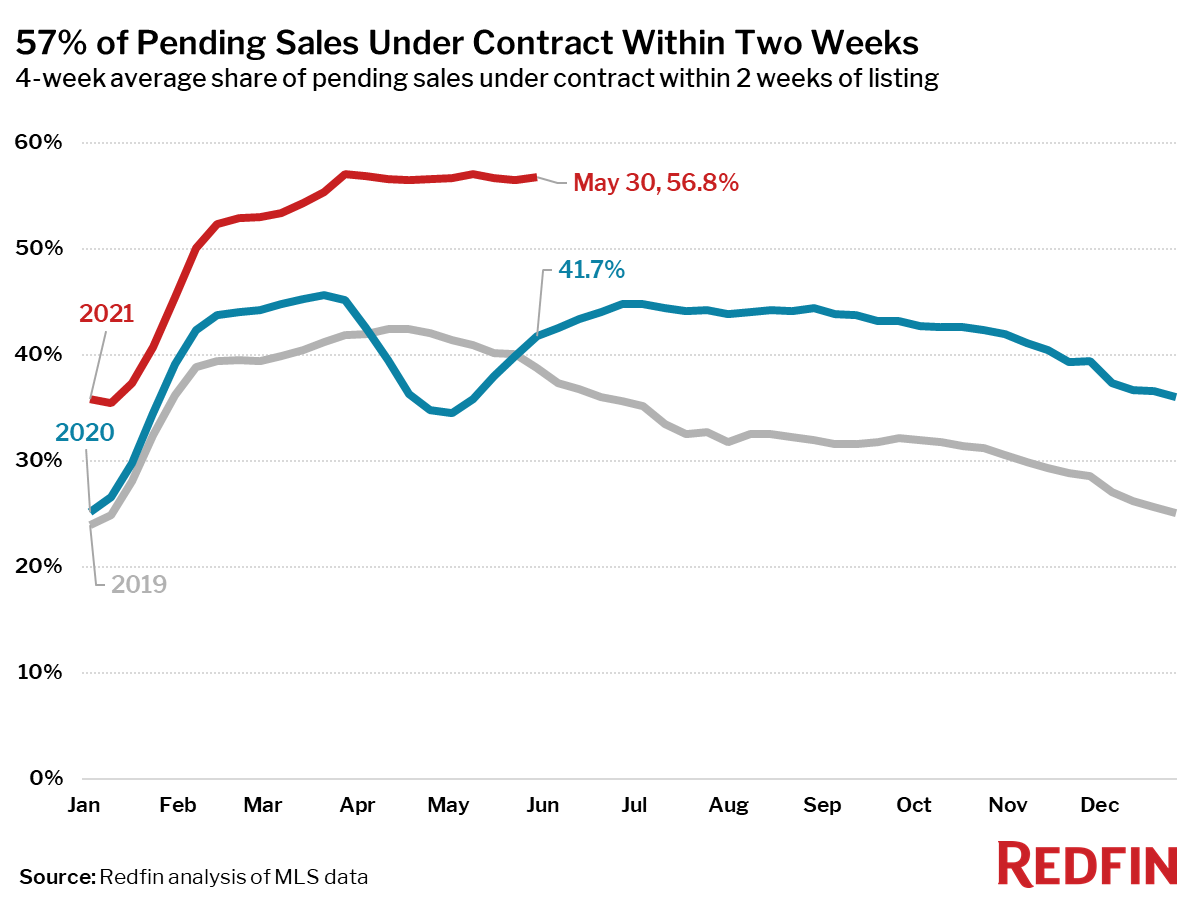
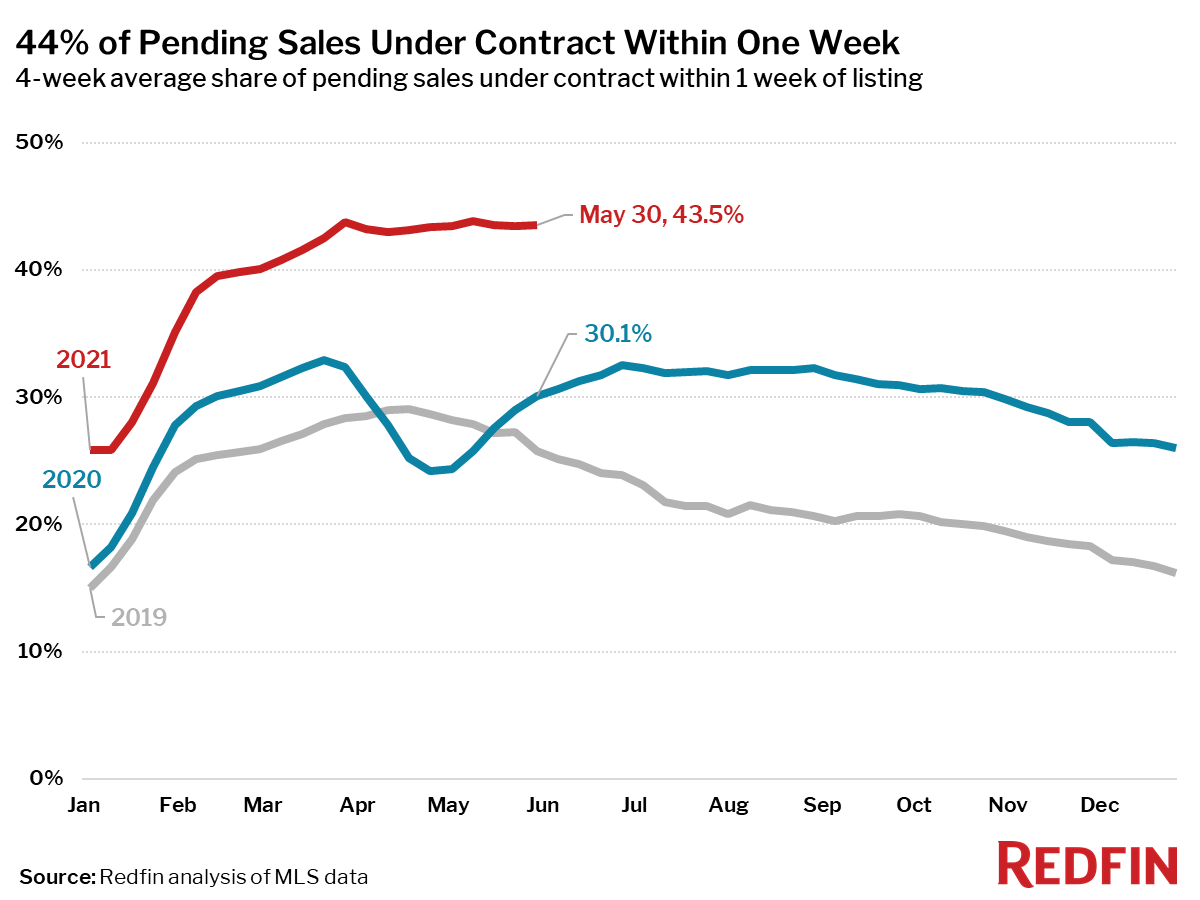
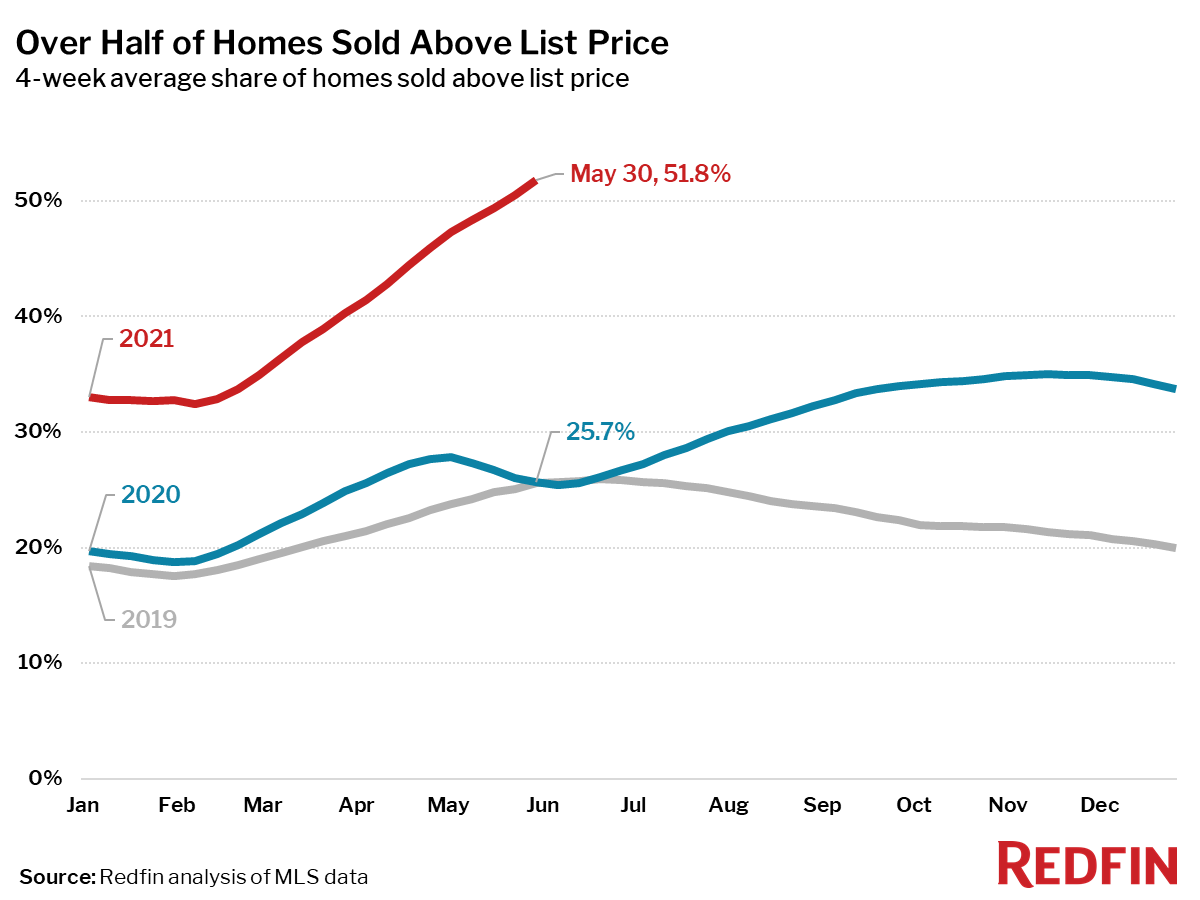
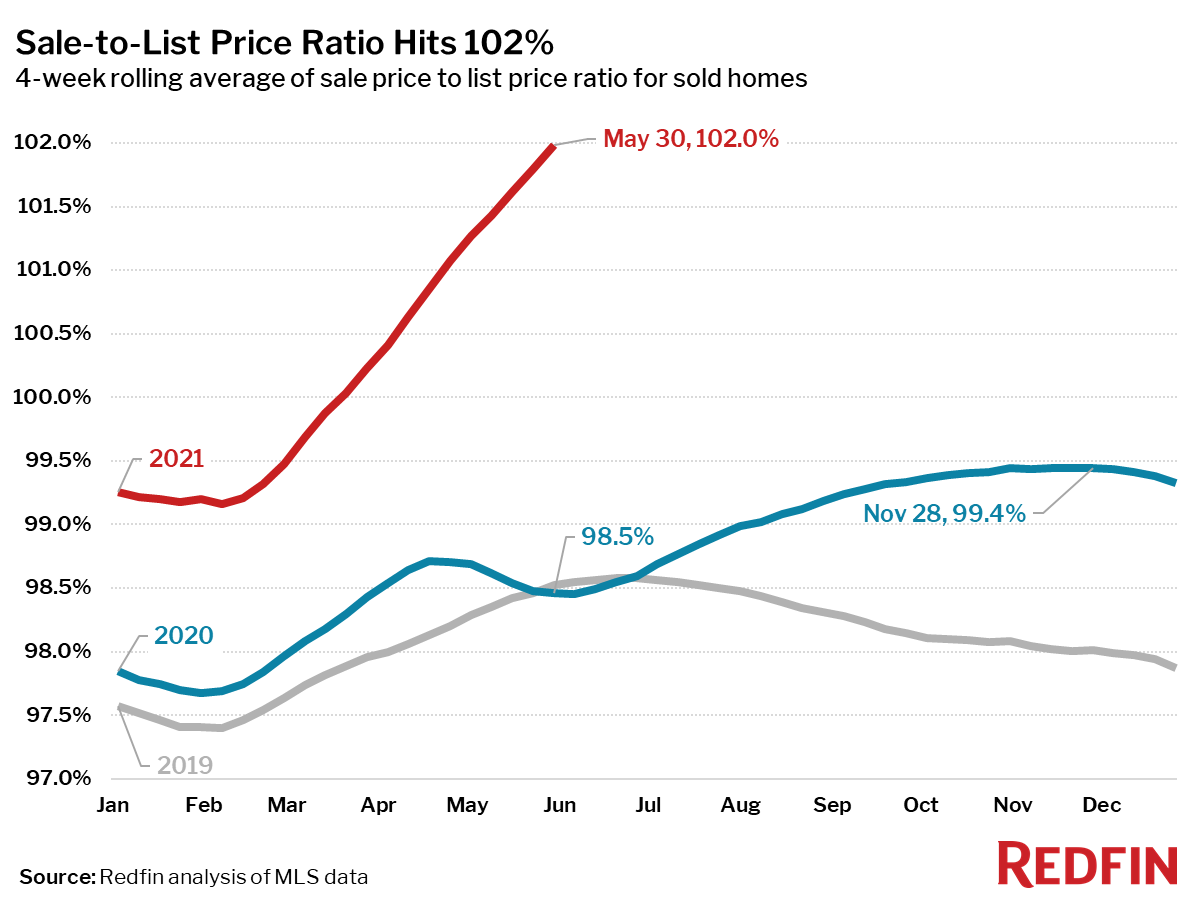
Still, measures of home sales that closed during the four weeks ending May 30 set new records for the housing market heat wave.
The share of homes sold in one or two weeks were both just shy of their record high and have been relatively flat since the four-week period ending March 28.
Refer to our metrics definition page for explanations of all the metrics used in this report.