The homes that are selling are going for about the same price as a year earlier, with nationwide prices up just 0.5% year over year–smaller than the 0.7% increase at the onset of the pandemic when the market reached a near standstill. Measures of early-stage homebuyer activity are mixed, with requests for tours and agent services on the rise, but few people applying for mortgages.
Pending U.S. home sales dropped 32% year over year to their lowest level since at least 2015 during the four weeks ending January 1. The biggest declines were in pandemic homebuying hotspots Las Vegas, Phoenix and Austin, which each saw pending sales plummet more than 50%. The housing market fizzled out at the end of 2022 due to 6%-plus mortgage rates, a looming recession, record-low new listings, extreme winter weather and the typical holiday slowdown.
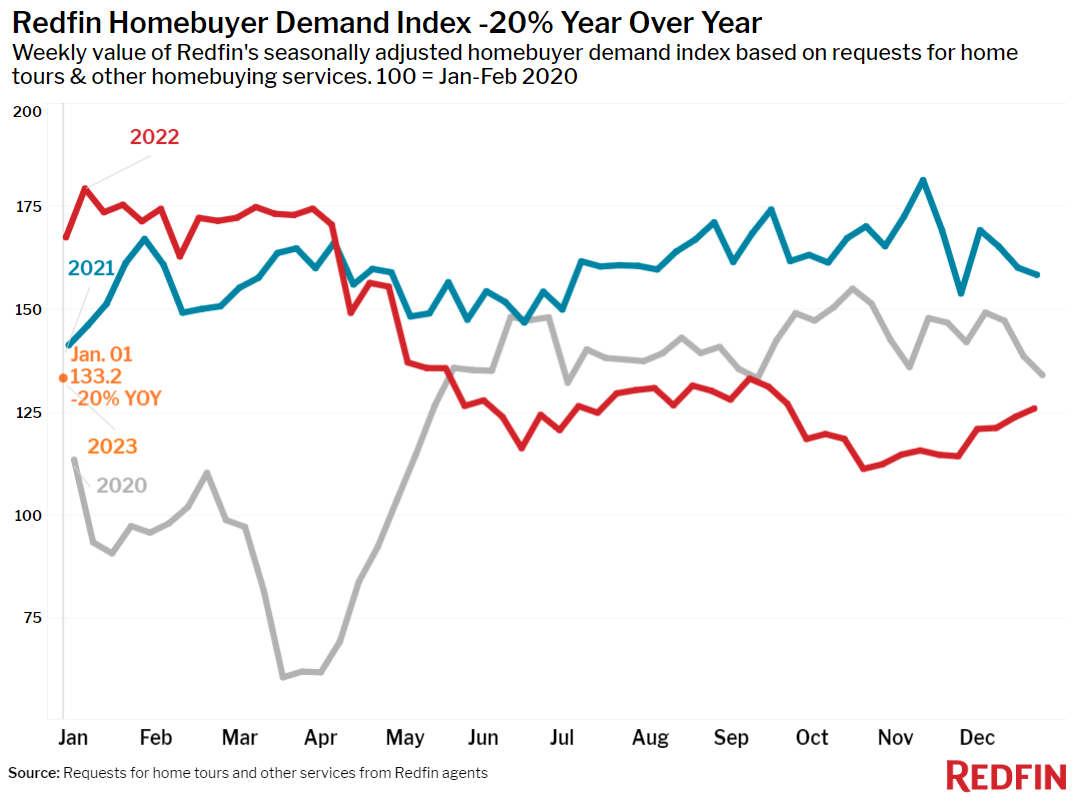
Signals of early-stage demand are mixed. Redfin’s seasonally adjusted Homebuyer Demand Index–a measure of tour requests and other buying services from Redfin agents–was up 8% from two weeks earlier. Mortgage-purchase applications fell about 12%, though the double-digit drop was partly due to severe late-December storms hitting nearly every part of the U.S.
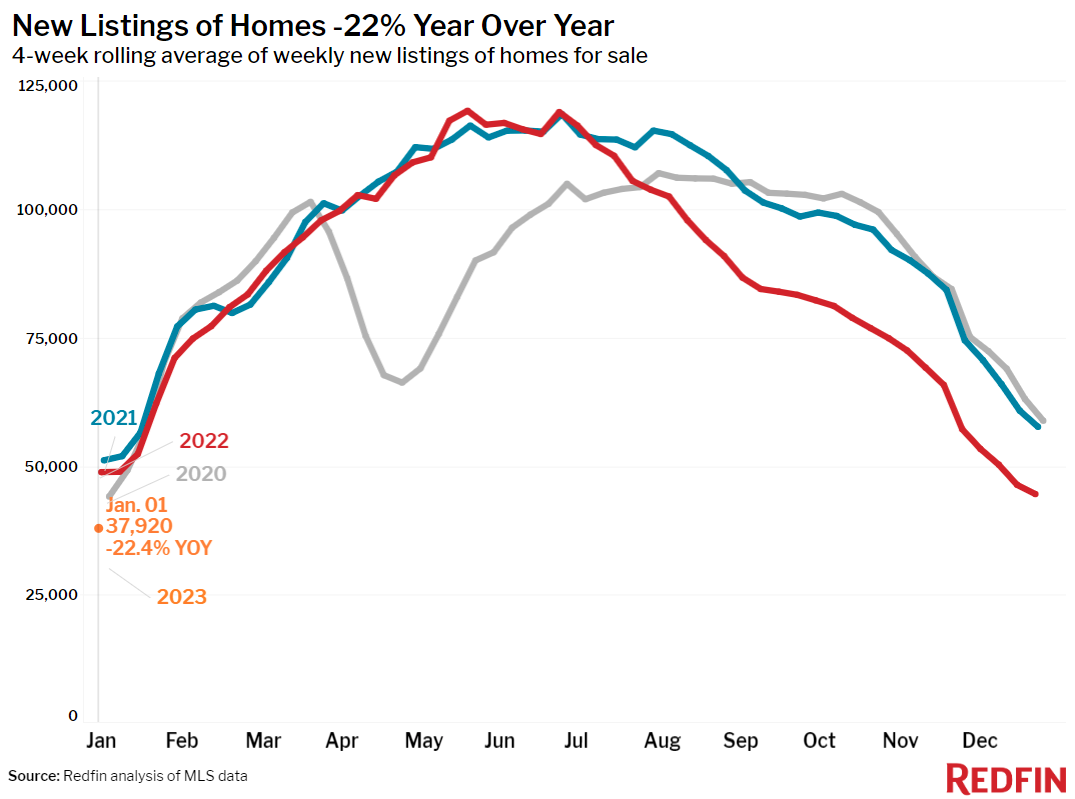
“Two categories of buyers are starting their search right now: First-timers hoping prices and competition are more manageable than they have been over the last few years, and returning buyers who took a break after losing out on multiple homes during the pandemic bidding-war frenzy,” said Seattle Redfin agent Shoshana Godwin. “They should be able to take their time and find a home for a slightly lower price than last year, but the market will likely become more competitive over the next few months. I expect new listings to remain scarce as homeowners hold onto low interest rates while the pool of determined buyers circle the few homes that are available.”
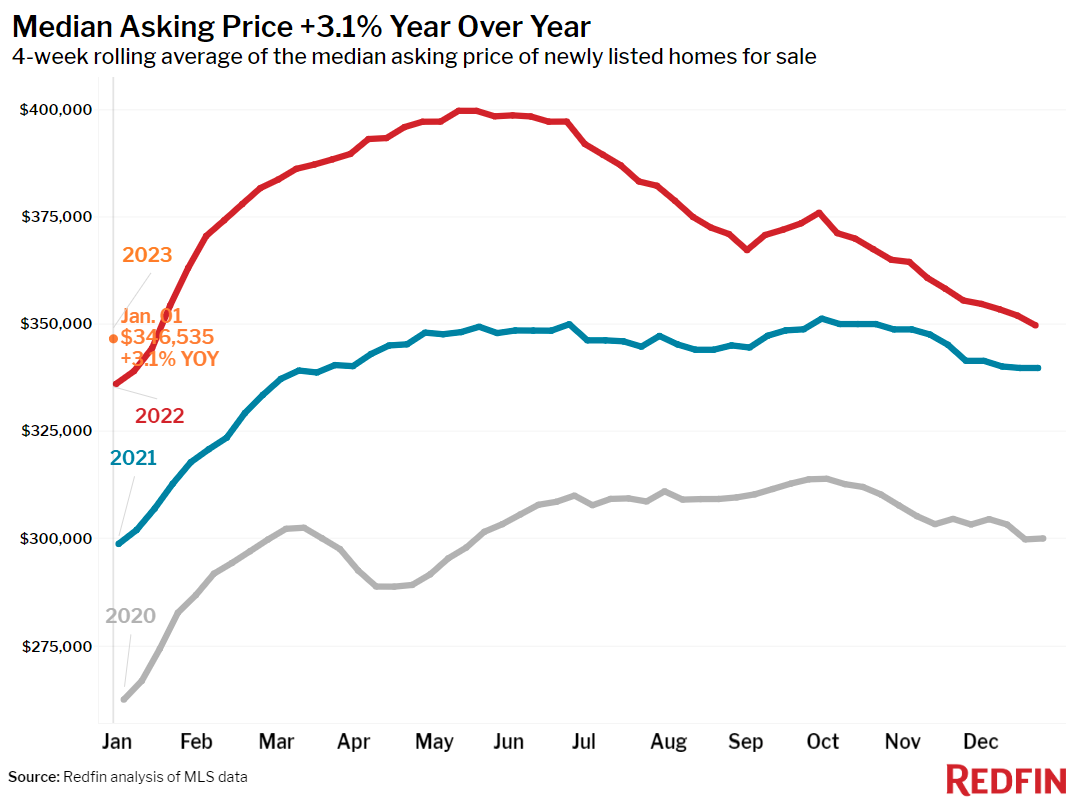
The typical U.S. home sold for $350,000 during the four weeks ending January 1. That’s up just 0.5% from a year earlier, slightly slower than the 0.7% growth we saw at the beginning of the pandemic, when the market nearly ground to a halt. Prices were down 10% from the June peak.
On a metro level, home-sale prices fell year over year in 19 of the 50 most populous U.S. metros during the four weeks ending January 1. By comparison, just 10 metros saw price declines a month earlier.
Prices fell 10.4% year over year in San Francisco, 6% in Sacramento, 5.6% in San Jose, CA, 5.4% in Los Angeles, 4.6% in Detroit, 4.4% in Oakland, CA, 4.2% in Seattle, 3.9% in Pittsburgh, 2.9% in Austin, 2.8% in New York, 2.4% in Phoenix and 2.2% in Boston. They fell 2% or less in Anaheim, CA, Chicago, Riverside, CA, Washington, D.C., San Diego, Portland, OR and Newark, NJ.
This marks the biggest year-over-year drop for San Francisco prices since at least 2015.
Unless otherwise noted, the data in this report covers the four-week period ending January 1. Redfin’s weekly housing market data goes back through 2015.
Refer to our metrics definition page for explanations of all the metrics used in this report.