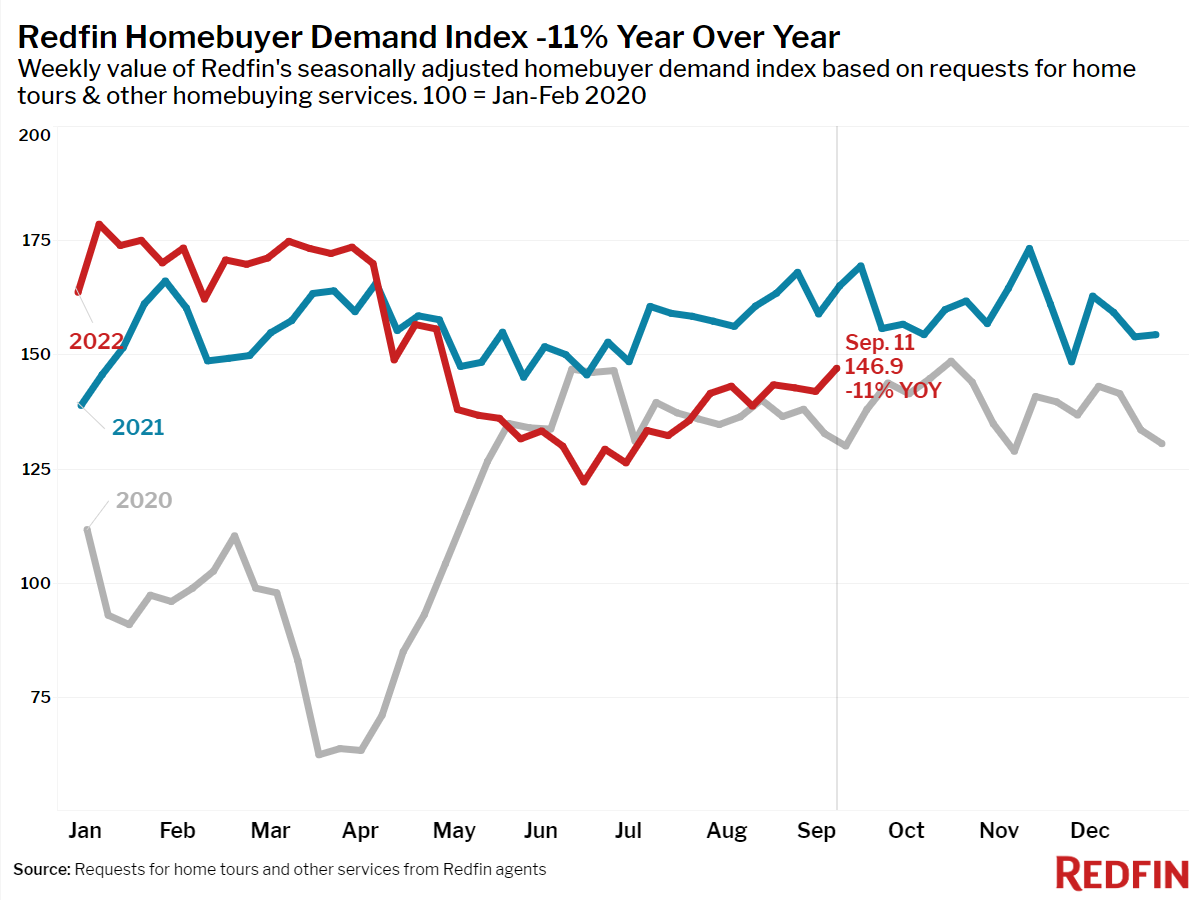
The housing market is becoming more balanced, but at a great cost to both buyers, who are footing the bill of high monthly mortgage payments, and sellers, whose stronghold on the market has slipped away as mortgage rates doubled this year.
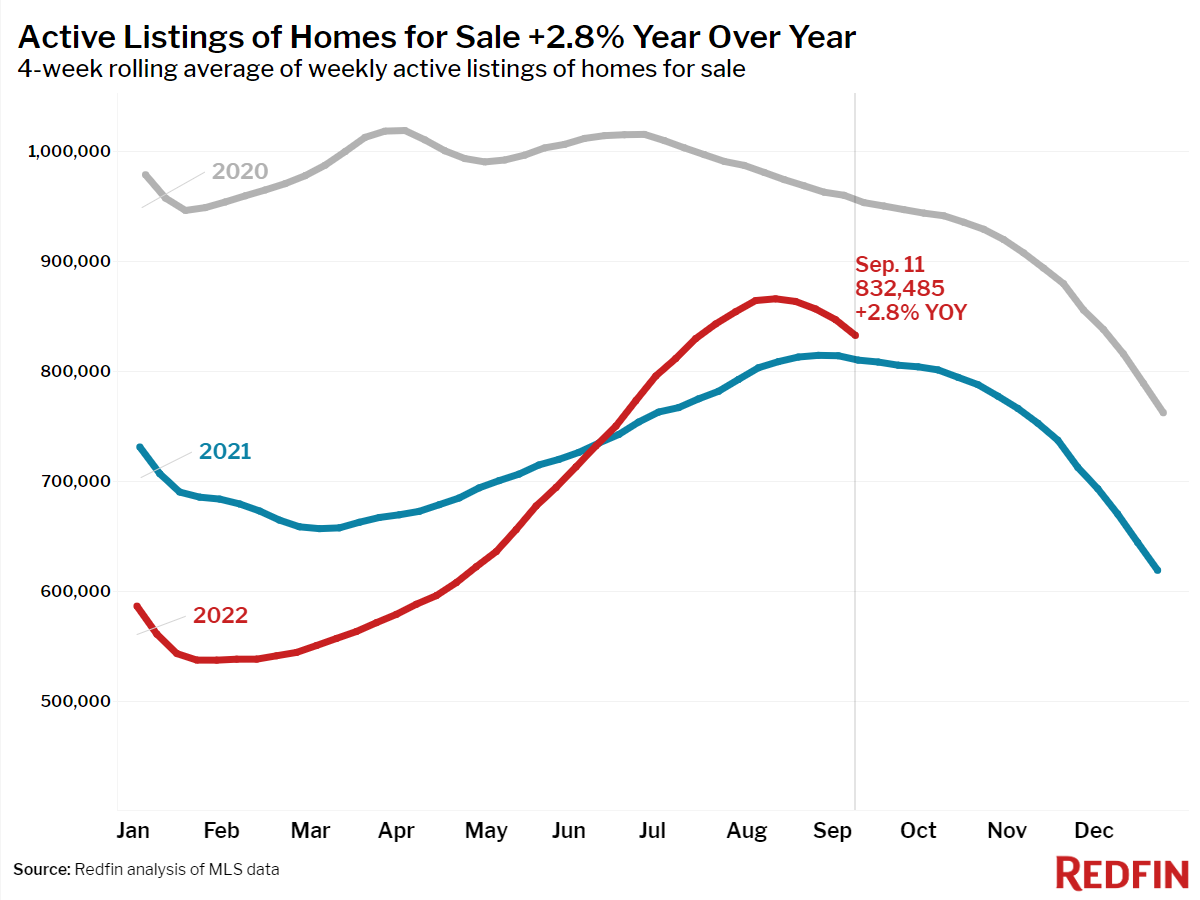
There were 2.9 months of home supply during the four weeks ending September 11, up from 1 month from a year ago and the highest level since June 2020.
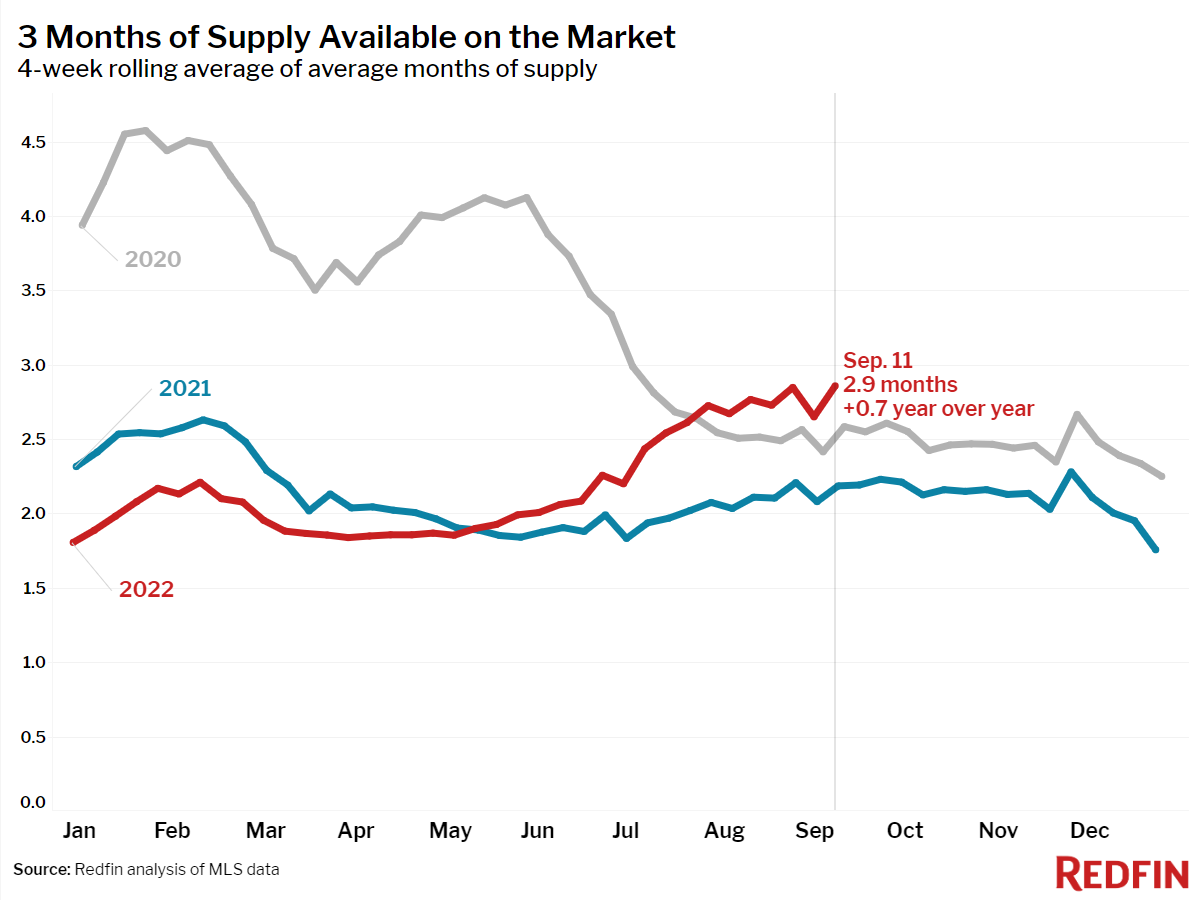
Months of supply (active listings divided by closed sales) measures how long it would take for the current home supply to be bought up at the current rate of consumption. As people buy fewer homes and listings linger on the market, months of supply climbs, and vice versa. Historically, less than four months of supply is considered a seller’s market, four to six is a relatively balanced market, and above six months of supply is a buyer’s market. At the height of the pandemic homebuying frenzy, we were down to 1.8 months of supply, and as recently as May, this measure was well within seller’s market territory at 2 months.
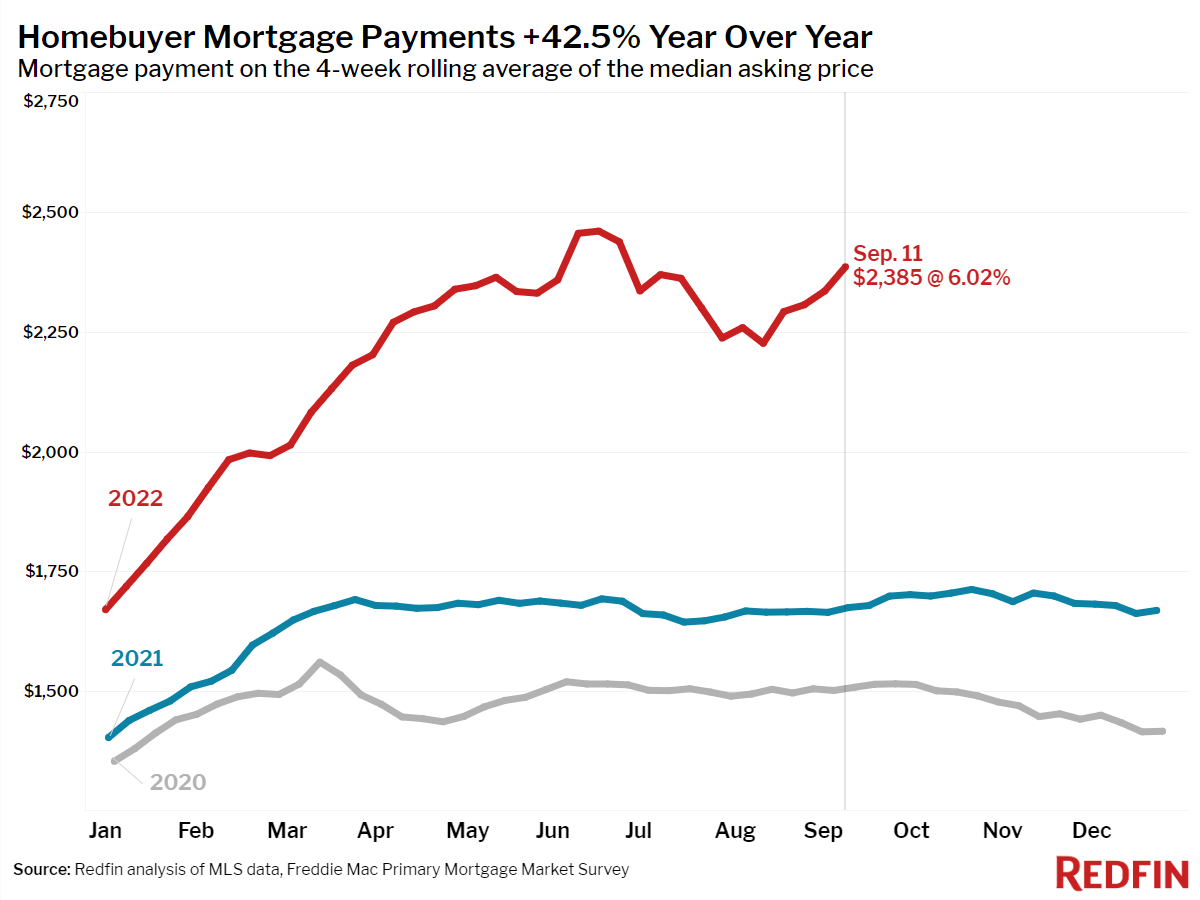
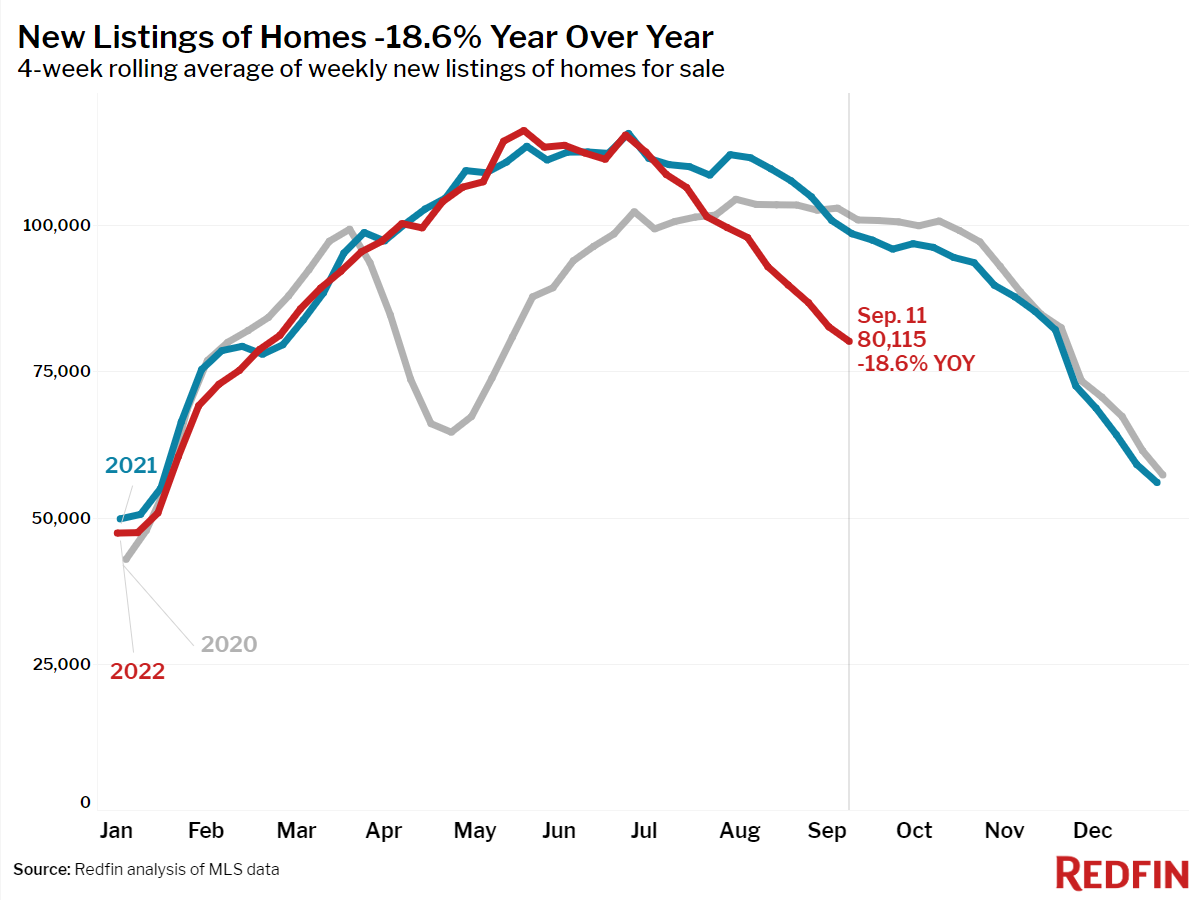
The rapid climb in months of supply shows how quickly sellers lost their grip on the market as mortgage rates shot up to 6%, making homes unaffordable to many buyers. Potential sellers are reluctant to list their homes in this environment, which is why inventory is falling. But it’s hard to say with conviction that buyers have a true upper hand, either.
“Homebuyers have more power than they’ve had since the ‘before times,’” said Redfin Deputy Chief Economist Taylor Marr. “Unfortunately, it’s increasingly hard for buyers to make use of their newfound power thanks to the affordability pressures of rising mortgage rates and a dearth of homes being listed for sale. A true buyers market would have more homes for sale than there are buyers, with a wide variety of homes for sale by style, price, and location so when a buyer finds the home that matches their preferences they face little competition and can offer under asking price with healthy inspection and financing contingencies in place. Today’s average buyer is paying less than the list price, but they continue to struggle to find a home that meets their criteria and budget.”
Unless otherwise noted, the data in this report covers the four-week period ending September 11. Redfin’s housing market data goes back through 2012.
Refer to our metrics definition page for explanations of all the metrics used in this report.