

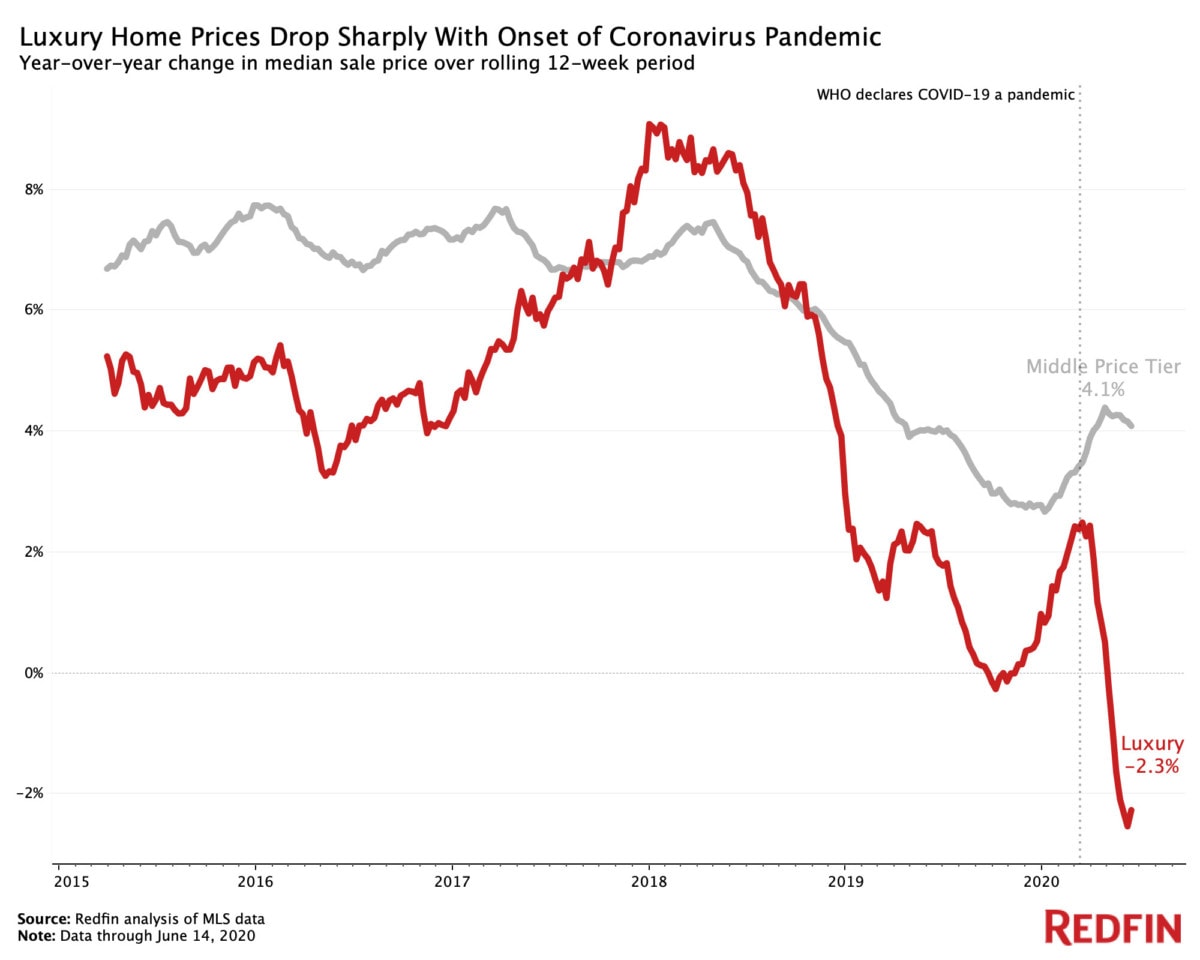
The median sale price for luxury homes nationwide dropped 2.3% year over year to $1,099,521 in the 12 weeks ending June 14, one of the biggest declines since at least the beginning of 2015. But the latest data shows the luxury market may be starting to rebound, with the median sale price for homes in the top 5% rising 3.5% year over year for the 7-day period ending June 14 (the shorter timeframe has a smaller sample size and is less indicative of long-term trends, but provides a snapshot of recent numbers).
This is according to an analysis that divided all U.S. residential properties into five tiers based on Redfin Estimates of the homes’ market values as of mid-June. This report defines “luxury” as all the homes estimated to be in the top 5% based on market value. To represent non-luxury homes, we use the “middle” price tier, i.e. homes estimated to be in the 36th to 65th percentile for value. Redfin typically reports luxury data on a quarterly basis; we are releasing this analysis early because we noticed a reversal in luxury home-sale price growth correlated with the onset of the pandemic.
Luxury price growth reversed course with the impact of the coronavirus pandemic: Price growth for homes in the top 5% had been on the upswing from October 2019 until March. The median luxury price started declining in the 12 weeks ending March 29 and saw its biggest dip (-2.5% YoY) in the 12 weeks ending June 7.
The top 5% of the market took a bigger hit from the pandemic than the rest of the housing market. The median sale price for non-luxury, mid-priced homes rose 4.1% year over year to $265,134 in the 12 weeks ending on June 14. Price growth for non-luxury homes started to reverse in mid-April after an upswing that started at the beginning of the year.
We divided all U.S. residential properties into five buckets. There are three equal-sized tiers based on Redfin Estimates of the homes’ market values as of mid-June, with separate buckets for the bottom 5% and top 5% of the market. The top 5% of the market by price is considered luxury for the purposes of this report. The “bottom” tier represents more affordable homes, or homes estimated to be in the 6th-35th percentile. The “middle” tier represents homes estimated to be in the 36th-65th percentile. The “top” tier represents more expensive homes, or homes estimated to be in the 66th-95th percentile. We report on the “bottom” or “affordable” tier and the “top” or “expensive” tier in this separate report. By using Redfin Estimates of homes’ market value, we are able to use the same group of homes to report on price, sales and inventory. In past luxury reports, Redfin has analyzed the top 5% of homes by sale price to report on luxury price trends, while analyzing homes above a certain price threshold (typically $1.5 million or $2 million) for sales and inventory data.
