

Sales of luxury homes in the U.S. rose 41.6% year over year in the first quarter of 2021, far outpacing sales growth in every other segment of the housing market. By comparison, sales of affordable homes increased 7% and sales of mid-priced homes climbed 5.9%.
This is according to an analysis that divided all U.S. residential properties into five price tiers—luxury, expensive, mid-priced, affordable and most affordable—based on Redfin Estimates of the homes’ market values. Scroll down to the methodology section at the bottom of this report to read more about how we determined which homes were placed in each bucket.
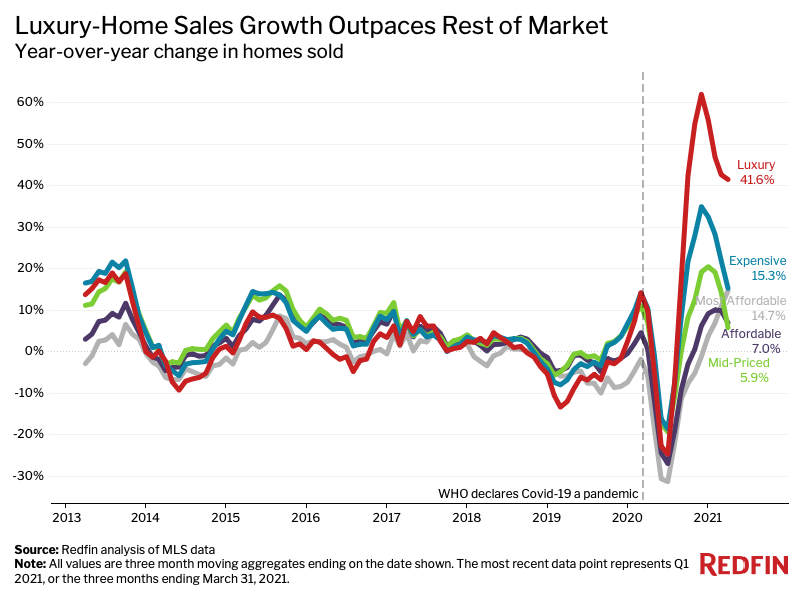
Sales growth has historically been similar across price tiers, but has diverged as the coronavirus pandemic has exacerbated economic inequality. Affluent Americans with the flexibility to work from anywhere are taking advantage of low mortgage rates and buying up high-end houses—particularly in popular vacation destinations—which is contributing to the surge in luxury-home sales. Meanwhile, many lower-income Americans have lost their jobs and lack the means to become homeowners.
The 49 most populous U.S. metropolitan areas all experienced growth in sales of luxury homes during the first quarter. The biggest gainer was Miami, where luxury-home sales skyrocketed 101.1% from a year earlier. It was followed by San Jose, CA (92.3%), Oakland, CA (82%), Sacramento, CA (79.3%) and Las Vegas (72.7%). Miami, Sacramento and Las Vegas have consistently made Redfin’s ranking of top migration destinations during the pandemic.
“Luxury properties, even those in the $3 million range, are getting multiple offers and going for well over the asking prices,” said Oakland, CA Redfin real estate agent Katy Polvorosa. “That’s something we haven’t seen before, even though the Bay Area has many affluent residents. Everyone just wants more space and big backyards, whether it’s because they’re stuck at home during the pandemic or because they have a growing family.”
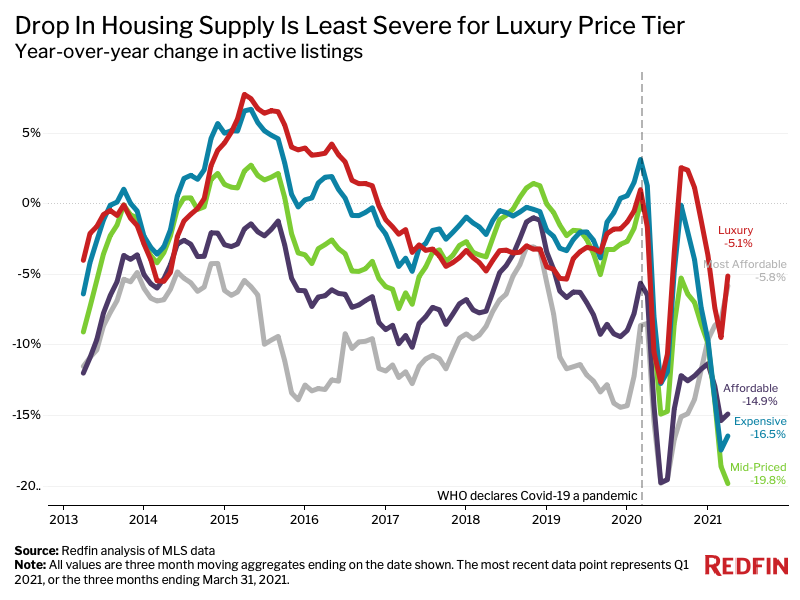
The U.S. housing market is experiencing a record deficit of homes for sale as demand soars due to low mortgage rates and remote work, but the shortage is less extreme in the luxury price tier, which is allowing high-end home sales to flourish. The number of luxury homes for sale fell 5.1% year over year in the first quarter, the smallest decline of all five price tiers. By comparison, the supply of affordable homes for sale slumped 14.9% and the supply of mid-priced homes plummeted 19.8%.
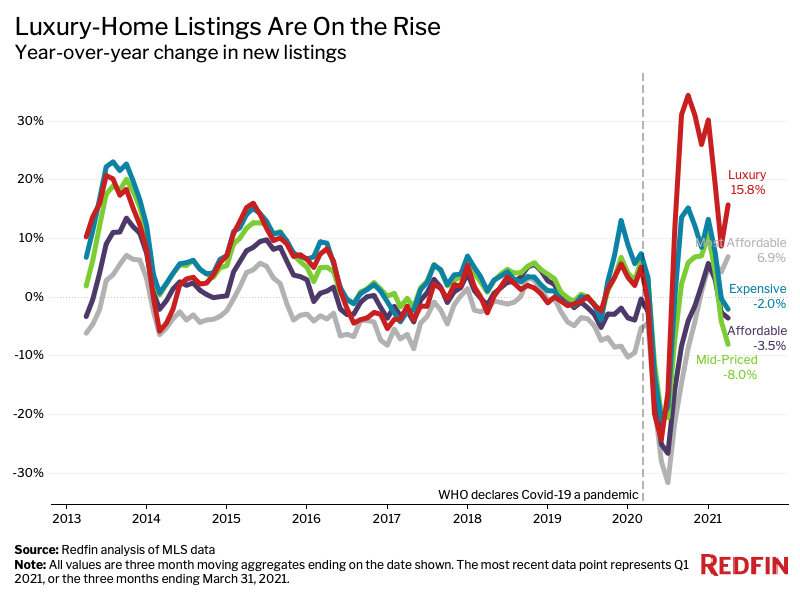
The supply shortage in the luxury market is less severe than the supply shortage in other price tiers partly because more high-end homeowners are putting their properties up for sale. New listings of luxury homes grew 15.8% year over year in the first quarter, while listings in most other price tiers declined.
“With a huge shortage of affordable homes for sale, many non-luxury homeowners are hesitant to put their properties on the market because they’re worried they’ll have trouble finding their next house,” said Redfin Chief Economist Daryl Fairweather. “This isn’t as big of an issue for luxury homeowners since there’s a relative abundance of high-end homes to choose from.”
Non-luxury homeowners have also taken advantage of mortgage forbearance during the pandemic, allowing them to hold onto their homes in the event of a default instead of putting them up for sale. This is another reason the housing shortage is more acute in the non-luxury market, Fairweather added.
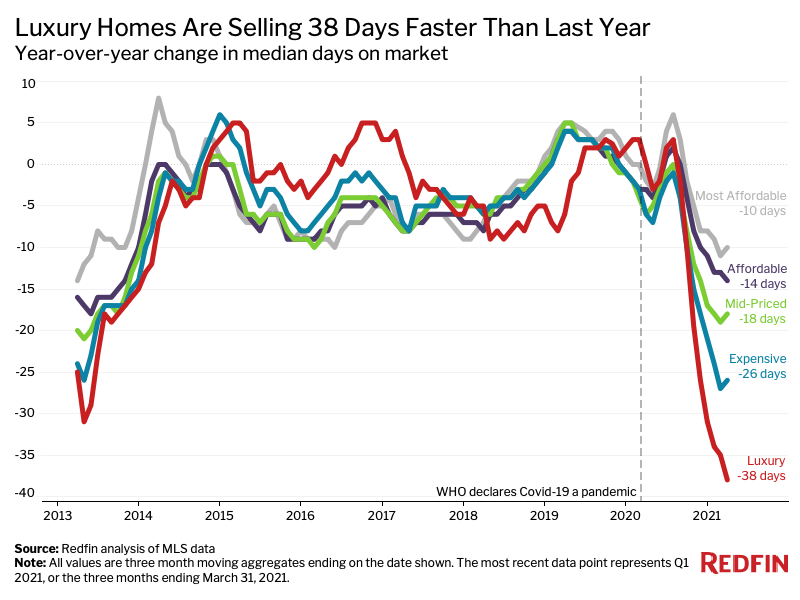
The typical luxury home that was for sale during the first quarter spent 61 days on the market—38 fewer days than the same period in 2020. That compares with 26 fewer days for expensive homes, 18 fewer days for mid-priced homes and 14 fewer days for affordable homes.
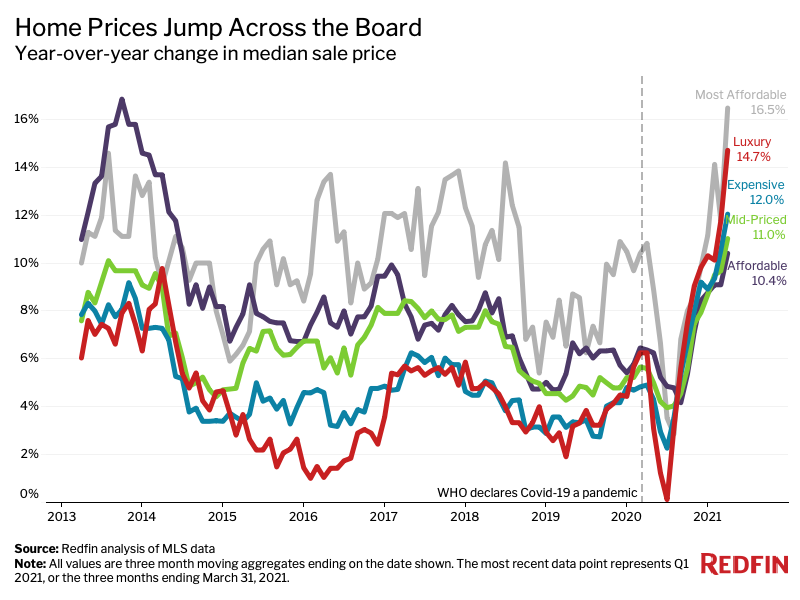
Home prices are growing in every segment of the market as low mortgage rates, a national housing shortage and a pandemic buying spree fuel fierce competition. Prices of the country’s most affordable homes rose 16.5% year over year in the first quarter. Luxury prices saw a similar gain, up 14.7%. The remaining three tiers had increases of closer to 10%.
We divided all U.S. residential properties into five buckets. There are three equal-sized tiers, as well as tiers for the bottom 5% and top 5% of the market, based on Redfin Estimates of the homes’ market values as of April 4, 2021. The top 5% of the market by price is considered “luxury” for the purposes of this report, while the bottom 5% is titled “most affordable.” The “affordable” tier is homes estimated to be in the 5th-35th percentile. The “mid-priced” tier represents homes estimated to be in the 35th-65th percentile. The “expensive” tier represents homes estimated to be in the 65th-95th percentile. By using Redfin Estimates of homes’ market value, we are able to use the same group of homes to report on price, sales and inventory.
