

More than a quarter (25.7%) of single-family homes for sale in America during the first quarter were new-construction homes. That’s up from 20.4% a year earlier and represents the highest share on record.
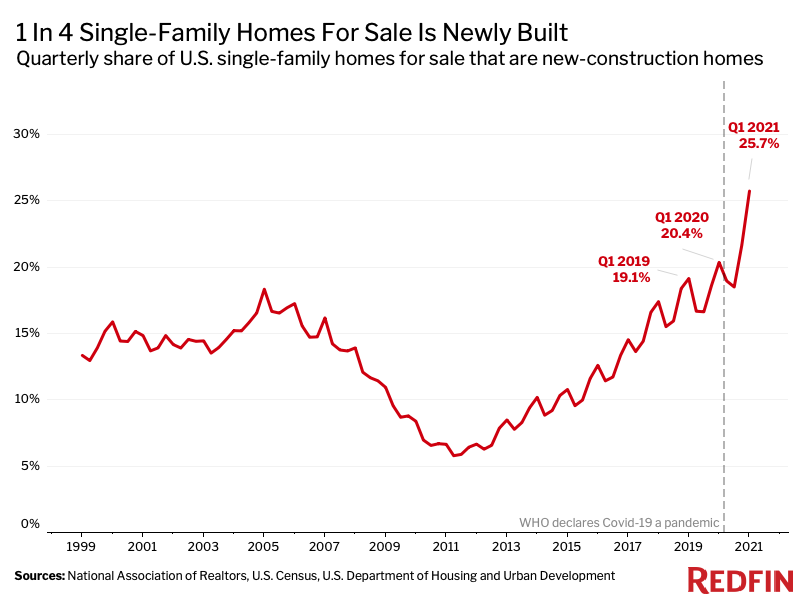
New-construction homes have steadily been taking up a larger piece of the pie over the last decade, but there has been a notable acceleration during the coronavirus pandemic. There are two primary reasons, according to Redfin Lead Economist Taylor Marr: an increase in homebuilding and a decrease in the number of Americans putting their houses up for sale.
“Building homes has become more attractive and profitable during the pandemic due to record-low mortgage rates and red-hot homebuyer demand,” Marr said. “At the same time, many homeowners have opted to stay put and refinance or remodel their existing homes instead of selling them, allowing new-construction homes to take up a larger portion of the market.”
U.S. housing starts—the number of new residential construction projects—jumped nearly 20% month over month in March to the highest level since 2006, a sign that homebuilders are growing more bullish despite lumber shortages and elevated construction costs. Meanwhile, listings of existing homes fell.
A lot of pandemic homebuyers have also turned to the new-construction market because bidding wars are fierce and new homes have historically attracted less competition. But the U.S. housing shortage has grown so severe that some newly built homes now have waitlists that are 90 buyers deep, said Redfin’s Salt Lake City Market Manager, Ryan Aycock. Some builders are even canceling contracts with buyers who refuse to accept price increases.
“New construction has typically been a good option for buyers who don’t want to deal with bidding wars because builders don’t usually set deadlines for offers. Buyers also like that they can often buy a new home for what it’s actually listed for rather than having to offer way over the asking price to win,” said Melanie Miller, a Redfin real estate agent in Houston. “However, inventory for new construction is very low and prices are now rising for many new and pre-construction homes because lumber prices have gone up. I had one buyer who came to terms with a builder at a certain price. The builder called us the next day and said they can’t do that price anymore because their suppliers just increased prices.”
Lumber prices climbed to a record high this week amid intense lumber shortages as mills and timber companies fought to meet demand fueled by the coronavirus pandemic.
In El Paso, TX, 53.2% of single-family homes for sale in the first quarter were newly built—the largest share of the 82 U.S. metropolitan areas in this analysis. Metros must have had populations of at least 750,000 and at least 50 sales of newly built single-family homes in the first quarter to be included in this analysis. The other metros in the top 10 were Boise, ID (46.7%), Houston (35.5%), Raleigh, NC (34.5%), Baton Rouge, LA (34.1%), Albany, NY (33.7%), Nashville, TN (31.9%), Charlotte, NC (31.6%), Oklahoma City, OK (30.8%) and Knoxville, TN (29.6%).
“Charlotte is sprawling. There’s a lot of vacant land on which to build, along with many older homes that are being bought up and razed by developers to make room for new housing. You can definitely build more here than in some other parts of the country,” said local Redfin real estate agent Steve Cramer. “Still, builders are having trouble keeping pace with demand. Interest in new-construction homes has surged because there aren’t enough existing homes for sale. Plus, builders are grappling with coronavirus-related supply-chain issues, which has made it even harder for them to keep up.”
Charlotte has also been a popular landing spot for out-of-towners during the pandemic. This has intensified the area’s housing shortage, in turn driving many buyers to new-construction homes, Cramer said. Charlotte saw one of the country’s biggest net inflows in 2020, meaning more people moved in than out. Boise and Nashville, which also ranked in the top 10 in this analysis, have seen similar influxes of new residents during the pandemic.
In Fresno, CA, just 2.4% of single-family homes for sale in the first quarter were newly built—the smallest share of the 82 metros in this analysis. It was followed by Oakland, CA (2.9%), Bakersfield, CA (3.2%), Riverside, CA (3.4%), Pittsburgh (3.8%), Anaheim, CA (4.2%), San Diego (4.4%), Las Vegas (4.5%), Camden, NJ (4.7%) and Newark, NJ (5%).
California metros fill the bottom of the list in part because they tend to have less vacant land available and less space zoned for housing development, Marr said. When broken down by region, the West had the lowest share of newly built homes as a portion of total single-family homes for sale, at just 8.4%. It was followed by the Northeast (11.4%), the Midwest (15.4%) and the South (25.8%).
It’s important to note that certain major metros are excluded from this analysis because our methodology filters out metros where there were fewer than 50 sales of newly built single-family homes in the first quarter. San Francisco and Philadelphia are among the metros excluded for this reason.
So far in this report, we’ve discussed what has already happened in the new-construction market. Data on building permits is a helpful tool to determine what is likely to occur in the future. Single-family building permits, or government-granted authorizations that allow builders to begin construction of single-family homes, jumped 25.7% year over year during the first quarter.
In Elgin, IL, single-family permits climbed 68.3%—the biggest jump of the metros in our analysis for which U.S. Census permit data was available. It was followed by Tacoma, WA (58.9%), Bridgeport, CT (57.9%), Minneapolis (57.5%) and Albany, NY (57%).
Just five of the metros in Redfin’s analysis saw a decline in single-family permits. The largest drop was in Newark, NJ, where permits fell 22% from a year earlier in the first quarter. Next came Allentown, PA (-19.6%), Virginia Beach, VA (-10.5%), San Diego (-9.2%) and Camden, NJ (-5.6%).
It’s worth noting that single-family permits also surged a respective 95.4% and 91.3% in Philadelphia and San Francisco, which are excluded from this analysis because they had fewer than 50 sales of newly built single-family homes in the first quarter.
Metros must have had populations of at least 750,000 and at least 50 sales of newly built single-family homes during the first quarter of 2021 to be included in the table below.
To determine the share of all single-family homes for sale that were new-construction homes, we used data from both the MLS and county records to determine the total supply of homes for sale and the portion that are identified as new-construction properties. To be included in the metro breakdown, metros must have had populations of at least 750,000 and at least 50 new home-sale records during the first quarter of 2021. Building permit data came from the U.S. Census Bureau’s Building Permits Survey.
