March 11, 2021 marks one year since the World Health Organization declared Covid-19 a pandemic. The coronavirus has upended just about every aspect of daily life, including where Americans live, what they look for in a home and how they go about the homebuying process. Here are 12 charts that illustrate the pandemic’s profound impact on the U.S. housing market. Spoiler alert: It’s an excellent time to be a seller and a tough time to be a buyer.
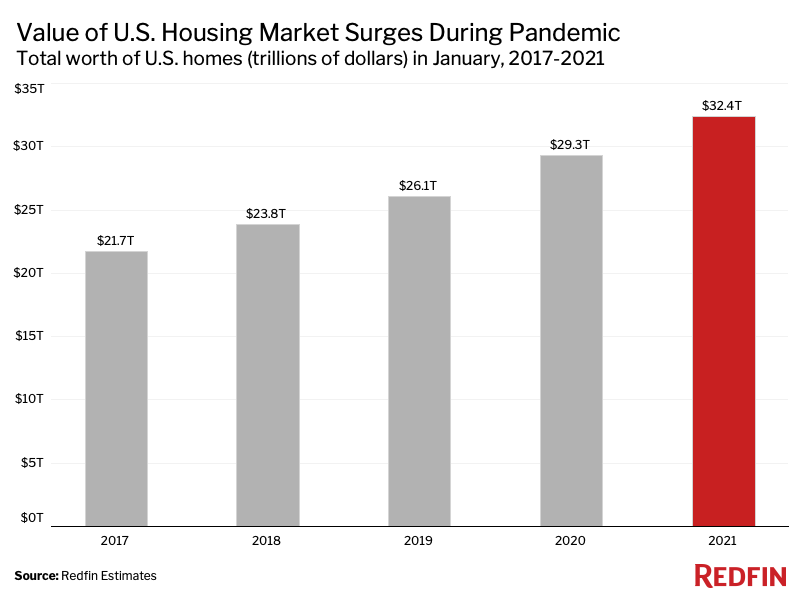
Despite the economy’s plunge into recession, U.S. homeowners have reaped $3.1 trillion in home value during the pandemic as a result of rising housing prices. The total worth of U.S. homes was $32.4 trillion in January, up 10% from $29.3 trillion a year earlier.
The median home sale price in the U.S. was $330,500 in January, up 14.3% from a year earlier. That’s the biggest annual gain during a given month since at least 2013.
![]()
“Surging prices are helping local homeowners build equity, but also creating barriers to entry for many first-time buyers here in Albuquerque,” said Austin Wolff, a Redfin real estate agent in New Mexico. “With so many affluent folks moving in from out of state, families who’ve been here for generations could get priced out. But beginner buyers shouldn’t give up. I’ve had clients win homes by using creative strategies that don’t require a huge down payment or the highest bid.”
There are significantly more buyers than there are sellers—an imbalance that has existed for years but has significantly intensified during the pandemic. The supply of homes for sale plummeted a record 23.6% year over year in January as scores of Americans relocated and purchased homes thanks to low mortgage rates and remote work. The inventory shortage has acted as a catalyst for many of the other housing-market shifts we’ve seen over the past year, including skyrocketing prices and fierce bidding wars.
![]()
“Inventory is so low that it has even been tough to get in to see homes at all,” said Danielle Parent, a Redfin real estate agent in Cleveland, OH. “It’s a very, very challenging market for buyers, so I’m telling my clients that they should always have second- and third-choice homes in mind and may want to consider making offers sight-unseen.”
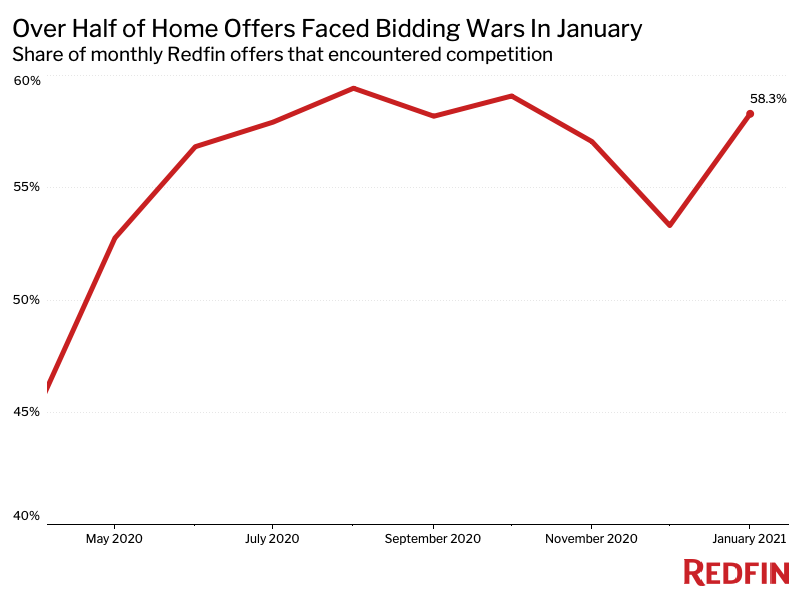
We’re currently in one of the most competitive housing markets in history. Nationwide, 58.3% of home offers written by Redfin agents faced bidding wars in January, up from 53.3% in December. That marks the ninth-straight month in which more than half of offers encountered competition. Please note that this data has revised slightly since we published our January bidding-wars report.
Another sign of intense competition is homes selling quickly and fetching more than the sellers originally ask for. The typical home that sold in January went under contract in 34 days—22 days fewer than a year earlier—and a third (32.9%) of homes sold for above their listing prices, compared with 18.9% a year earlier.
“One four-bedroom home in Ontario, CA just sold for $165,000 above its $445,000 listing price. A lot of my clients just don’t have enough money to go that high, or even $25,000 over asking,” said local Redfin agent Sheri Comeau. “Most of the folks I work with are first-time buyers who barely have enough to put 5% down. I’m seeing many clients pull from their retirement savings to supplement their down payments, which helps boost their buying power.”
“The norm in Bellevue, WA seems to be $200,000 or more over the asking price,” said local Redfin agent Emily Lam. “I saw one three-bedroom home go for $400,000 over the $899,950 listing price after receiving 57 offers.”
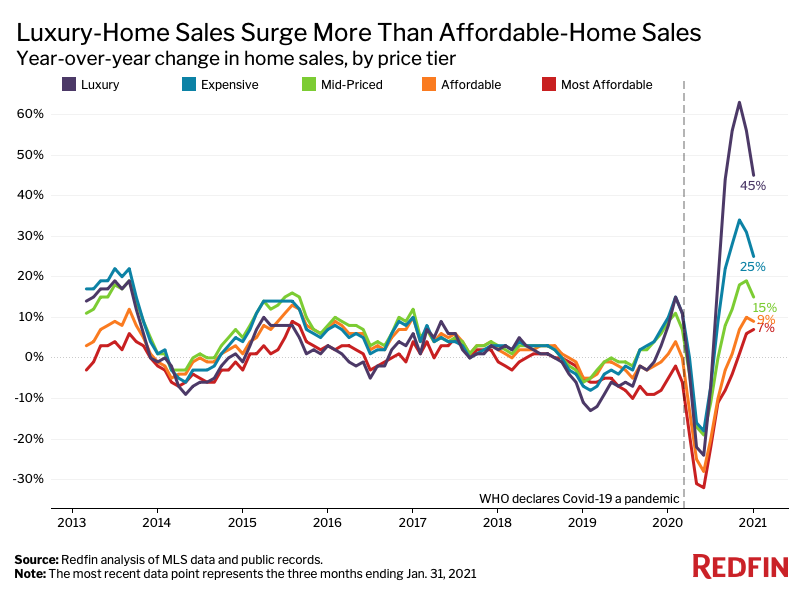
Sales of luxury homes surged 45% year over year during the three months ending Jan. 31—more than any other price tier—as affluent Americans bought vacation homes and worked remotely. By comparison, home sales in the affordable price tier grew just 9%. This is one example of the “K-shaped recovery”—an economic rebound that benefits the country’s wealthiest citizens while many lower-income Americans grapple with joblessness and debt.
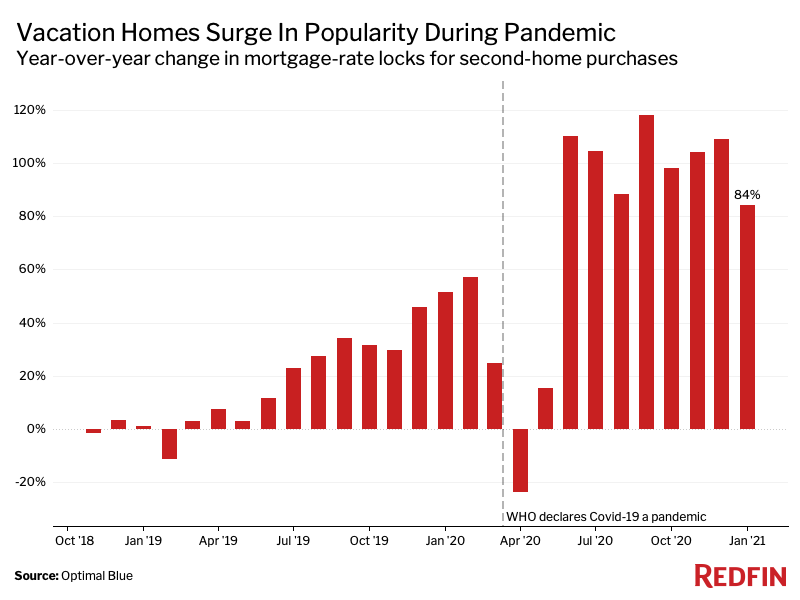
Similarly, demand for second homes jumped 84% year over year in January, outpacing the 36% increase in demand for primary homes. That’s according to a Redfin analysis of mortgage-rate lock data from real estate analytics firm Optimal Blue. A mortgage-rate lock is an agreement between a homebuyer and a lender that allows the homebuyer to lock in an interest rate on a mortgage for a certain period of time, offering protection against future interest-rate hikes. Homebuyers must specify whether they are applying to secure a mortgage rate for a primary home, a second home or an investment property.
About 5% of U.S. homeowners, or 2.7 million Americans, were in forbearance as of Feb. 16, down from a peak of 4.8 million (9%) in May, according to data provider Black Knight. Forbearance is when your mortgage servicer or lender allows you to temporarily pause or reduce your mortgage payments.
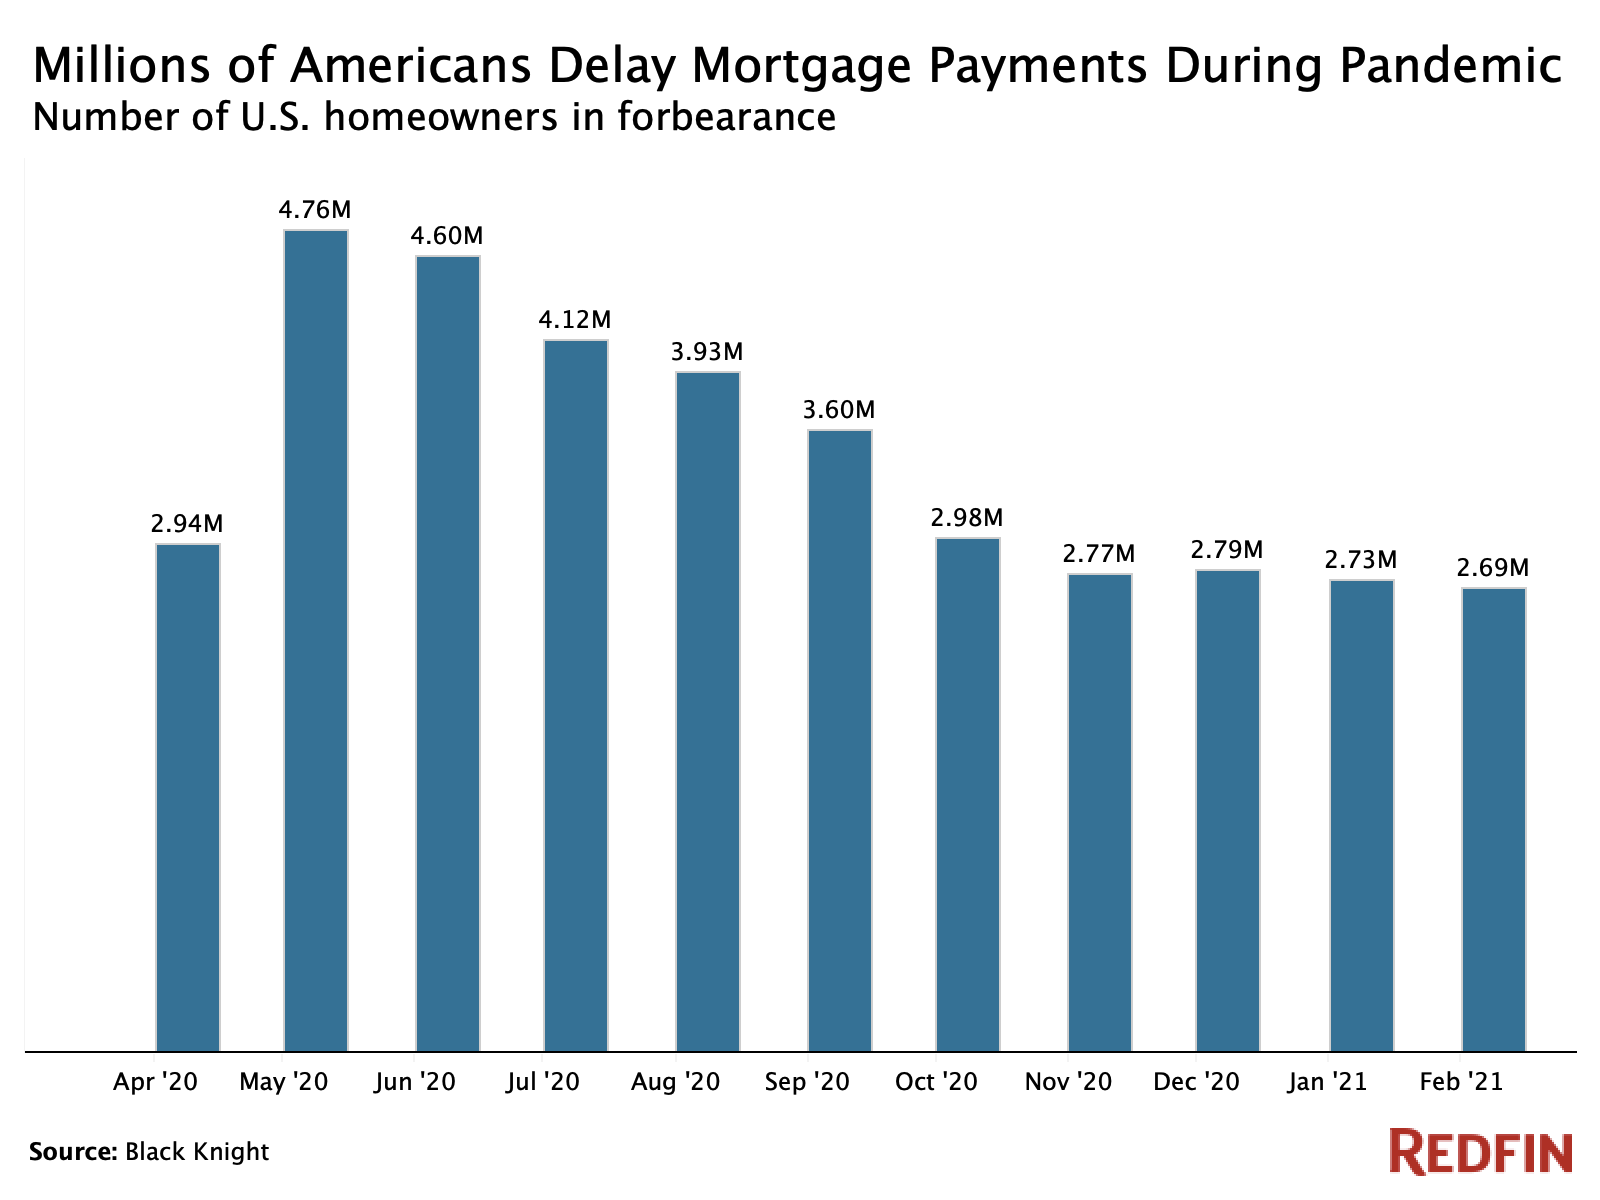
The U.S. government enacted the CARES Act in March, allowing Americans to enroll in forbearance programs if they’re struggling to pay the bills during the economic crisis brought on by the coronavirus pandemic. The Biden Administration announced in February that it was permitting Americans to delay mortgage payments for an extra six months—through June 2021—and also extending a ban on foreclosures.
Nationwide, 30.3% of Redfin.com users looked to move to a different metro area in the fourth quarter of 2020, up from 29.2% in the third quarter and 26.2% a year earlier.
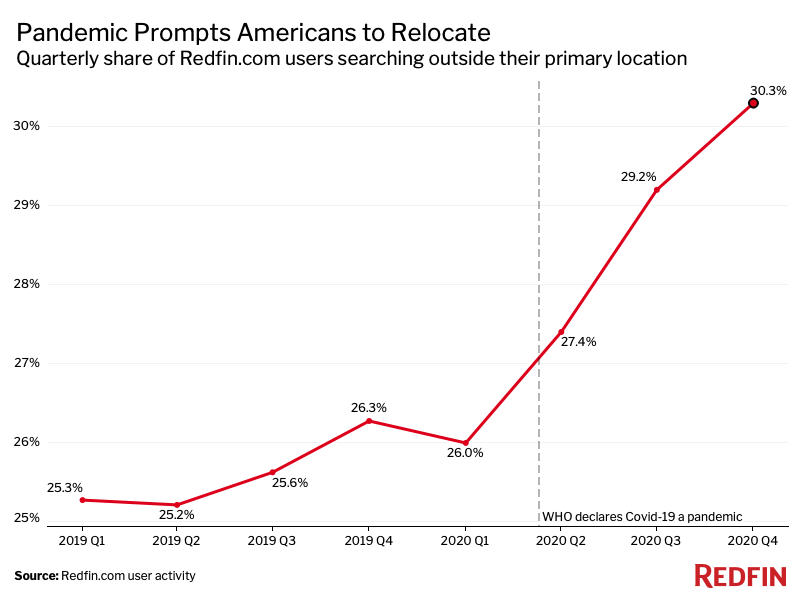
This figure ticked even higher—to a record 30.7%—in January, the most recent month for which data is available.
Relatively affordable and warm locales including Austin, TX, Phoenix, Las Vegas, Dallas, Atlanta, Sacramento, CA and Miami have seen among the largest net inflows, meaning more people are looking to move in than leave. These places have attracted people from dense, costly cities including San Francisco, Los Angeles and New York City.
Single-family homes are back in vogue as Americans spend lots of time inside during the pandemic. A third (32.9%) of saved searches created by Redfin.com users filtered solely for single-family homes in January, following a peak of 37.2% in July. Meanwhile, the share of searches specifically for other types of homes, such as condos, townhouses and multifamily listings, is much lower; just 7.5% of saved Redfin searches excluded single-family homes in January.
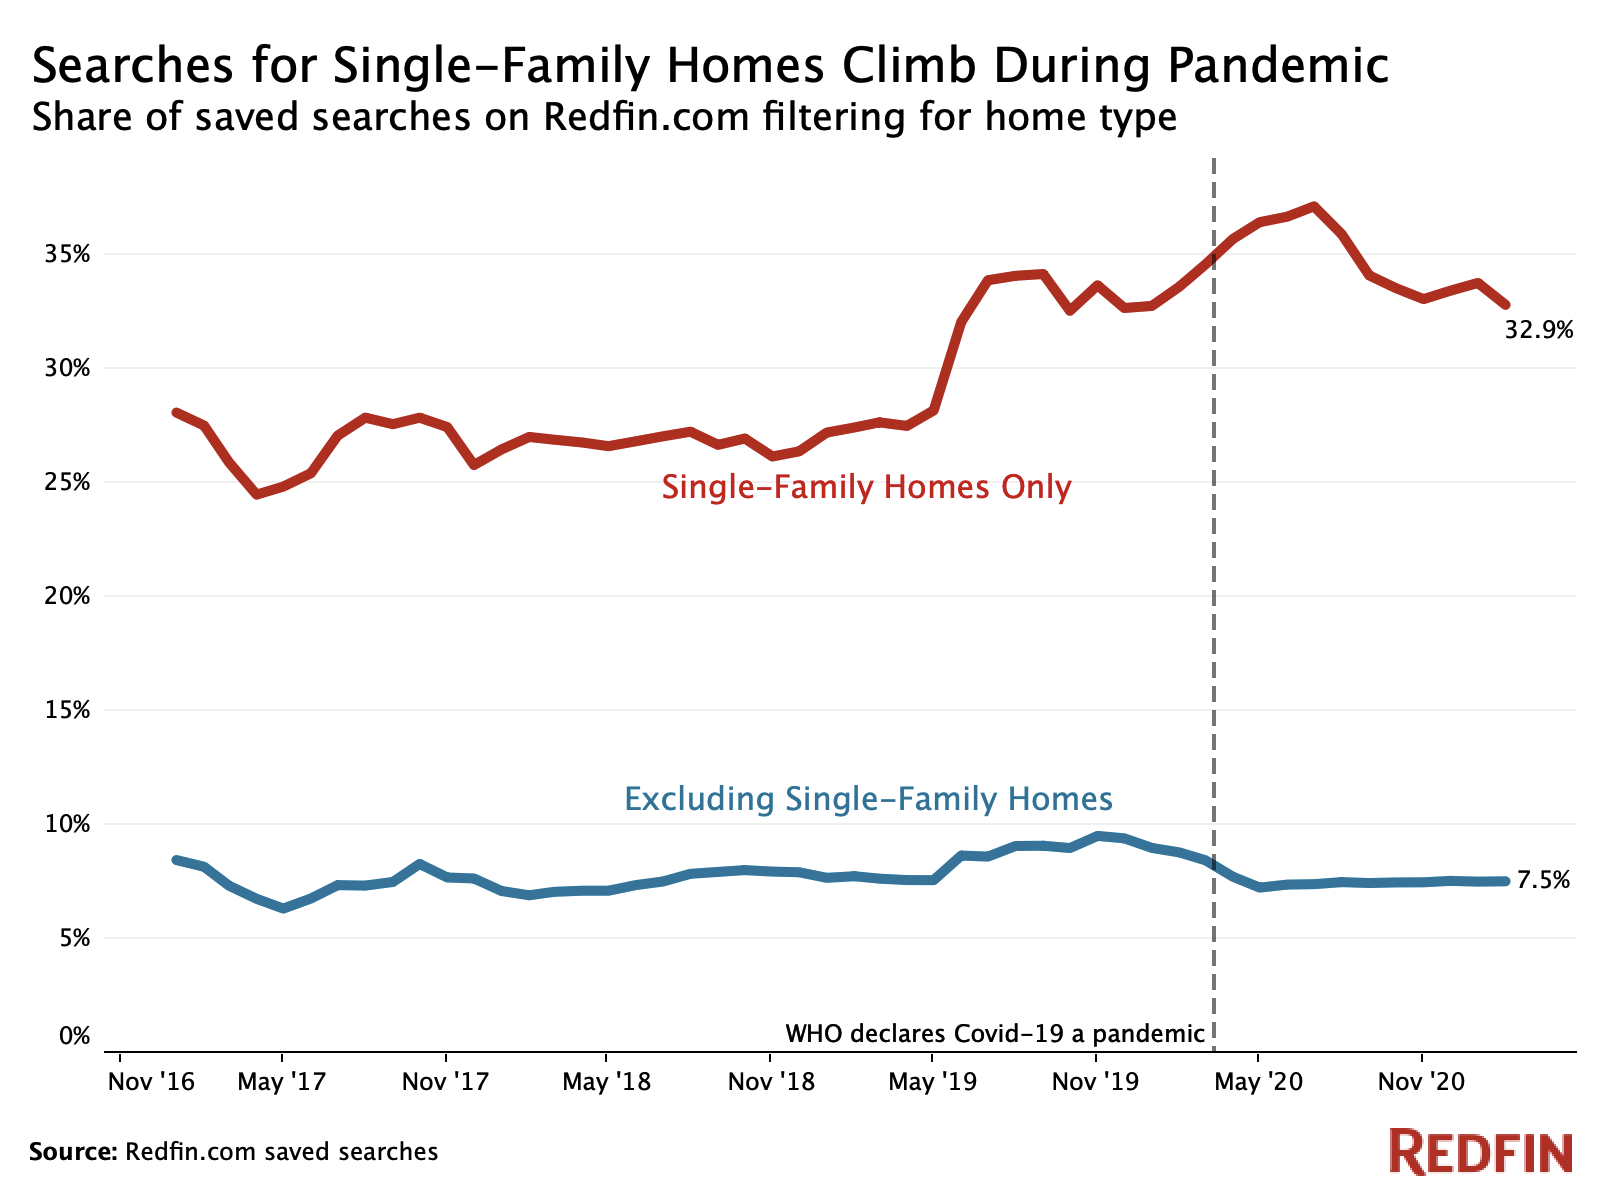
“The market for move-in ready single-family homes is on fire,” said Seattle Redfin real estate agent Alex Kochan. “Condos, new-construction townhouses, and properties in need of moderate fixing are less likely to encounter bidding wars.”
Condos were selling for a record 17% discount to single-family homes as of October. The condo market has remained relatively tepid throughout the pandemic because many homebuyers have traded shared amenities, small spaces and dense cities for extra room in the suburbs, small towns or rural areas.
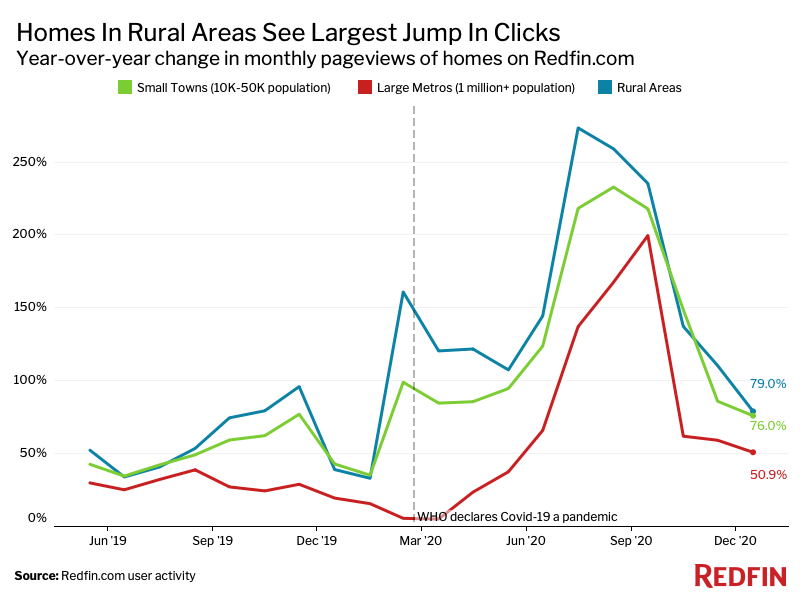
Redfin.com pageviews of homes in both small towns and rural areas jumped nearly 80% year over year in January (after climbing more than 200% in August), outpacing the 51% increase in pageviews of homes in large metropolitan areas. While that gap has narrowed since the summer, large metro areas continue to experience smaller annual increases in pageview growth than rural areas and small towns—a dynamic that existed before the pandemic, but on a smaller scale.
Almost two-thirds (63%) of people who bought a home in 2020 made an offer on a property they hadn’t seen in person, up from 32% a year earlier and the highest share since at least 2015, according to a Redfin-commissioned survey in November and December of more than 1,900 homebuyers across 32 major markets.

Some homebuyers may make offers sight-unseen because they feel it’s a safer option during the coronavirus pandemic, while others go this route because it allows them to submit quicker and oftentimes more competitive bids.
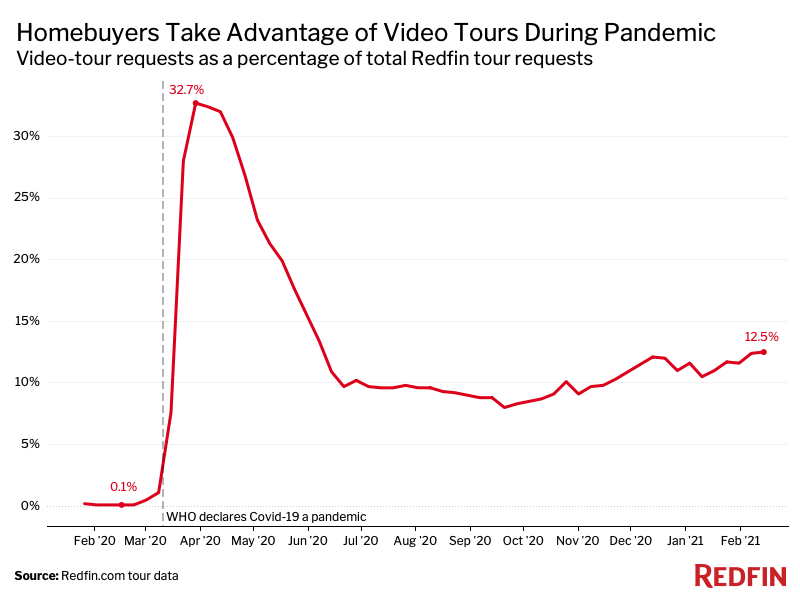
Purchasing a home sight-unseen has become more feasible during the pandemic thanks to high-quality 3D walkthroughs and virtual tours. Views of 3D walkthroughs on Redfin.com have soared 581% since the beginning of the pandemic. On average, 12% of home-tour requests made by Redfin customers so far in 2021 have been requests for agent-led video-chat tours, up from less than 1% in February 2020—before the coronavirus was declared a pandemic.
With Americans spending so much time at home, features including home offices and nice views have grown in popularity. A quarter (24.9%) of listings mentioned home offices in January, up from 22.9% a year earlier (+8.7% year over year), according to a Redfin analysis of multiple listing service (MLS) data. Here are some other January highlights:

