

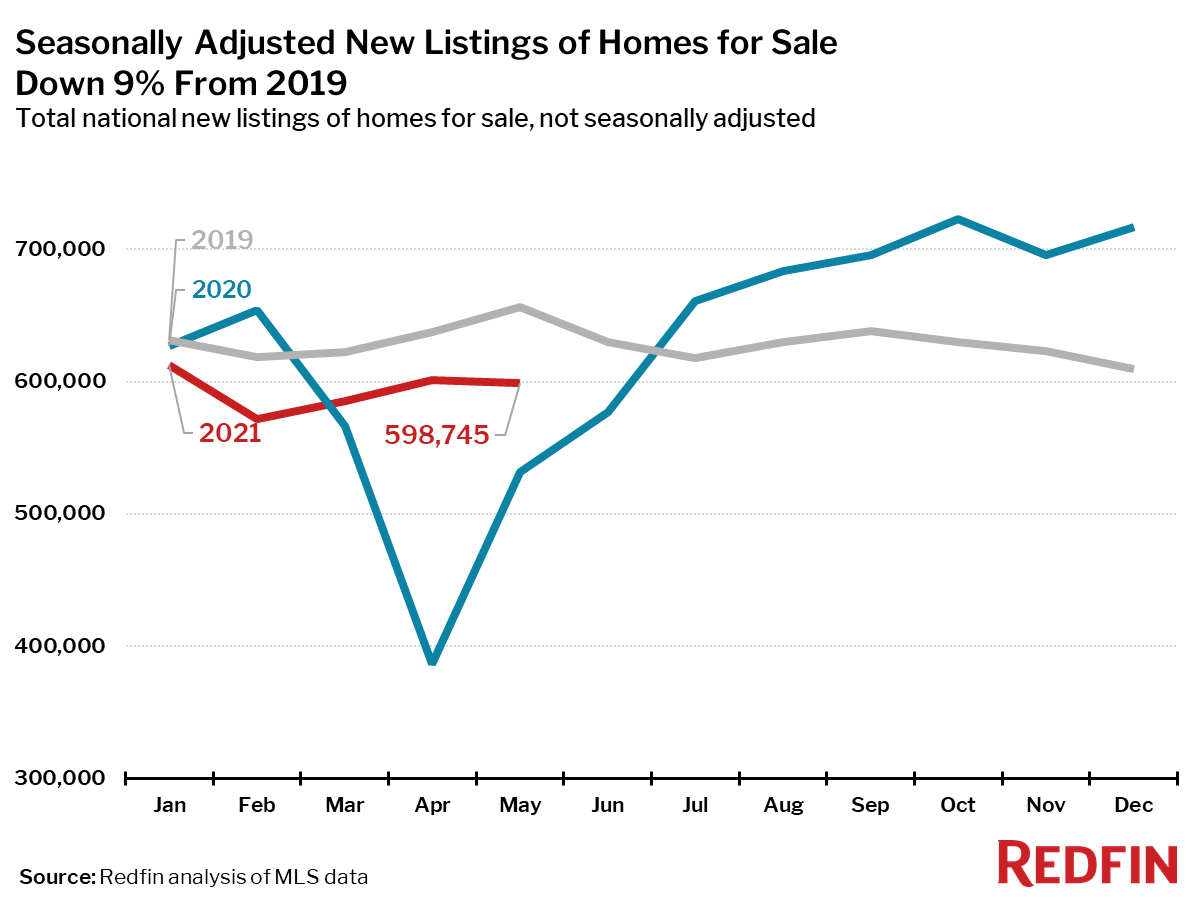
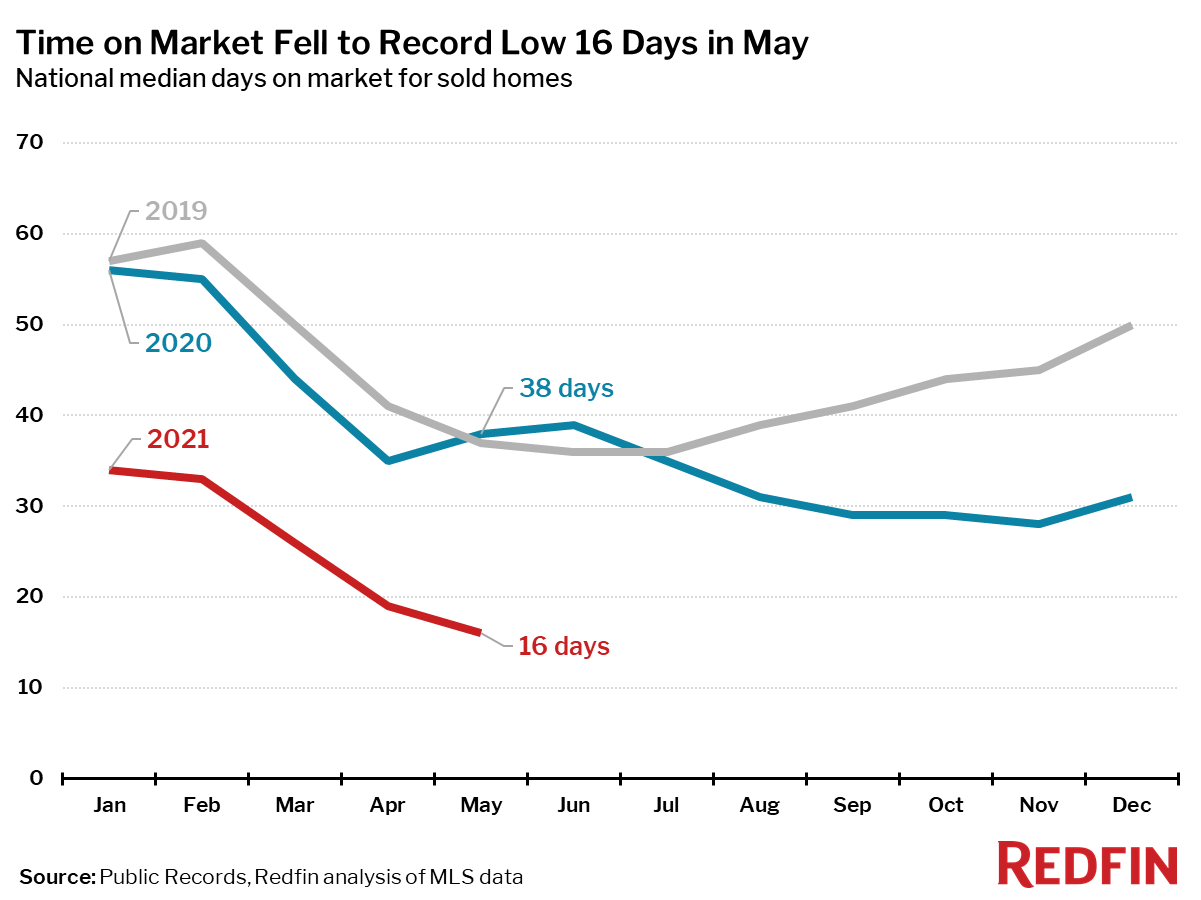
Note: Pandemic lockdowns significantly slowed homebuying and selling, and slightly depressed sale prices in May 2020, which means the year-over-year trends for home prices, pending sales, closed sales and new listings are exaggerated. For more context, we have added extra charts that zoom in on the last three years of home sales and new listings, without seasonal adjustments.
The housing market set new records for home-selling prices, speeds and competition. However, seasonally adjusted home sales and new listings flattened from April. Leading indicators of housing market activity are also declining into June, according to the latest weekly data, signalling that the pace of the market may be slowing. The following measures all hit new records in Redfin’s data, which goes back through 2012:
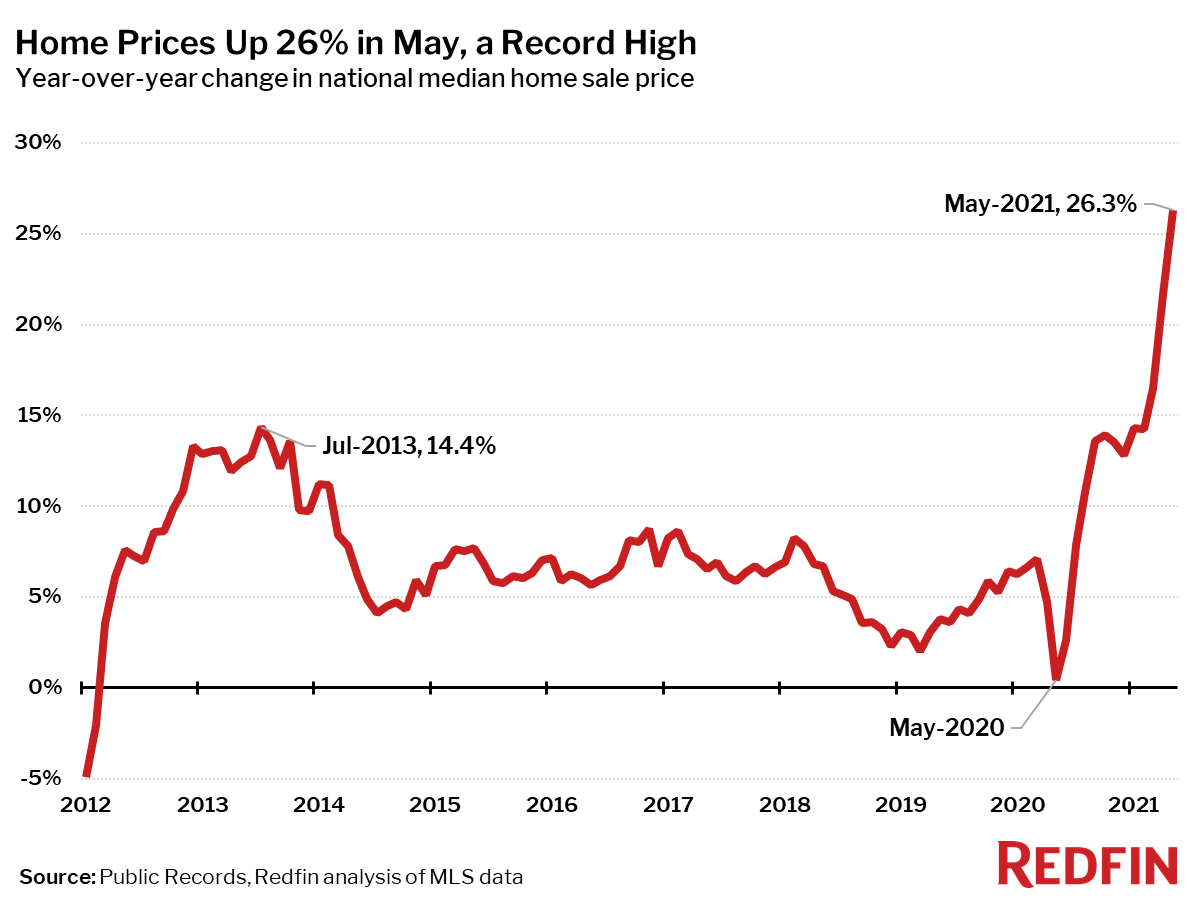
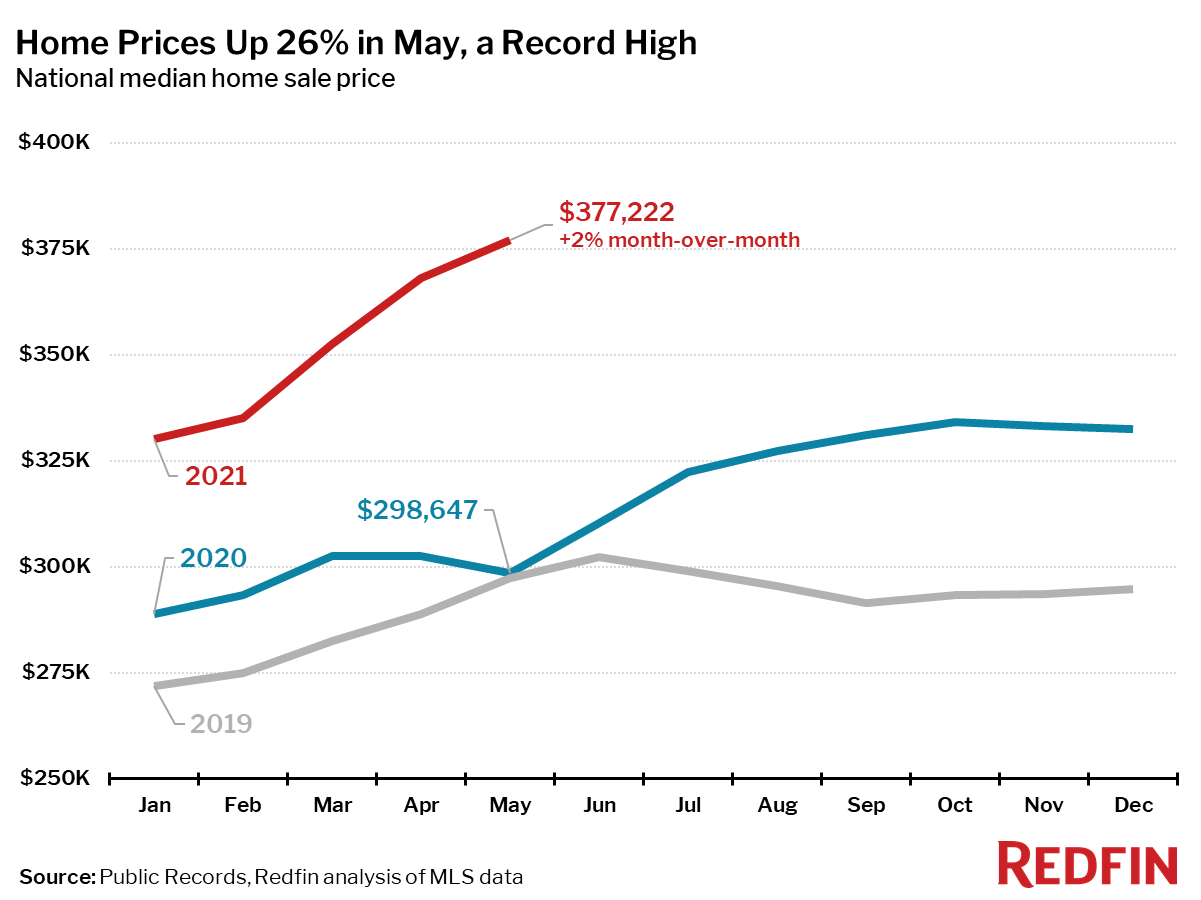
“May marked the likely peak of the blazing hot pandemic housing market, as many buyers and sellers are vaccinated and returning to pre-pandemic spending patterns,” said Redfin Lead Economist Taylor Marr. “Sellers are still squarely in the drivers’ seat, but buyers have hit a limit on their willingness to pay. The affordability boost from low mortgage rates has been offset by high home price growth.”
Median sale prices increased from a year earlier in all of the 85 largest metro areas Redfin tracks. This is partly due to a shift in the mix of homes that are selling toward larger, higher-end properties. The smallest increase was in San Francisco, where prices were up 2.8% from a year ago. The largest price increases were in Austin, TX (+42%), Phoenix, AZ (+33%) and Detroit (+32%). To put Austin’s price increases in context, consider that the sale price of a typical 3 bedroom, 2 bathroom suburban Austin home has increased from around $330,000 in May 2020 to $470,000 in May of 2021.
In Riverside, CA, part of southern California’s Inland Empire just east of Los Angeles, home prices have risen 27% from a year ago, to a median of $503,000.
“Homes in the Inland Empire are still affordable compared to nearby coastal areas like Santa Monica, OC, or San Diego, but they’re nearly double what they used to be just a few years ago,” said Inland Empire, CA Redfin real estate agent Keith Thomas. “Locals are scratching their heads and wondering how they can afford a home as people move into Riverside County and the high desert from LA, Burbank, and other more expensive areas. Many are remote workers looking for something more affordable.”
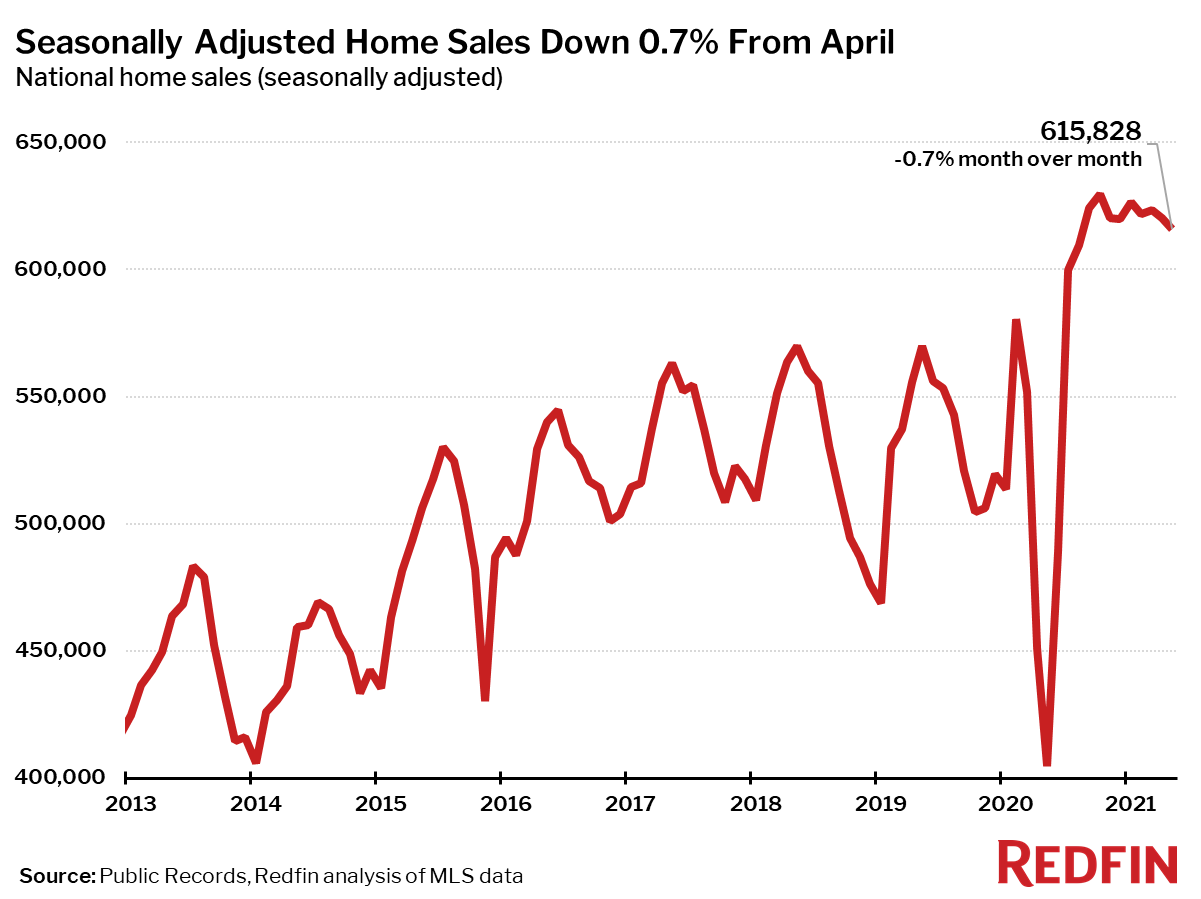
The number of homes sold in May was up 46% from a year earlier, but was down 0.7% from April. Compared to May 2020, home sales rose in all of the 85 largest metro areas Redfin tracks. The largest gains in sales were in places that had the most abrupt slowdown of home sales in May 2020, including San Francisco (+171%), San Jose (+167%) and Warren, MI (+154%).
Seasonally adjusted active listings—the count of all homes that were for sale at any time during the month—fell 27% year over year to their lowest level on record.
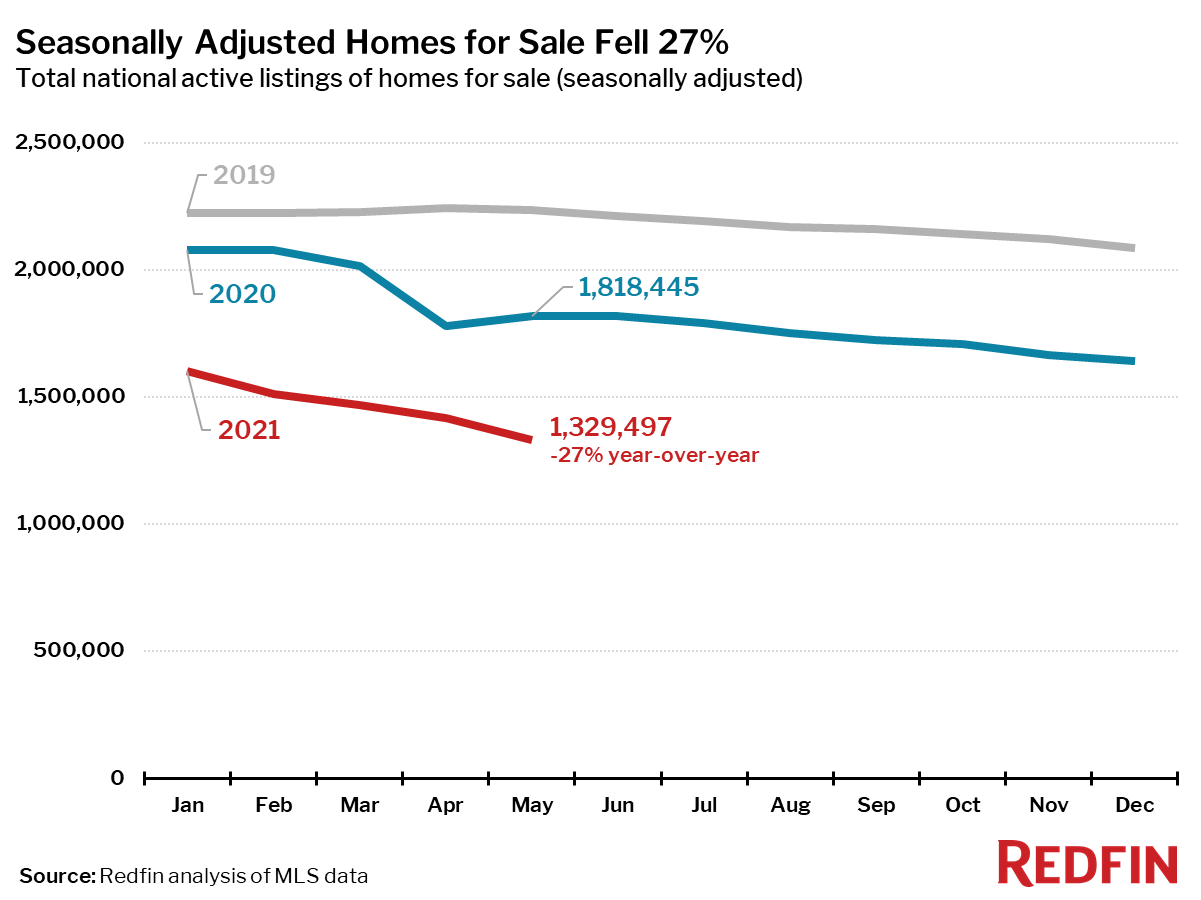
Only seven of the 85 largest metros tracked by Redfin posted a year-over-year increase in the number of seasonally adjusted active listings of homes for sale. Philadelphia (+14%), New York (+13%) and San Francisco (+12%) experienced the biggest gains, all areas that saw a more abrupt decline in listings a year ago.
The biggest year-over-year declines in active housing supply in May were in Baton Rouge, LA (-60%) and North Port, FL (-51%).
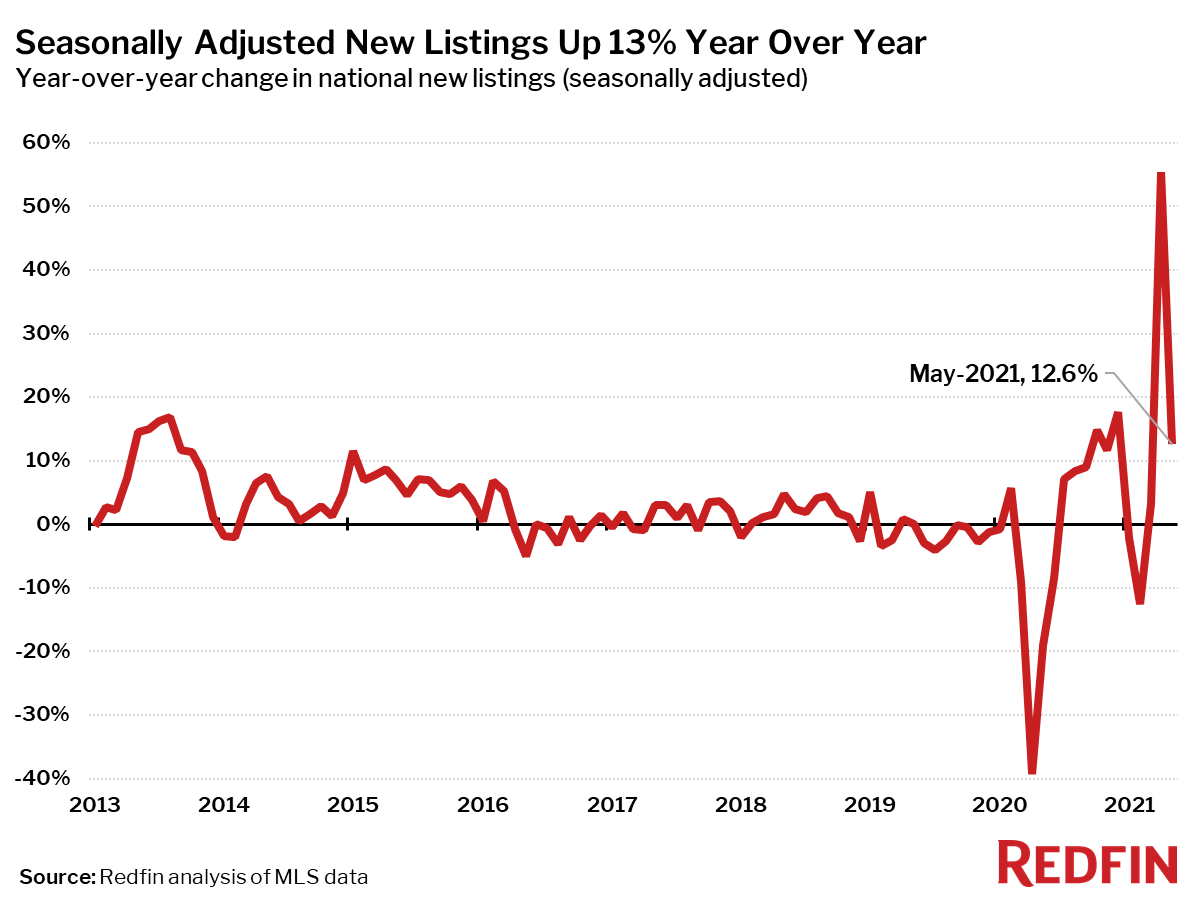
Seasonally adjusted new listings of homes for sale were up 12% in May from a year earlier, but down 14% from the same time in 2019, providing little hope for homebuyers anxious to see more homes to choose from.
New listings fell from a year ago in 18 of the 85 largest metro areas. The biggest declines were in Baton Rouge (-47%) and St. Louis, MO (43%). New listings rose the most from a year ago in New York (+77%), Nassau County (+63%) and Philadelphia (+52%).
Although sales slowed slightly, the housing market was once again more competitive in May than any time since Redfin began tracking national housing data in 2012.
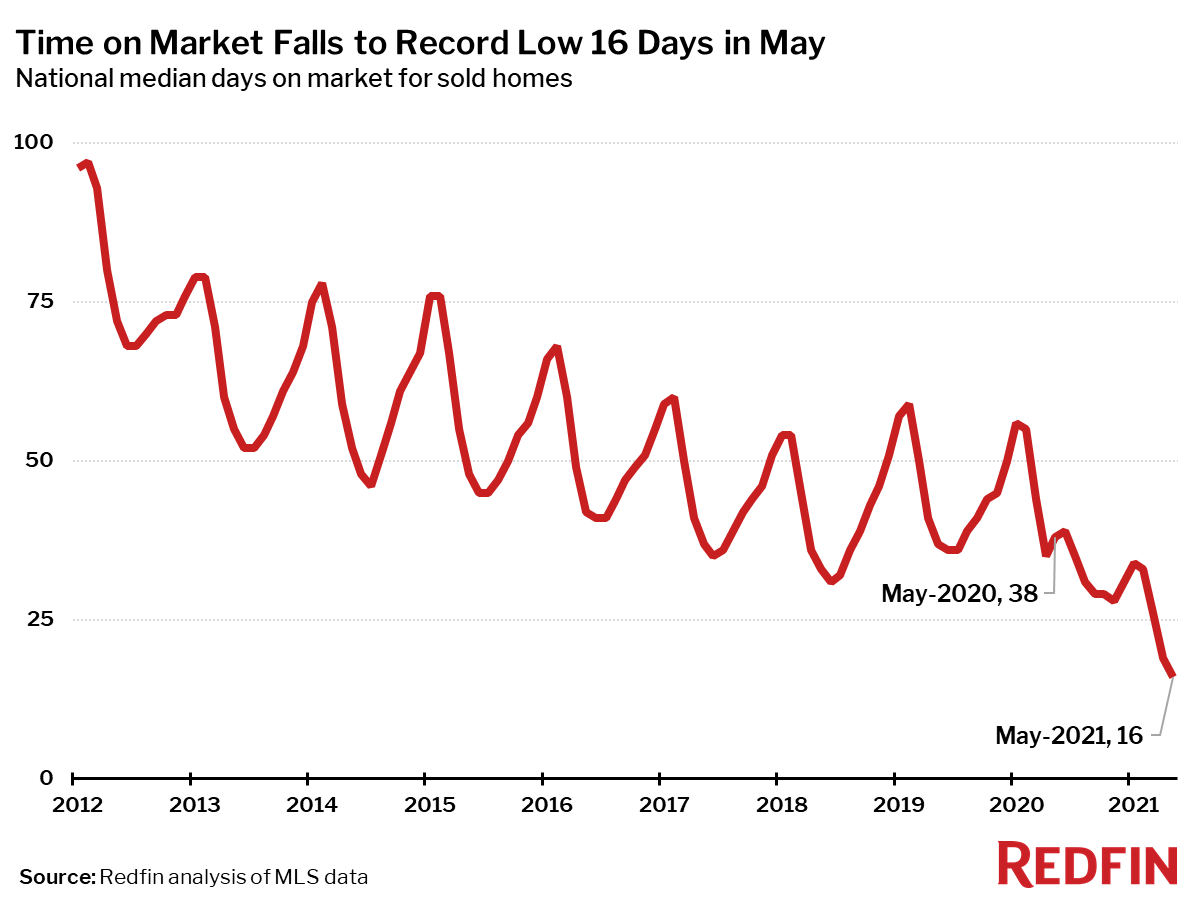
The typical home that sold in May went under contract in 16 days—less than half as much time as a year earlier, when homes sold in a median 38 days.
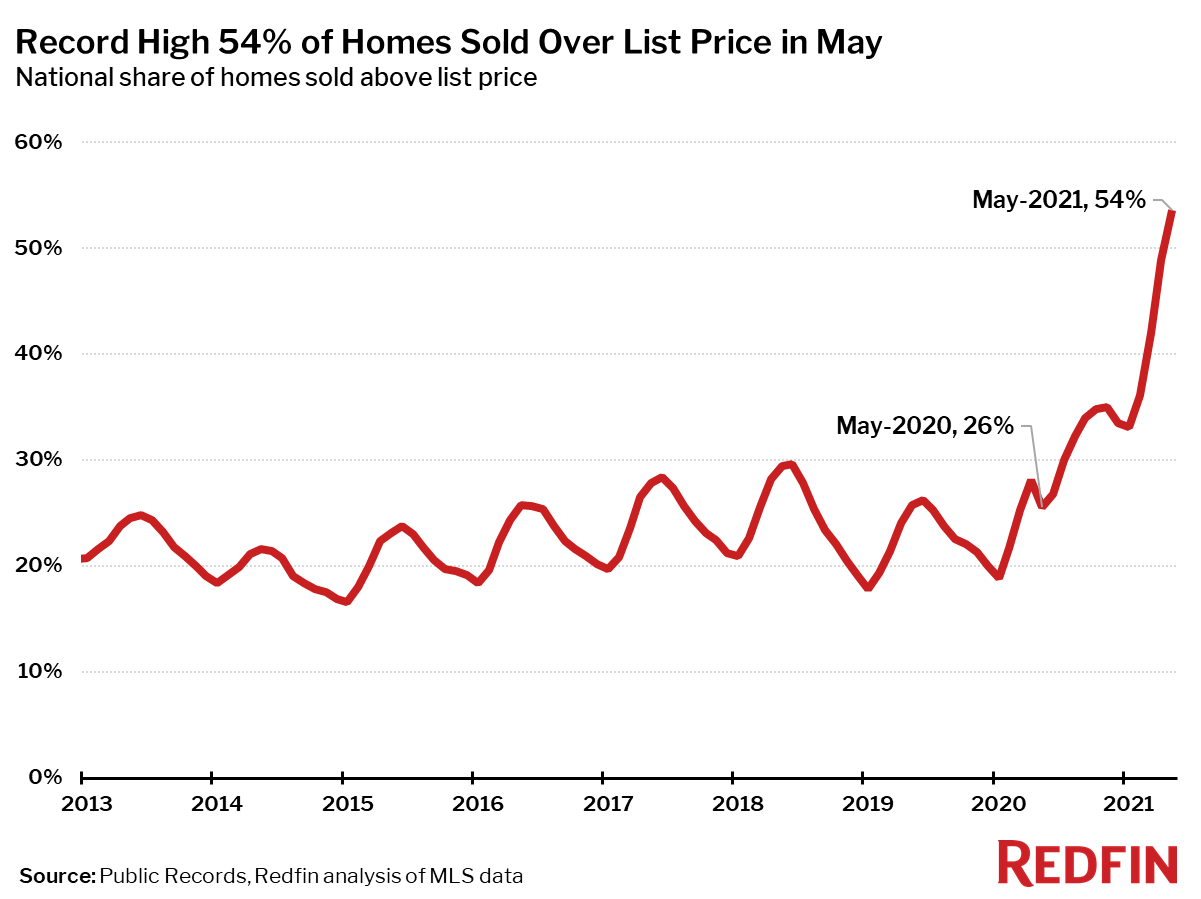
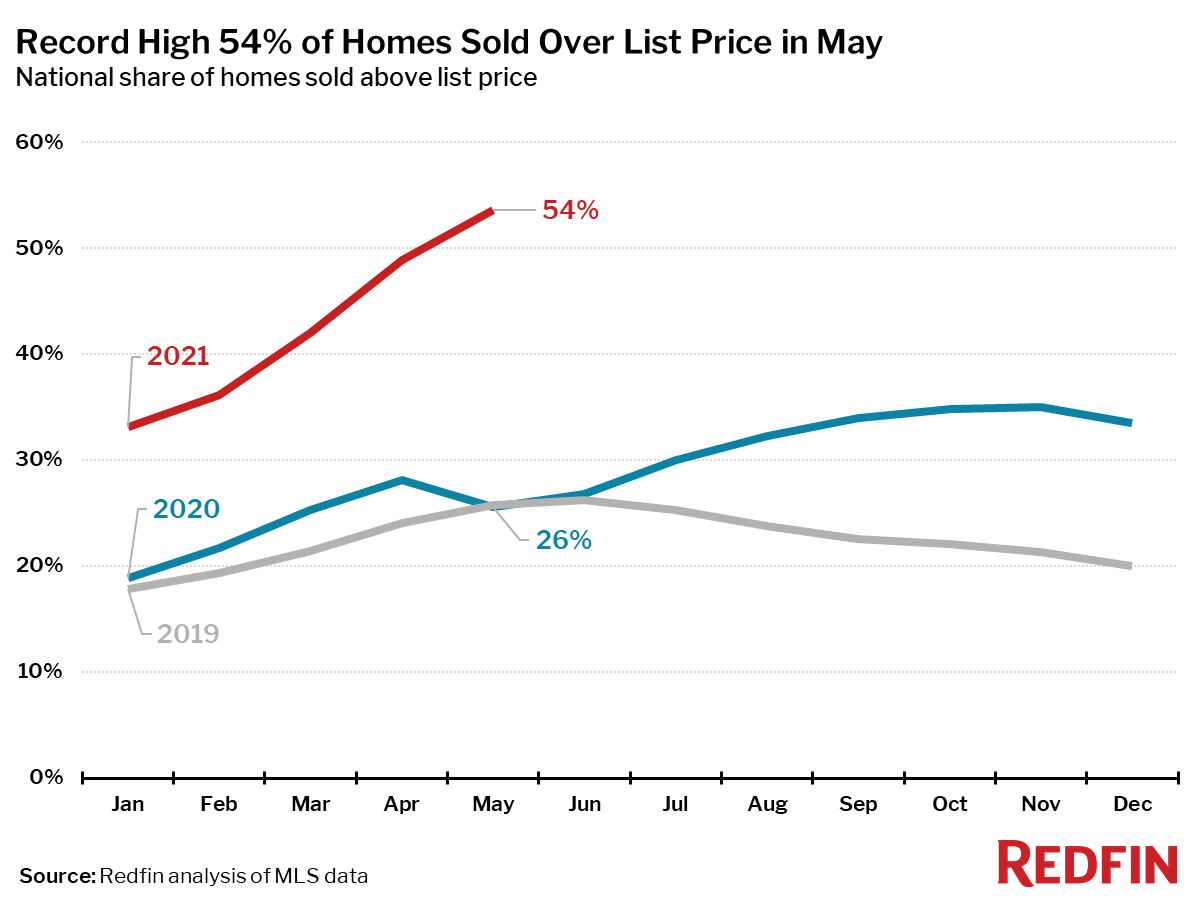
In May, 54% of homes sold above list price, the largest share on record.
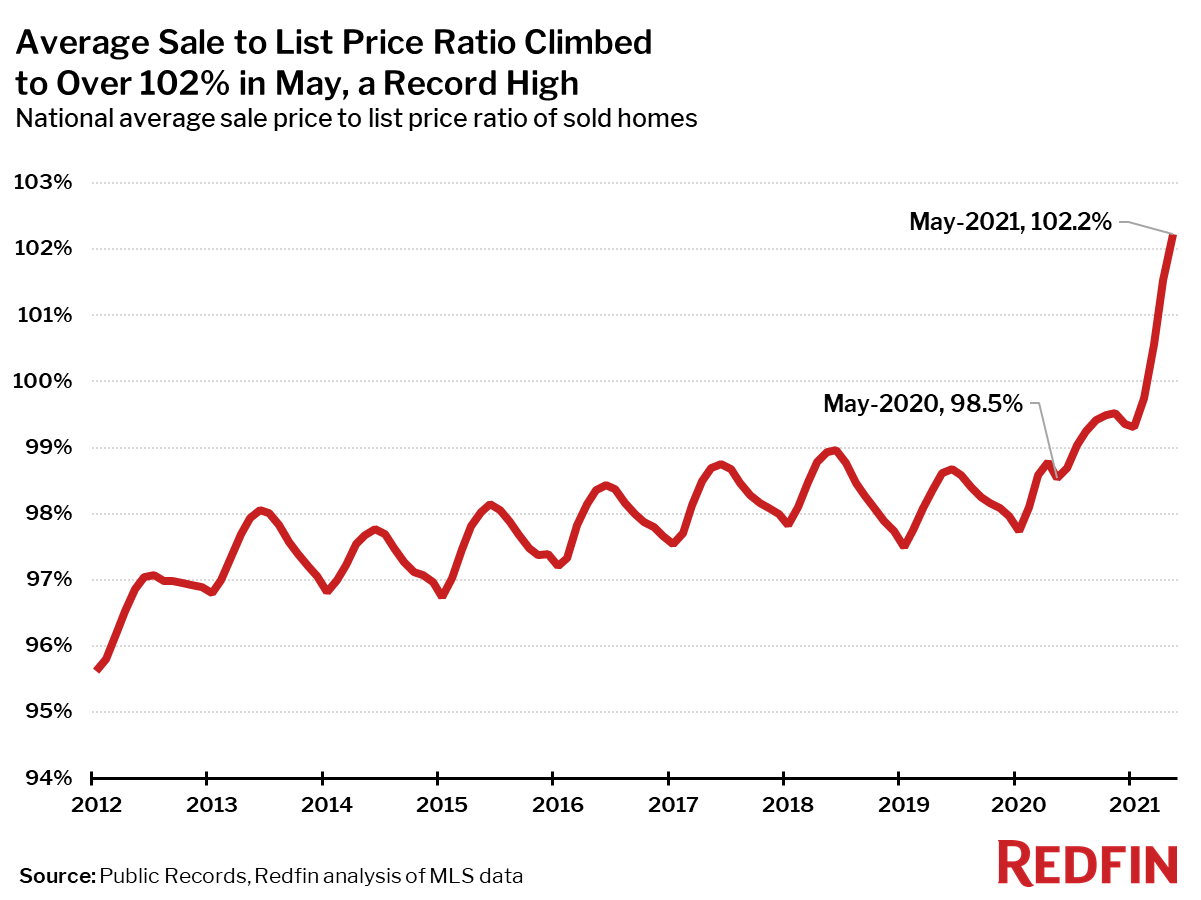
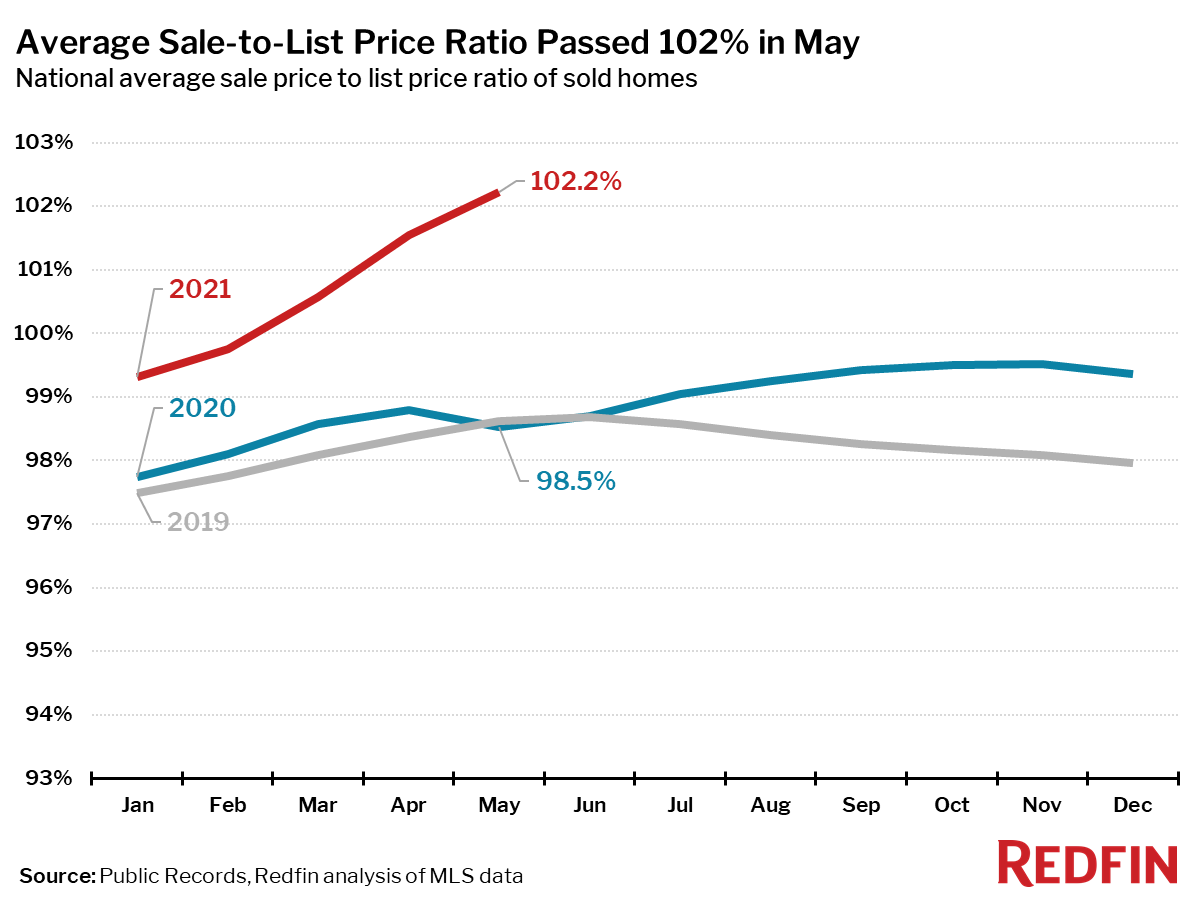
The average sale-to-list price ratio continued to surge in May, hitting a record high of 102.2%. This measure typically peaks in June, so the market is likely to post an additional record high this month.
Competition
Prices
Sales
Inventory
Redfin Estimate
Below are market-by-market breakdowns for prices, inventory, new listings and sales for markets with populations of 750,000 or more. For downloadable data on all of the markets Redfin tracks, visit the Redfin Data Center. Refer to our metrics definition page for explanations of all the metrics used in this report.
