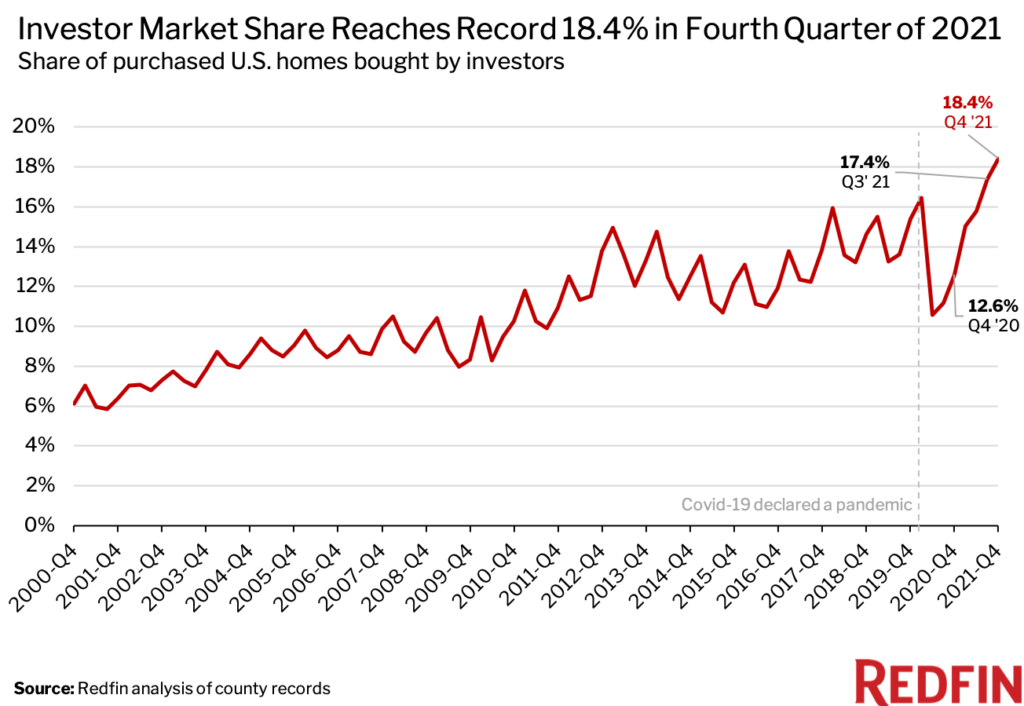
Real estate investors bought a record 18.4% of the homes that were sold in the U.S. during the fourth quarter of 2021, up from 12.6% a year earlier and a revised rate of 17.4% in the third quarter.

We define an investor as any institution or business that purchases residential real estate. When we refer to a “record” in this report, the record dates back to the first quarter of 2000. This data is subject to revision. Scroll to the bottom of this report to read the full methodology.
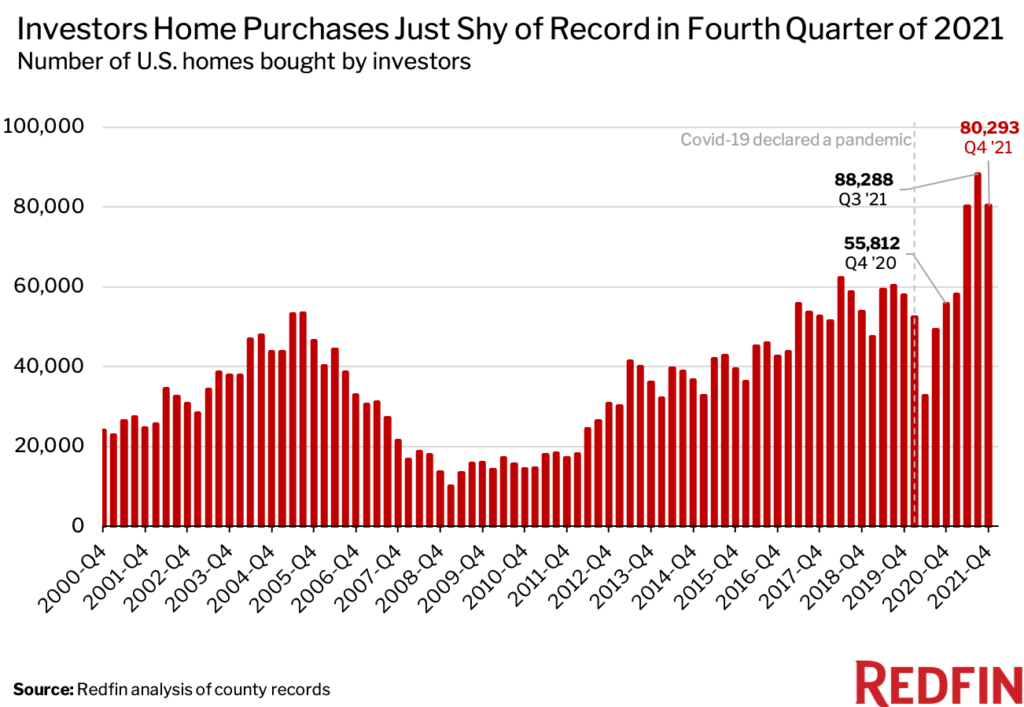
Although investor market share hit a record in the fourth quarter, the number of homes bought by investors declined 9.1% from the third-quarter peak–but it’s up significantly from pre-pandemic levels. Investors bought 80,293 homes in the fourth quarter, up 43.9% from a year earlier. The housing-supply crunch constrained home sales for all homebuyers, including investors. The drop from the third quarter is also due partly to seasonality, as real estate activity tends to slow at the end of the year. In 2019, for example, the number of homes investors purchased dropped 4% from the third to fourth quarters.

The number of homes bought by investors jumped throughout 2021 as home prices rose rapidly–they were up 15% year over year in December–alongside a shortage of homes for sale. Investors are taking advantage of intense demand for rentals and increasing prices, with the average monthly rental payment for a new lease up 14% in December.
Just over three-quarters (75.3%) of investor home purchases were paid for with all cash in the fourth quarter.
“While record-high home prices are problematic for individual homebuyers, they’re one reason why investor demand is stronger than ever,” said Redfin economist Sheharyar Bokhari. “Investors are chasing rising prices because rental payments are also skyrocketing, incentivizing investors who plan to rent out the homes they buy. The supply shortage is also an advantage for landlords, as many people who can’t find a home to buy are forced to rent instead. Plus, investors who ‘flip’ homes see potential to turn a big profit as home prices soar.”
“Investors buying up a record share of for-sale homes is one factor making this market difficult for regular homebuyers,” Bokhari continued. “It’s tough to compete with all-cash offers, and rising mortgage rates have a smaller impact on investors because they often don’t use mortgages at all. If home-price growth slows in the coming year, investor demand may cool down because rental price growth will slow, too.”
In dollar terms, investors bought $49.9 billion worth of homes in the fourth quarter, up from $35 billion a year earlier. The typical home investors purchased sold for $432,971, up nearly 10% from a year earlier. The price increase comes amid surging prices in the overall housing market.
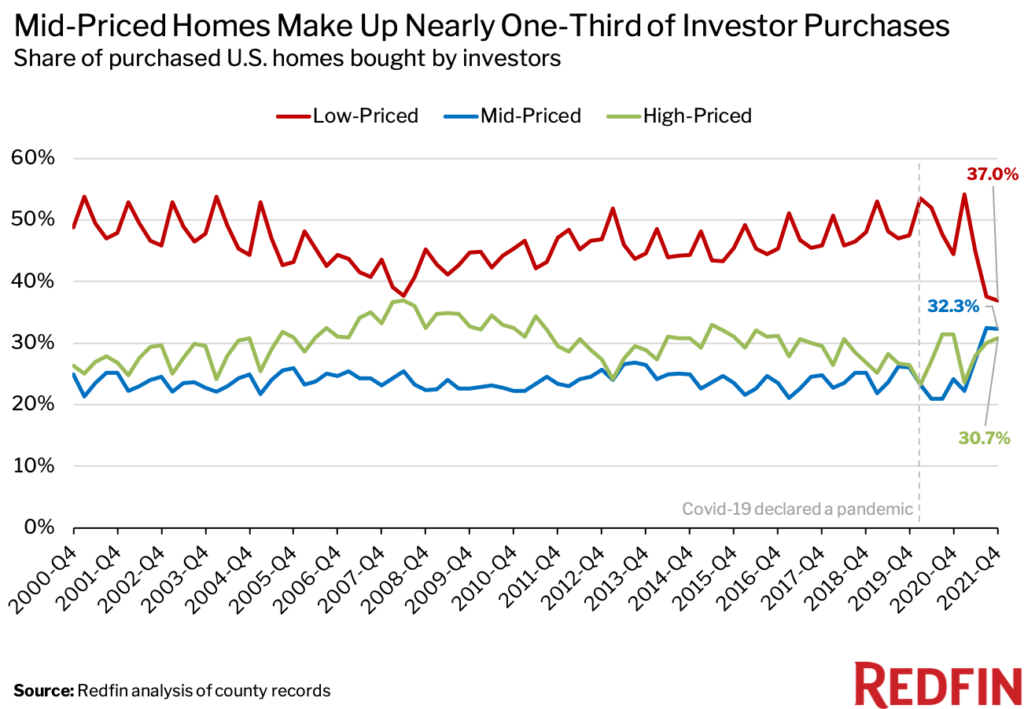
Mid-priced homes are gaining popularity with investors, representing 32.3% of their purchases in the fourth quarter, a record high (essentially tied with 32.4% in the third quarter) and up from 24.1% a year earlier.
Low-priced homes are still more popular than more expensive options for investors, but not by much. Low-priced homes made up 37% of investor purchases in the fourth quarter, a record low and down from 44.5% a year earlier.
Meanwhile, high-priced homes represented 30.7% of investor purchases, up slightly from 30% in the third quarter but down slightly from 31.4% a year earlier.

“Lower price points are still popular with investors, and I don’t expect that to change. One of their main goals is still to buy low and sell high,” Bokhari said. “But investors are also increasingly interested in higher-priced properties, partly because there’s a lack of low-priced inventory and partly because they’re betting on rising demand for high-end rentals.”
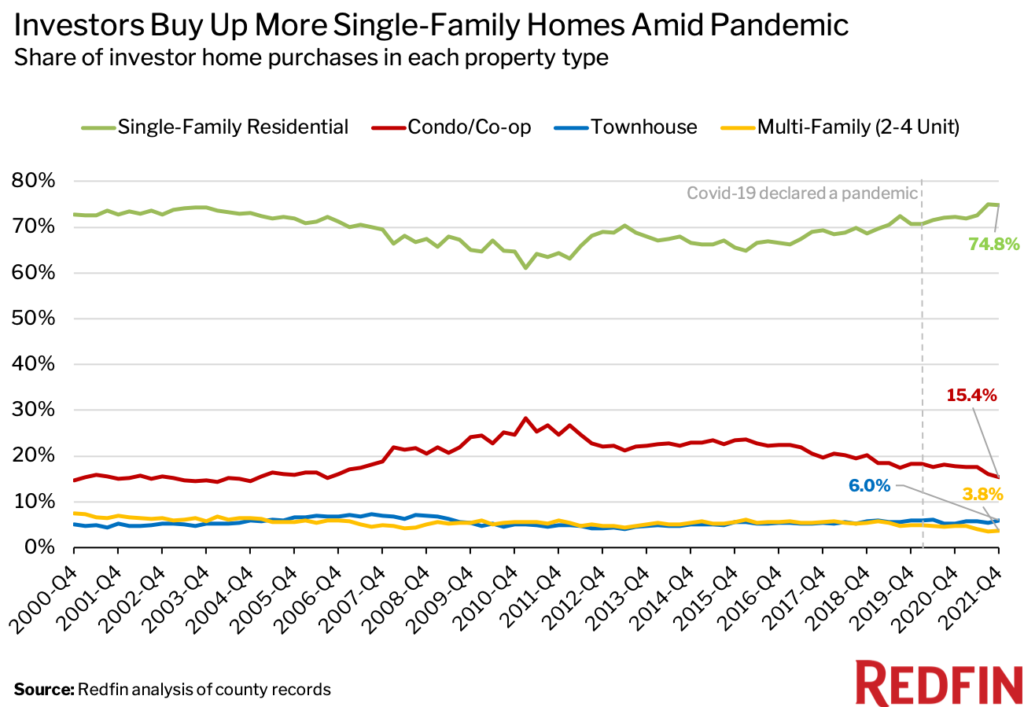
Single-family homes made up about three-quarters (74.8%) of investor purchases in the fourth quarter. That’s near the highest level on record, essentially tied with the third quarter (75%), and up from 72.2% a year before.
Condos and coops made up 15.4% of investor purchases, down from 17.8% a year earlier and 16.1% in the third quarter. Townhouses represented 6% of investor purchases, up from 5.3% a year earlier, and multifamily properties made up 3.8%, down from 4.7% a year earlier.

Single-family homes surged in popularity at the beginning of the pandemic, with many homebuyers searching for space for remote work and online schooling. Investors are likely buying up single-family homes because they still make attractive rentals for those reasons.
Investors had the biggest market share in relatively affordable Sun Belt metros. In Atlanta, 32.7% of homes that sold in the fourth quarter were bought by investors, the biggest share of the 40 U.S. metros in this analysis, and in Charlotte it was 32.1%. They’re followed by Jacksonville, FL (29.8%), Las Vegas (29.2%) and Phoenix (28.4%).
The top three metros for investors—Atlanta, Charlotte and Jacksonville—all had median home-sale prices under the national median of $383,000 in December, making them attractive to investors.
Home prices have risen significantly over the last year in Las Vegas and Phoenix, up 24.8% year over year to $399,400 and up 28% to $435,200, respectively. They’re also two of the most popular migration destinations in the U.S., attracting tens of thousands of new residents in 2021. Atlanta and Charlotte are also among the most popular destinations for Americans moving from one metro area to another, making all four of those areas good bets for investors hoping to rent out properties.
Investor purchases more than doubled from last year in Jacksonville, with a 157% year-over-year increase, the biggest jump of the metros in this analysis. It’s followed by Las Vegas (105.5% year-over-year increase), Charlotte (92.8%), Baltimore (83%), and Atlanta (74.4%). Investor purchases increased from the year before in all but four of the metros in this analysis (Seattle, Nassau County, NY, Newark, NJ and Warren, MI).
Just over 6% of Providence, RI homes that sold in the third quarter were bought by investors, the smallest share of the metros in this analysis. It’s followed by Washington, D.C. (7.8%), Warren, MI (8.2%), Virginia Beach (8.6%) and Montgomery County, PA (8.6%).
For this analysis, we looked at county sale records for homes purchased from January 2000 through December 2021. We define an investor as any buyer whose name includes at least one of the following keywords: LLC, Inc, Trust, Corp, Homes. We also define an investor as any buyer whose ownership code on a purchasing deed includes at least one of the following keywords: association, corporate trustee, company, joint venture, corporate trust. This data may include purchases made through family trusts for personal use.
We analyzed home sales in the 50 most populous metro areas, but only included 40 metros in this report due to non-disclosure of sale prices in some counties.
For the price-tier analysis, we looked at all home sales in a given year and sorted each sale into one of three buckets: low-priced, mid-priced or high-priced. Low-priced means a home’s sale price was in the bottom tercile of local sale prices, while mid-priced means it was in the middle tercile and high-priced means it was in the top tercile.


