

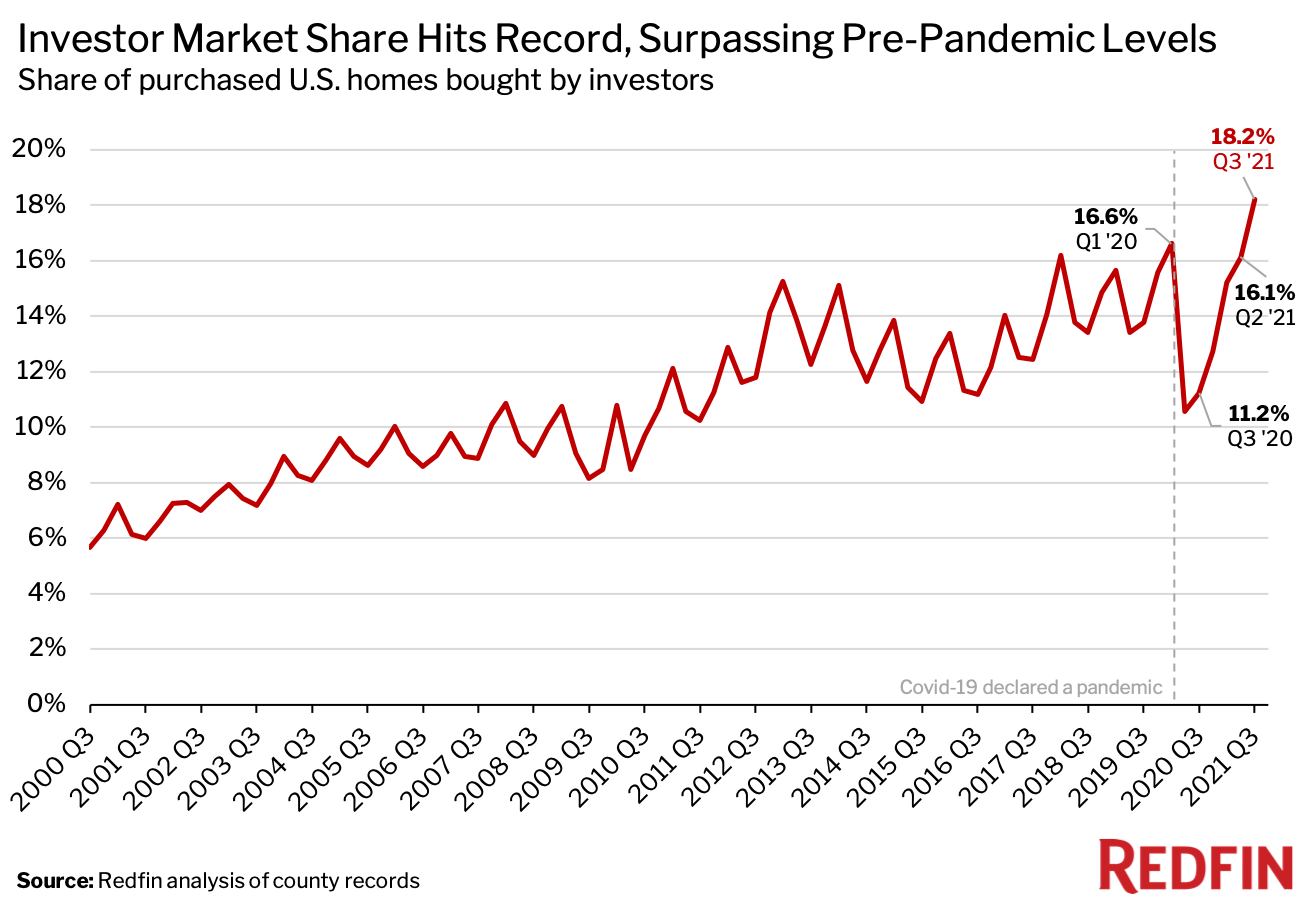
Real estate investors bought a record 18.2% of the U.S. homes that were purchased during the third quarter of 2021, up from a revised rate of 16.1% in the second quarter and 11.2% a year earlier.
We define an investor as any institution or business that purchases residential real estate. When we refer to a “record” in this report, the record dates back to the first quarter of 2000. This data is subject to revision. Scroll to the bottom of this report to read the full methodology.
Investors bought a record 90,215 homes in the third quarter, up 10.1% from the prior quarter and up 80.2% from a year earlier—the second-largest year-over-year gain on record.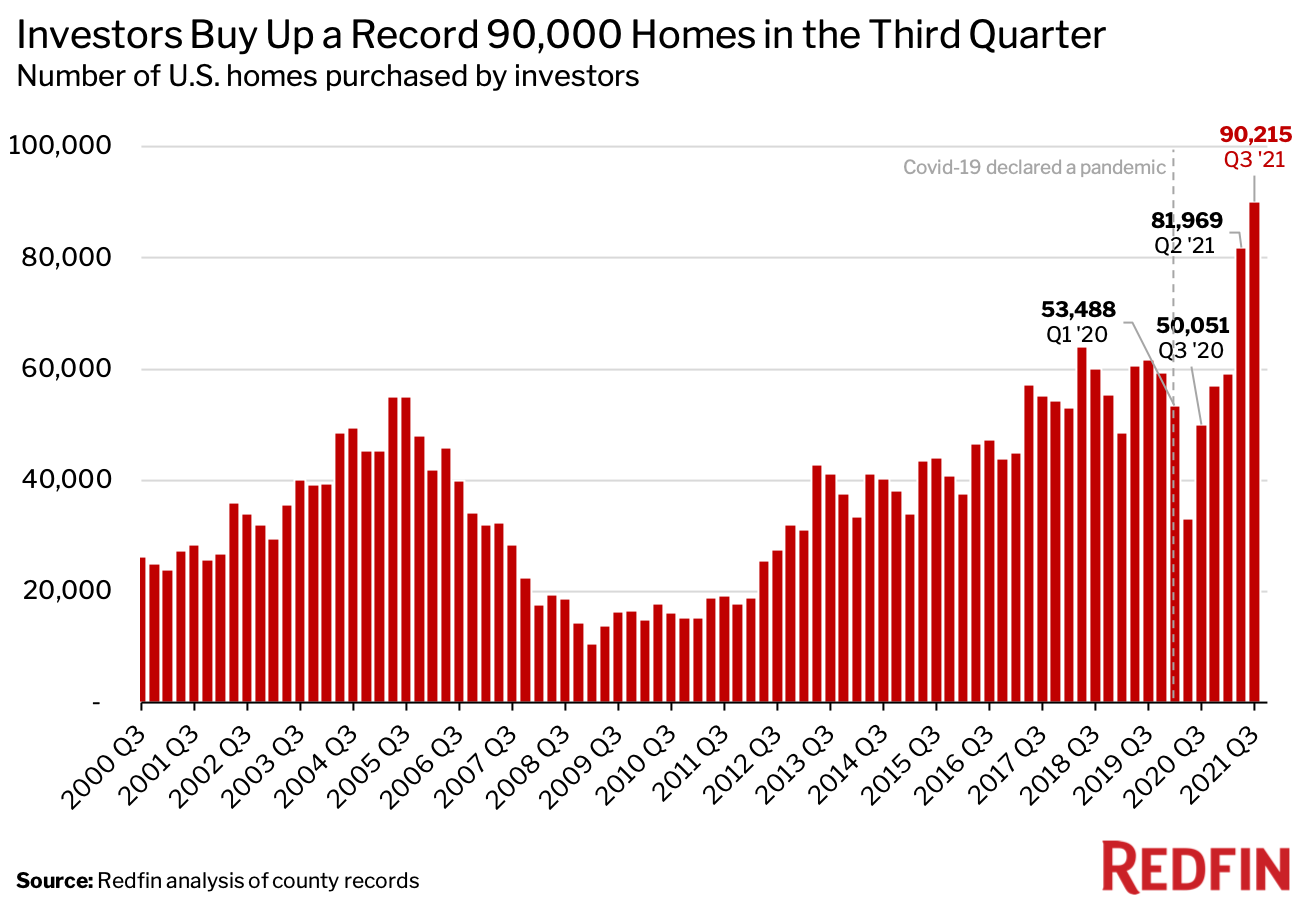
In dollar terms, investors bought a record $63.6 billion worth of homes in the third quarter, up from a revised $58.8 billion in the second quarter and $35.7 billion a year earlier. The typical home they purchased cost $438,770—5.3% higher than a year earlier amid an increase in housing prices. More than three-quarters (76.8%) of investor home purchases were paid for with all cash in the third quarter.
“Increasing home prices fueled by an intense housing shortage have created opportunities for investors to reap big profits,” said Redfin Senior Economist Sheharyar Bokhari. “Those same factors have pushed more Americans to rent, which also creates opportunities for investors because investors typically turn the homes they purchase into rentals and can now charge higher rents.”
Average monthly rents rose 10.7% year over year in September, the fastest growth in at least two years, while the median home sale price increased 13.9%.
“With cash-rich investors taking the housing market by storm, many individual homebuyers have found it tough to compete,” Bokhari said. “The good news for those buyers is that the housing market has started to cool. Bidding wars are on the decline, and if home-price growth continues to ease, we may see investors slow their roll.”
It’s worth noting that home purchases by iBuyers—a type of real estate investor that buys houses from homeowners in quick cash transactions and then resells them—represent a miniscule portion of overall U.S. home purchases despite a recent surge in iBuyer activity.
Single-family homes represented nearly 3 in 4 (74.4%) investor purchases in the third quarter—the highest level on record. That’s up from 70.6% a year earlier. Meanwhile, condos/co-ops made up 16.9% of investor purchases, a record low and a decrease from 19.8% in the third quarter of 2020. Townhouses and multifamily housing represented 5.4% and 3.4% of investor purchases, respectively—little changed from a year earlier.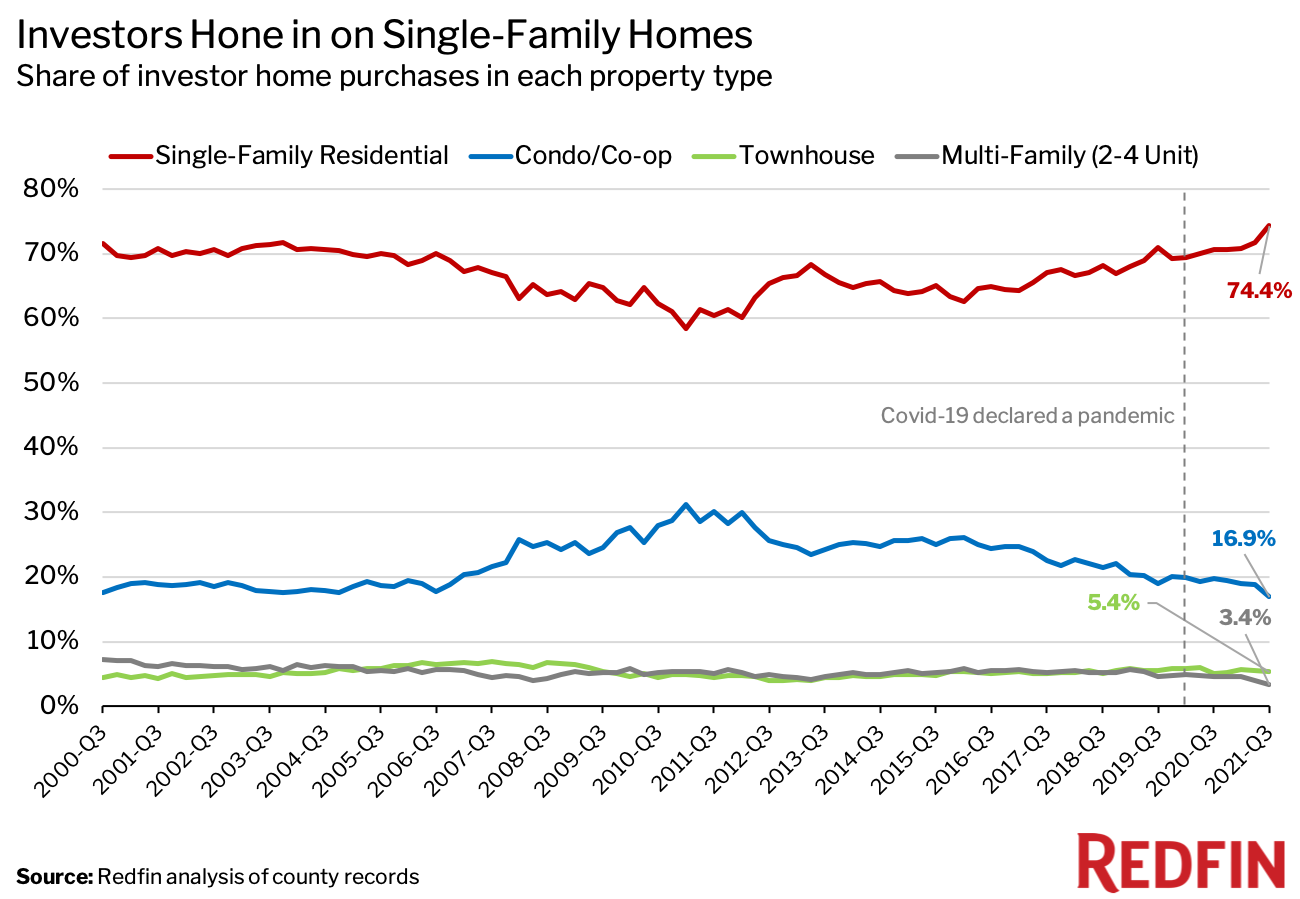
Demand for single-family homes jumped at the onset of the coronavirus pandemic, with many Americans leaving cramped city life behind in search of more space. The number of built-to-rent homes—single-family homes built for the purpose of renting—surged 30% from 2019 to 2020. But demand for condos, which are often located in dense urban areas, will likely rebound in 2022 as cities continue to make a comeback and life returns to normal, according to Redfin Chief Economist Daryl Fairweather.
While low-priced homes still make up the lion’s share of investor purchases, their piece of the pie is shrinking. Low-priced homes represented 36.1% of investor purchases in the third quarter, a record low that’s down from 47% a year earlier. High-priced homes made up 30.8% of investor purchases, down slightly from 32.3% a year earlier.
Meanwhile, mid-priced homes represented a record one-third (33%) of investor purchases, up from 20.8% in the third quarter of 2020. This was the first quarter on record in which mid-priced homes represented a larger share of investor purchases than high-priced homes.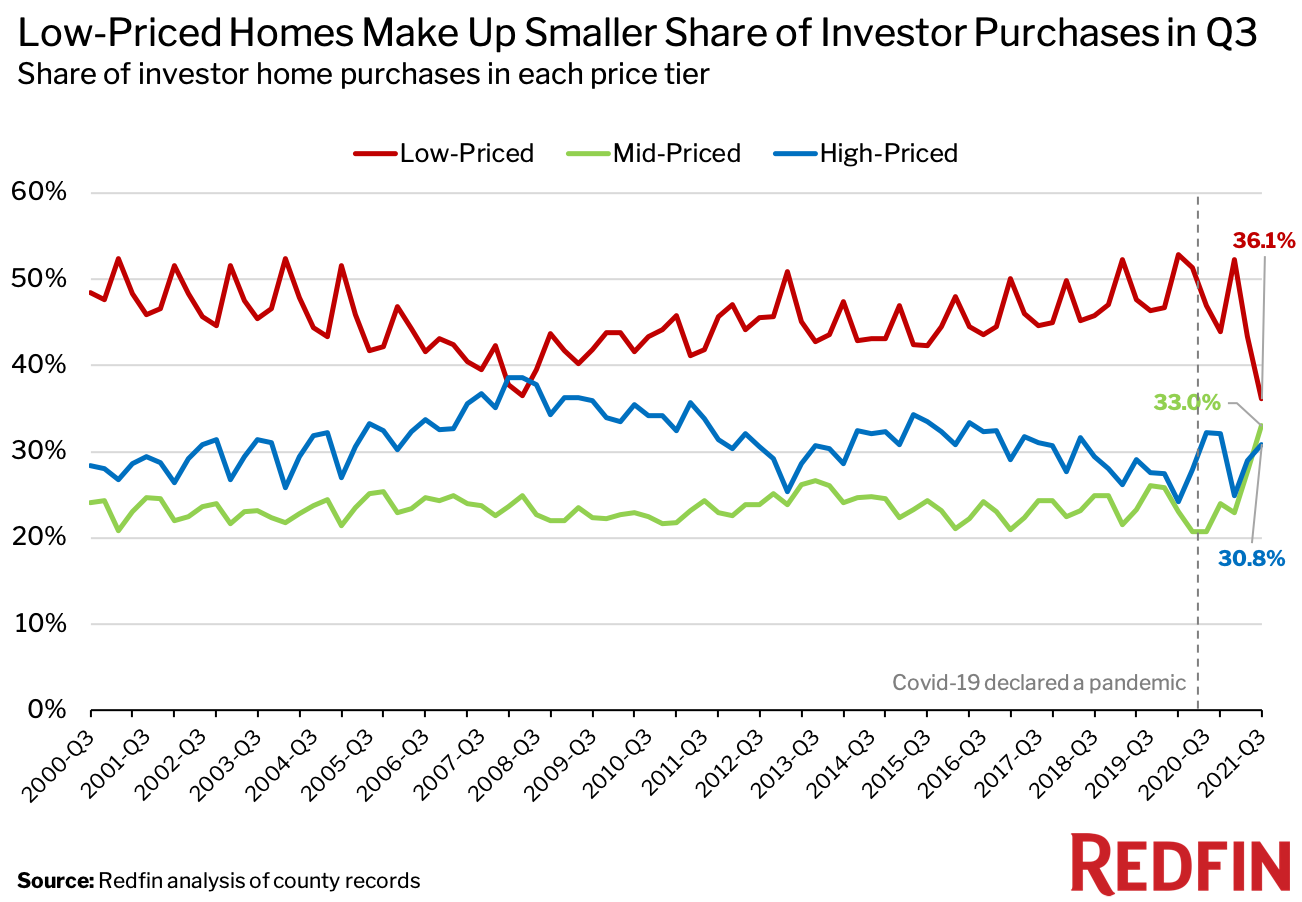
“Housing prices have been surging so much that investors are willing to take on the risk of buying more expensive homes. They’re confident they can still get decent returns,” Bokhari said. “In some circumstances, they may be overpaying given that home-price growth has slowed.”
Bokhari continued: “Investors may also be upping their bets on pricier homes in an effort to profit from pandemic-driven migration. Affluent Americans from expensive cities have increasingly been searching for homes in places where they can get more bang for their buck—like Phoenix and Las Vegas, where investors have a heavy presence.”
Almost two-thirds (65.2%) of the homes investors bought in the third quarter had high heat risk, and a similar share (64.3%) had high storm risk. Meanwhile, 27.1% faced high drought risk, 22.2% had high flood risk, and 3% had high fire risk. These percentages don’t add up to 100% because it’s possible for homes to face more than one climate risk.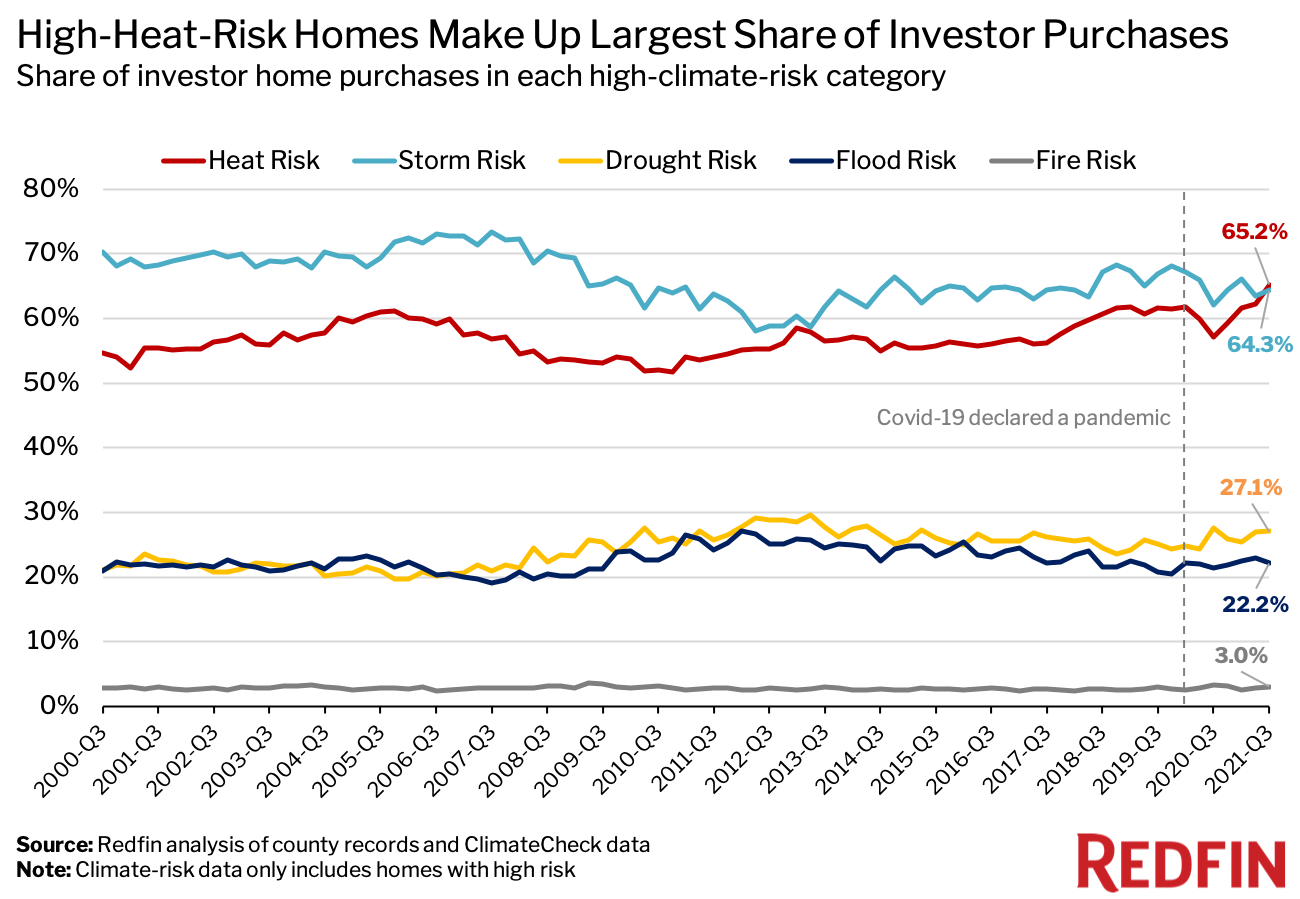
Investors were more likely than non-investors to purchase homes with high heat, drought and flood risk in the third quarter: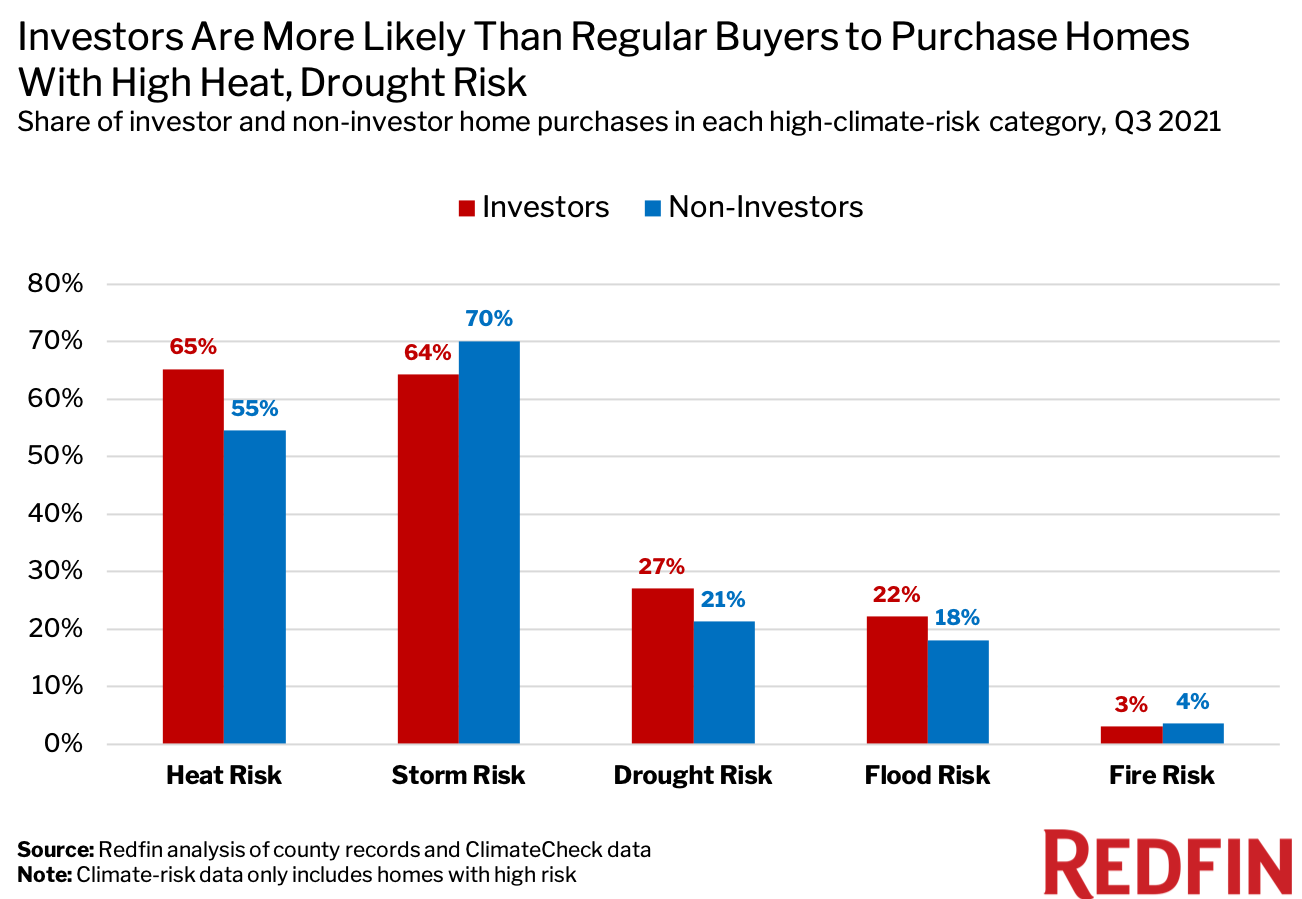
Real estate investors have crowded into cities that are less expensive and offer more space than coastal job centers like San Jose and New York. Many of these cities, like Phoenix and Miami, face very high risk from heat and/or flooding and storms, according to climate data provider ClimateCheck.
Still, new residents are flocking. In Miami, the number of house hunters looking to move in during the third quarter was three times higher than it was a year earlier. An August Redfin analysis found that more people are moving into than out of areas facing high risk from climate change as Americans prioritize factors like affordability and proximity to family over climate hazards.
Homes with high fire risk likely represent a relatively small portion of overall purchases because many areas that face high fire risk are rural and have very few homes, Bokhari added.
In Atlanta, nearly one-third (32%) of homes that sold in the third quarter were purchased by investors—the highest share of the 40 U.S. metropolitan areas Redfin analyzed. Next came Phoenix (31.7%), Charlotte, NC (31.5%), Jacksonville, FL (28.3%) and Miami (28.1%).
Atlanta also saw the largest year-over-year gain, with investor market share rising to 32% in the third quarter from 12.9% a year earlier (+19.1 ppts). The second-biggest jump was in Charlotte (+18.2 ppts), followed by Phoenix (17.7 ppts), Jacksonville (+15.2 ppts) and Las Vegas (+14.6 ppts).
Real estate investors have long placed their bets on mid-sized cities where they can get better bang for their buck. But the pandemic intensified demand for homes in these places, with scores of remote workers searching for extra space and better deals. Miami and Phoenix were the most popular migration destinations among Redfin.com users looking to move to a different metro in the third quarter. Atlanta and Las Vegas were also in the top ten.
Boise, ID is another area that has attracted investors during the pandemic as scores of homebuyers have relocated there from the pricier coastal cities, according to local Redfin real estate agent Shauna Pendleton.
“Investors backed off in the spring and summer due to intense bidding wars, but now they’ve returned,” Pendleton said. “Three of my nine listings that are under contract right now are being bought by investors. Now that the market is a bit less competitive, investors can often get sellers to drop the price a bit or take care of a repair that would eat into their profits if they had to do it themselves.”
In Providence“>Providence, RI, just 5.4% of homes that sold in the third quarter were bought by investors—a lower share than any other metro in this analysis. It was followed by Montgomery County, PA (7.1%), Virginia Beach, VA (7.1%), Washington, D.C. (7.2%) and Warren, MI (7.4%).
New York and San Jose were the only two metros that experienced year-over-year declines in market share, falling 0.6 and 0.4 percentage points, respectively. The following metros all saw increases of less than 1 percentage point: San Francisco, New Brunswick, NJ, Newark, NJ, Virginia Beach, Philadelphia and Nassau County, NY.
For this analysis, we looked at county sale records for homes purchased from January 2000 through September 2021. We define an investor as any buyer whose name includes at least one of the following keywords: LLC, Inc, Trust, Corp, Homes. We also define an investor as any buyer whose ownership code on a purchasing deed includes at least one of the following keywords: association, corporate trustee, company, joint venture, corporate trust. This data may include purchases made through family trusts for personal use.
We analyzed home sales in the 50 most populous metro areas, but only included 40 metros in this report due to non-disclosure of sale prices in some counties.
For the price-tier analysis, we looked at all home sales in a given year and sorted each sale into one of three buckets: low-priced, mid-priced or high-priced. Low-priced means a home’s sale price was in the bottom tercile of local sale prices, while mid-priced means it was in the middle tercile and high-priced means it was in the top tercile.
Climate-risk data for drought, fire, flood, heat, and storm comes from ClimateCheck, which assigns six different climate-risk categories to properties across the U.S.—very low, low, moderate, high, very high and extreme. For this report, a “high-risk” property is one that falls into the high, very high, or extreme category for a given climate risk. For each environmental disaster—drought, fire, flood, heat, and storm—we identified the share of homes facing high risk. The climate-risk data in this report is as of March 31, 2021.
