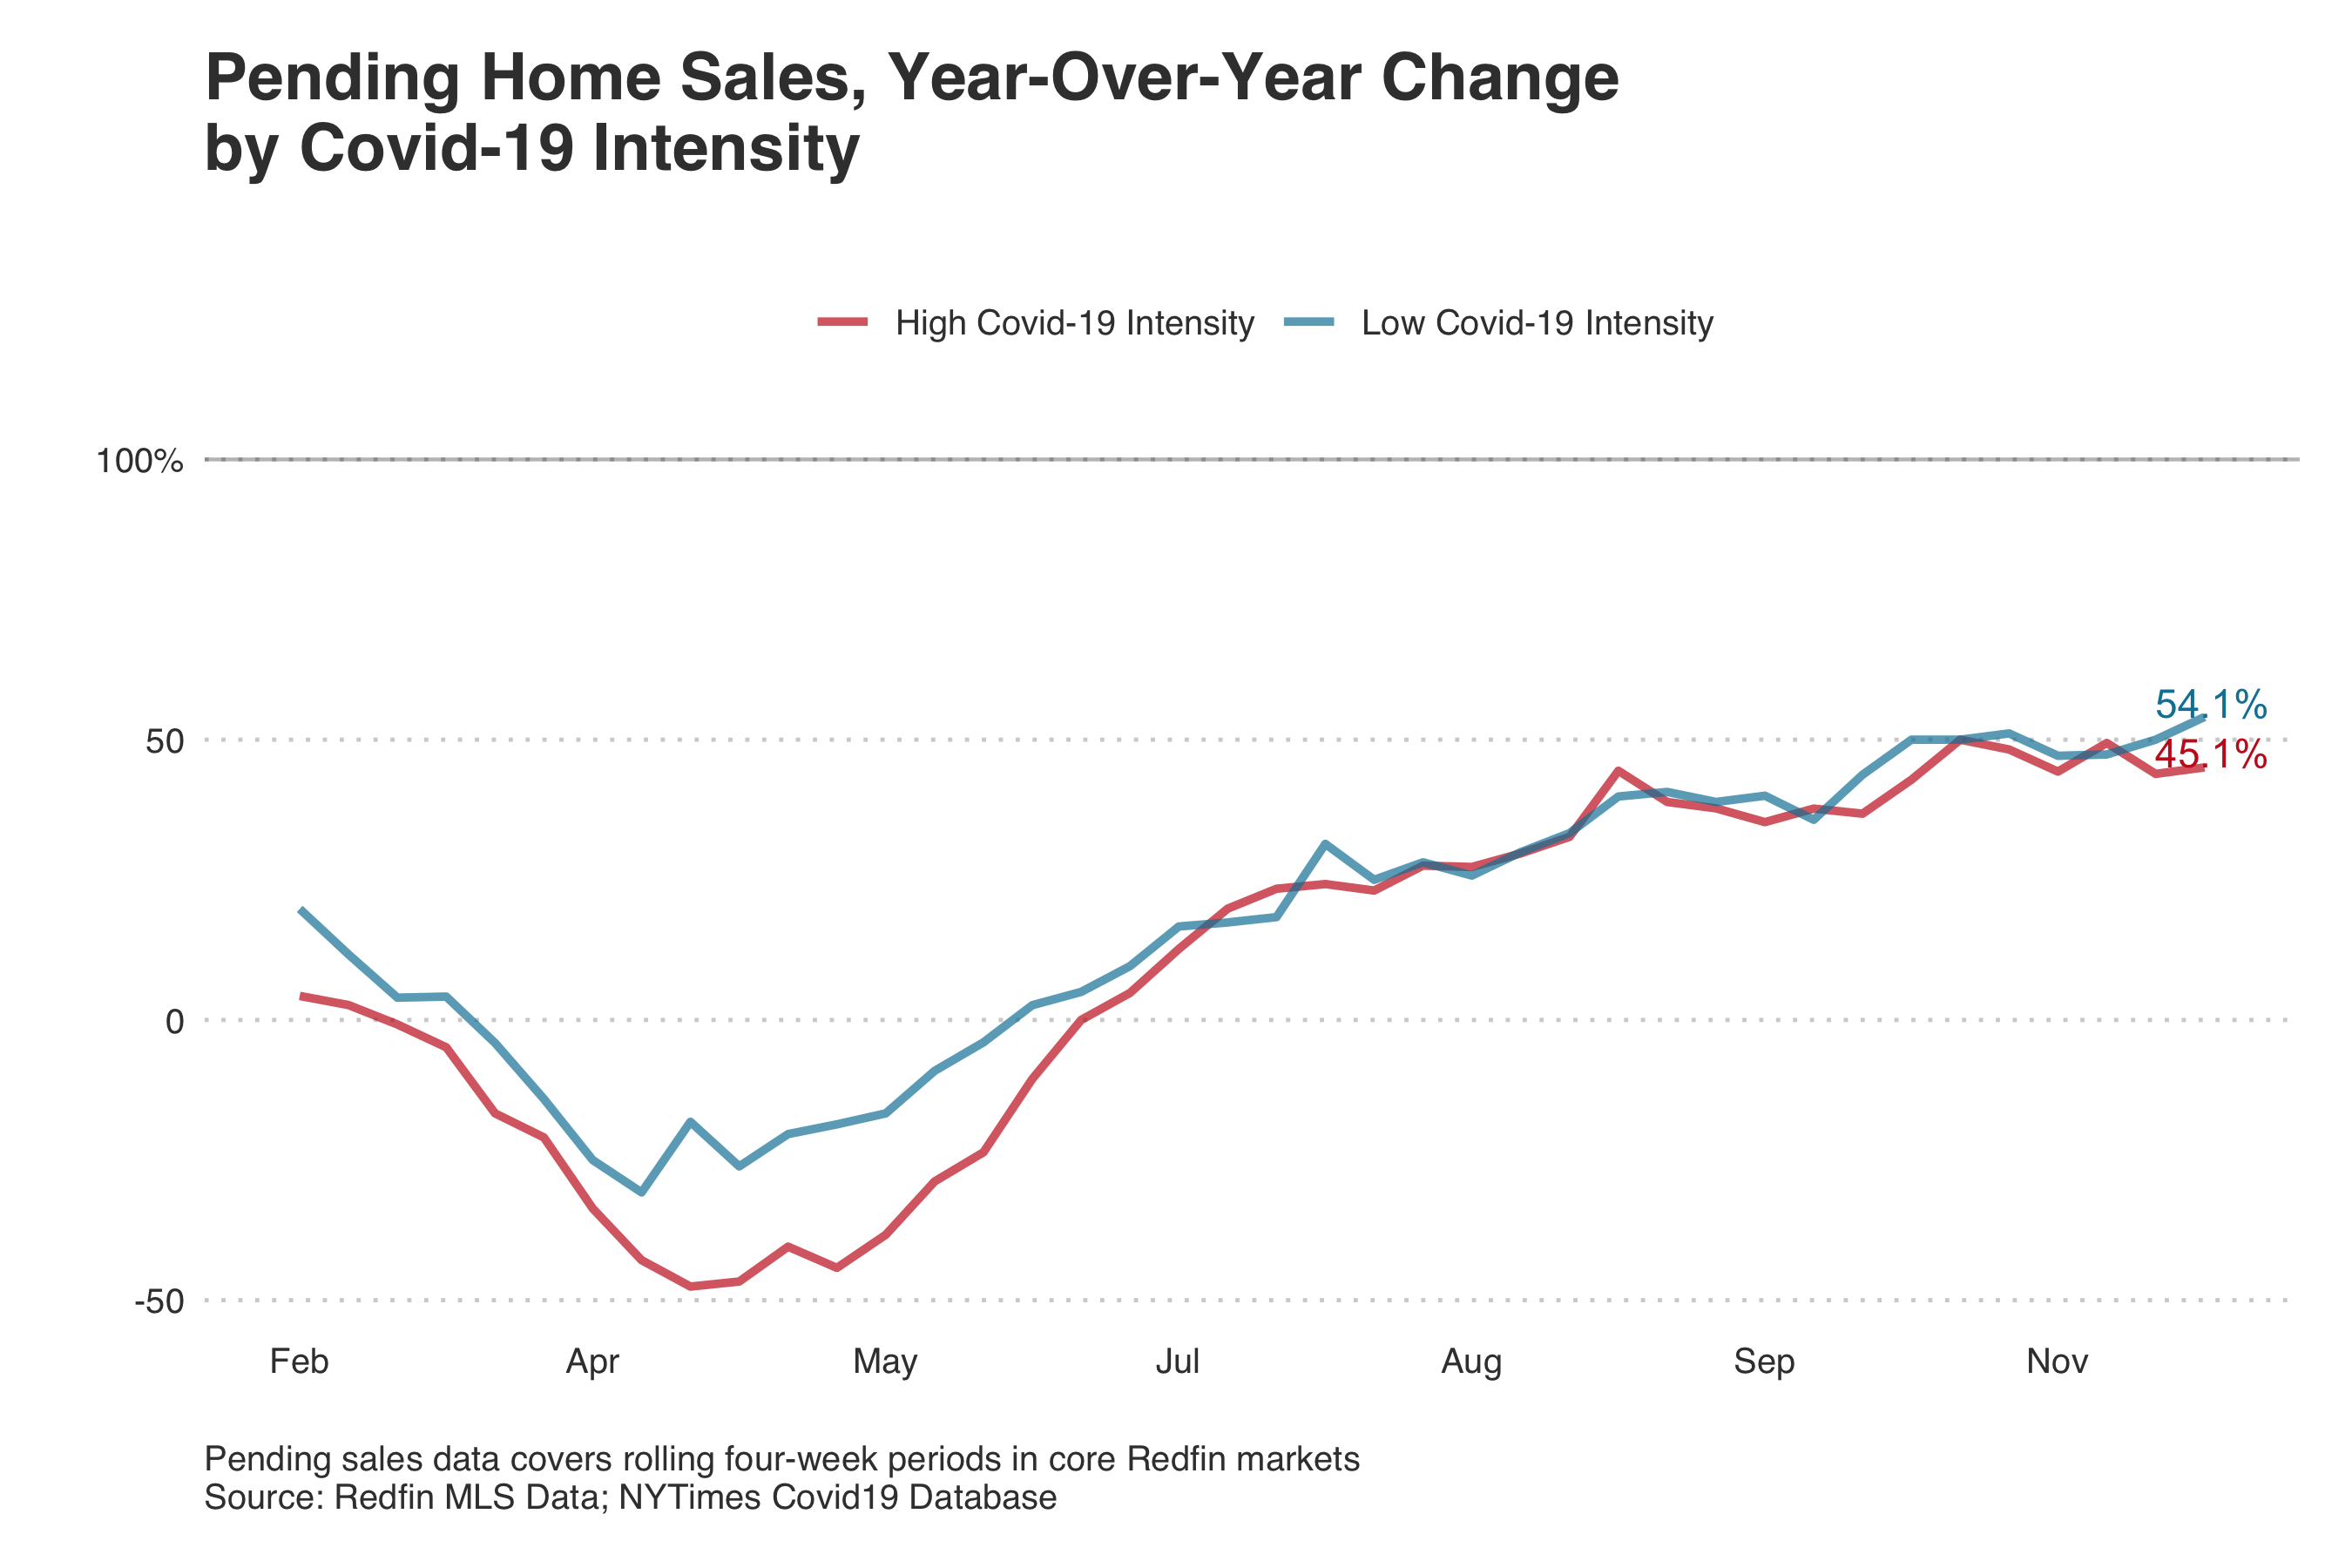
Pending home sales rose 54.1% year over year in U.S. counties with low concentrations of Covid-19 cases during the four-week period ending Dec. 1, outpacing the 45.1% growth in counties with high concentrations of Covid-19 cases.
This is according to an analysis of counties across 116 U.S. metropolitan areas. We define a high Covid-19 intensity county as a county where cumulative coronavirus cases per capita are at least 80% higher than the other counties in this analysis, while a low Covid-19 intensity county is one that ranks in the bottom 20% by cumulative cases per capita.

Home sales have been surging across the board due to record-low mortgage rates and a wave of migration fueled by remote work. Places with low concentrations of coronavirus cases have seen especially high sales growth, in part because they’ve experienced influxes of new residents during the pandemic, according to Redfin Senior Economist Reginald Edwards.
“Many of the counties with fewer coronavirus cases per capita happen to be the same suburban counties that people are moving to during the pandemic. Folks are migrating to these places because the crowded, expensive cities they used to live in no longer have as much to offer, with restaurants, entertainment and workplaces shut down,” Edwards said. “The counties with fewer cases per capita are also seeing higher growth in home listings, which is allowing home sales to flourish.”
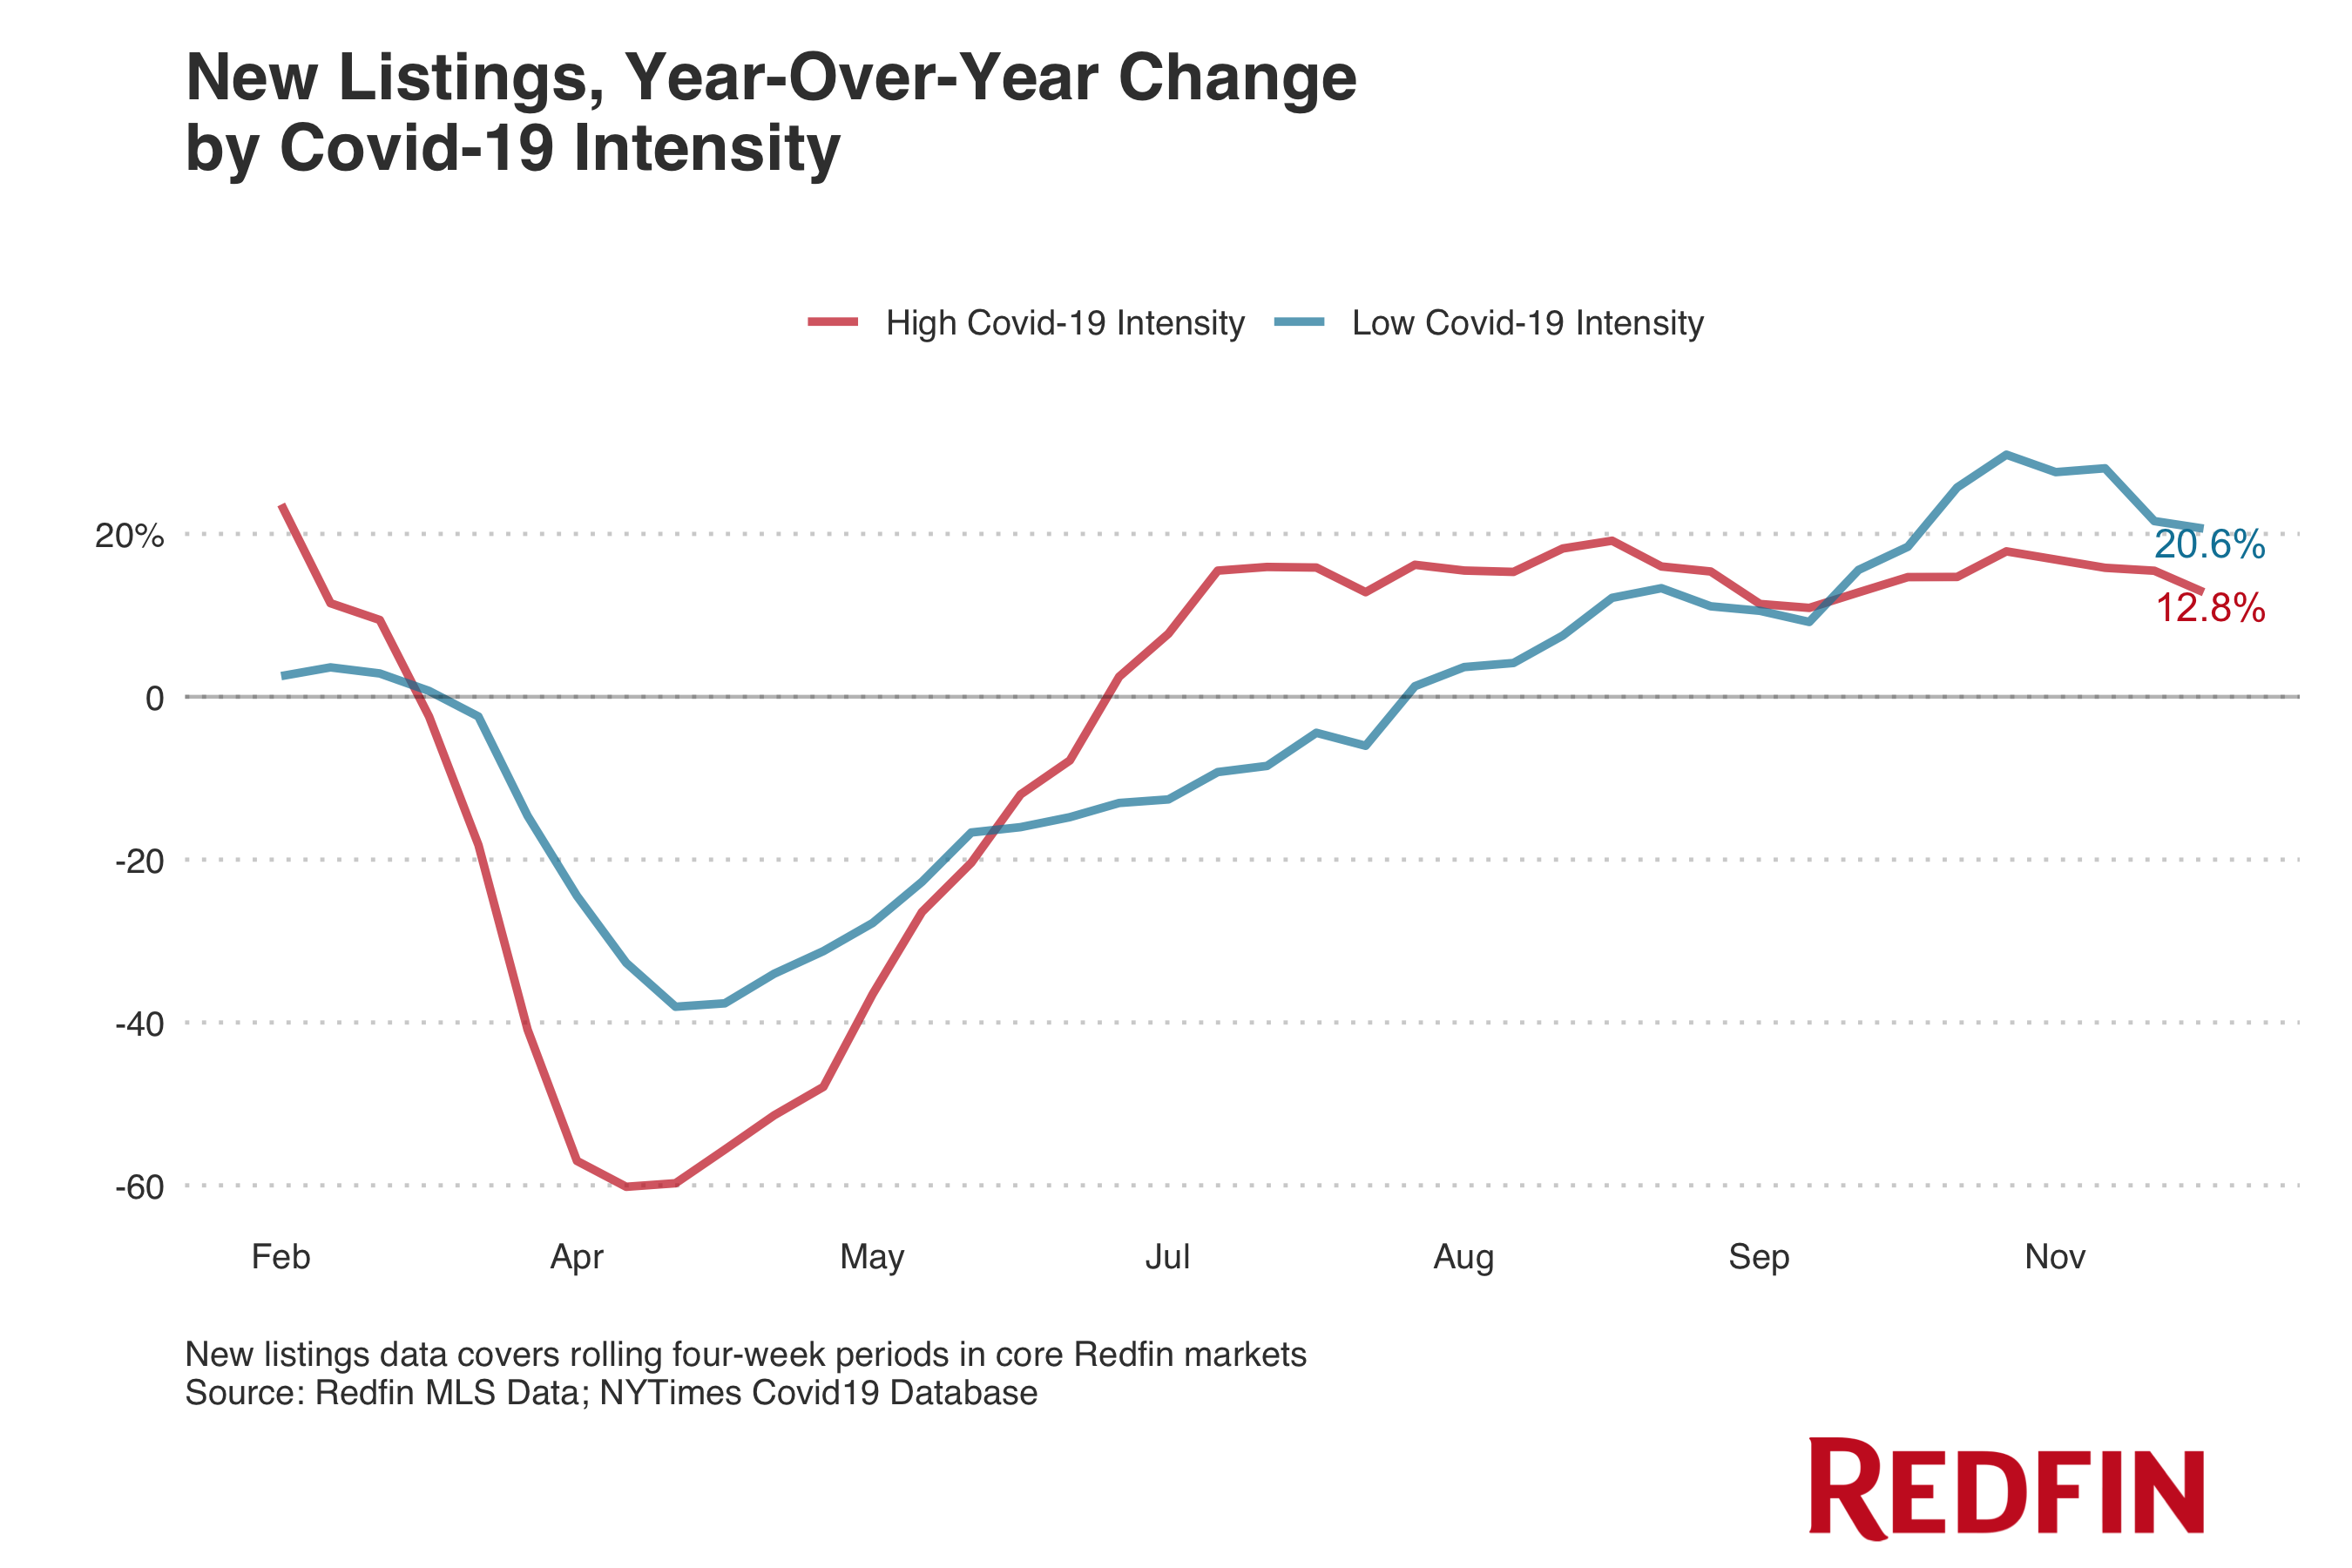
New listings climbed 20.6% year over year in counties with low concentrations of Covid-19 cases during the four-week period ending Dec. 1, compared with 12.8% growth in counties with high concentrations of Covid-19 cases. The gap was even more stark back in April, likely because real estate activity was restricted in many places across the country at the beginning of the pandemic.

Redfin real estate agent Ali Schneider said one of her buyers recently viewed a home that they liked in Danville, CA , but the sellers then took it off the market after just a few weeks because they were worried they would be exposed to the coronavirus.
“They got nervous because so many prospective buyers were scheduling showings. Every day, people were coming through and touching their doorknobs,” Schneider said. “Some sellers are very reluctant to let people into their homes during this pandemic, which is why we’ve seen a lack of new listings here. Plus, not a lot of folks want to put their houses up for sale during the holidays.”
Massachusetts Redfin agent Alysandra Nemeth said she thinks new listings have taken a slight hit because people are spending so much time at home during the pandemic.
“A lot of homeowners can’t get their kids, dogs, and themselves out of the house for long enough to put their property on the market,” she said. “I also know people who are really nervous about having strangers touring their homes during a pandemic. It’s tough, because they also know that it’s the perfect time to sell—they’re going to get top-dollar for their home since there’s such a severe inventory shortage and everyone is moving.”
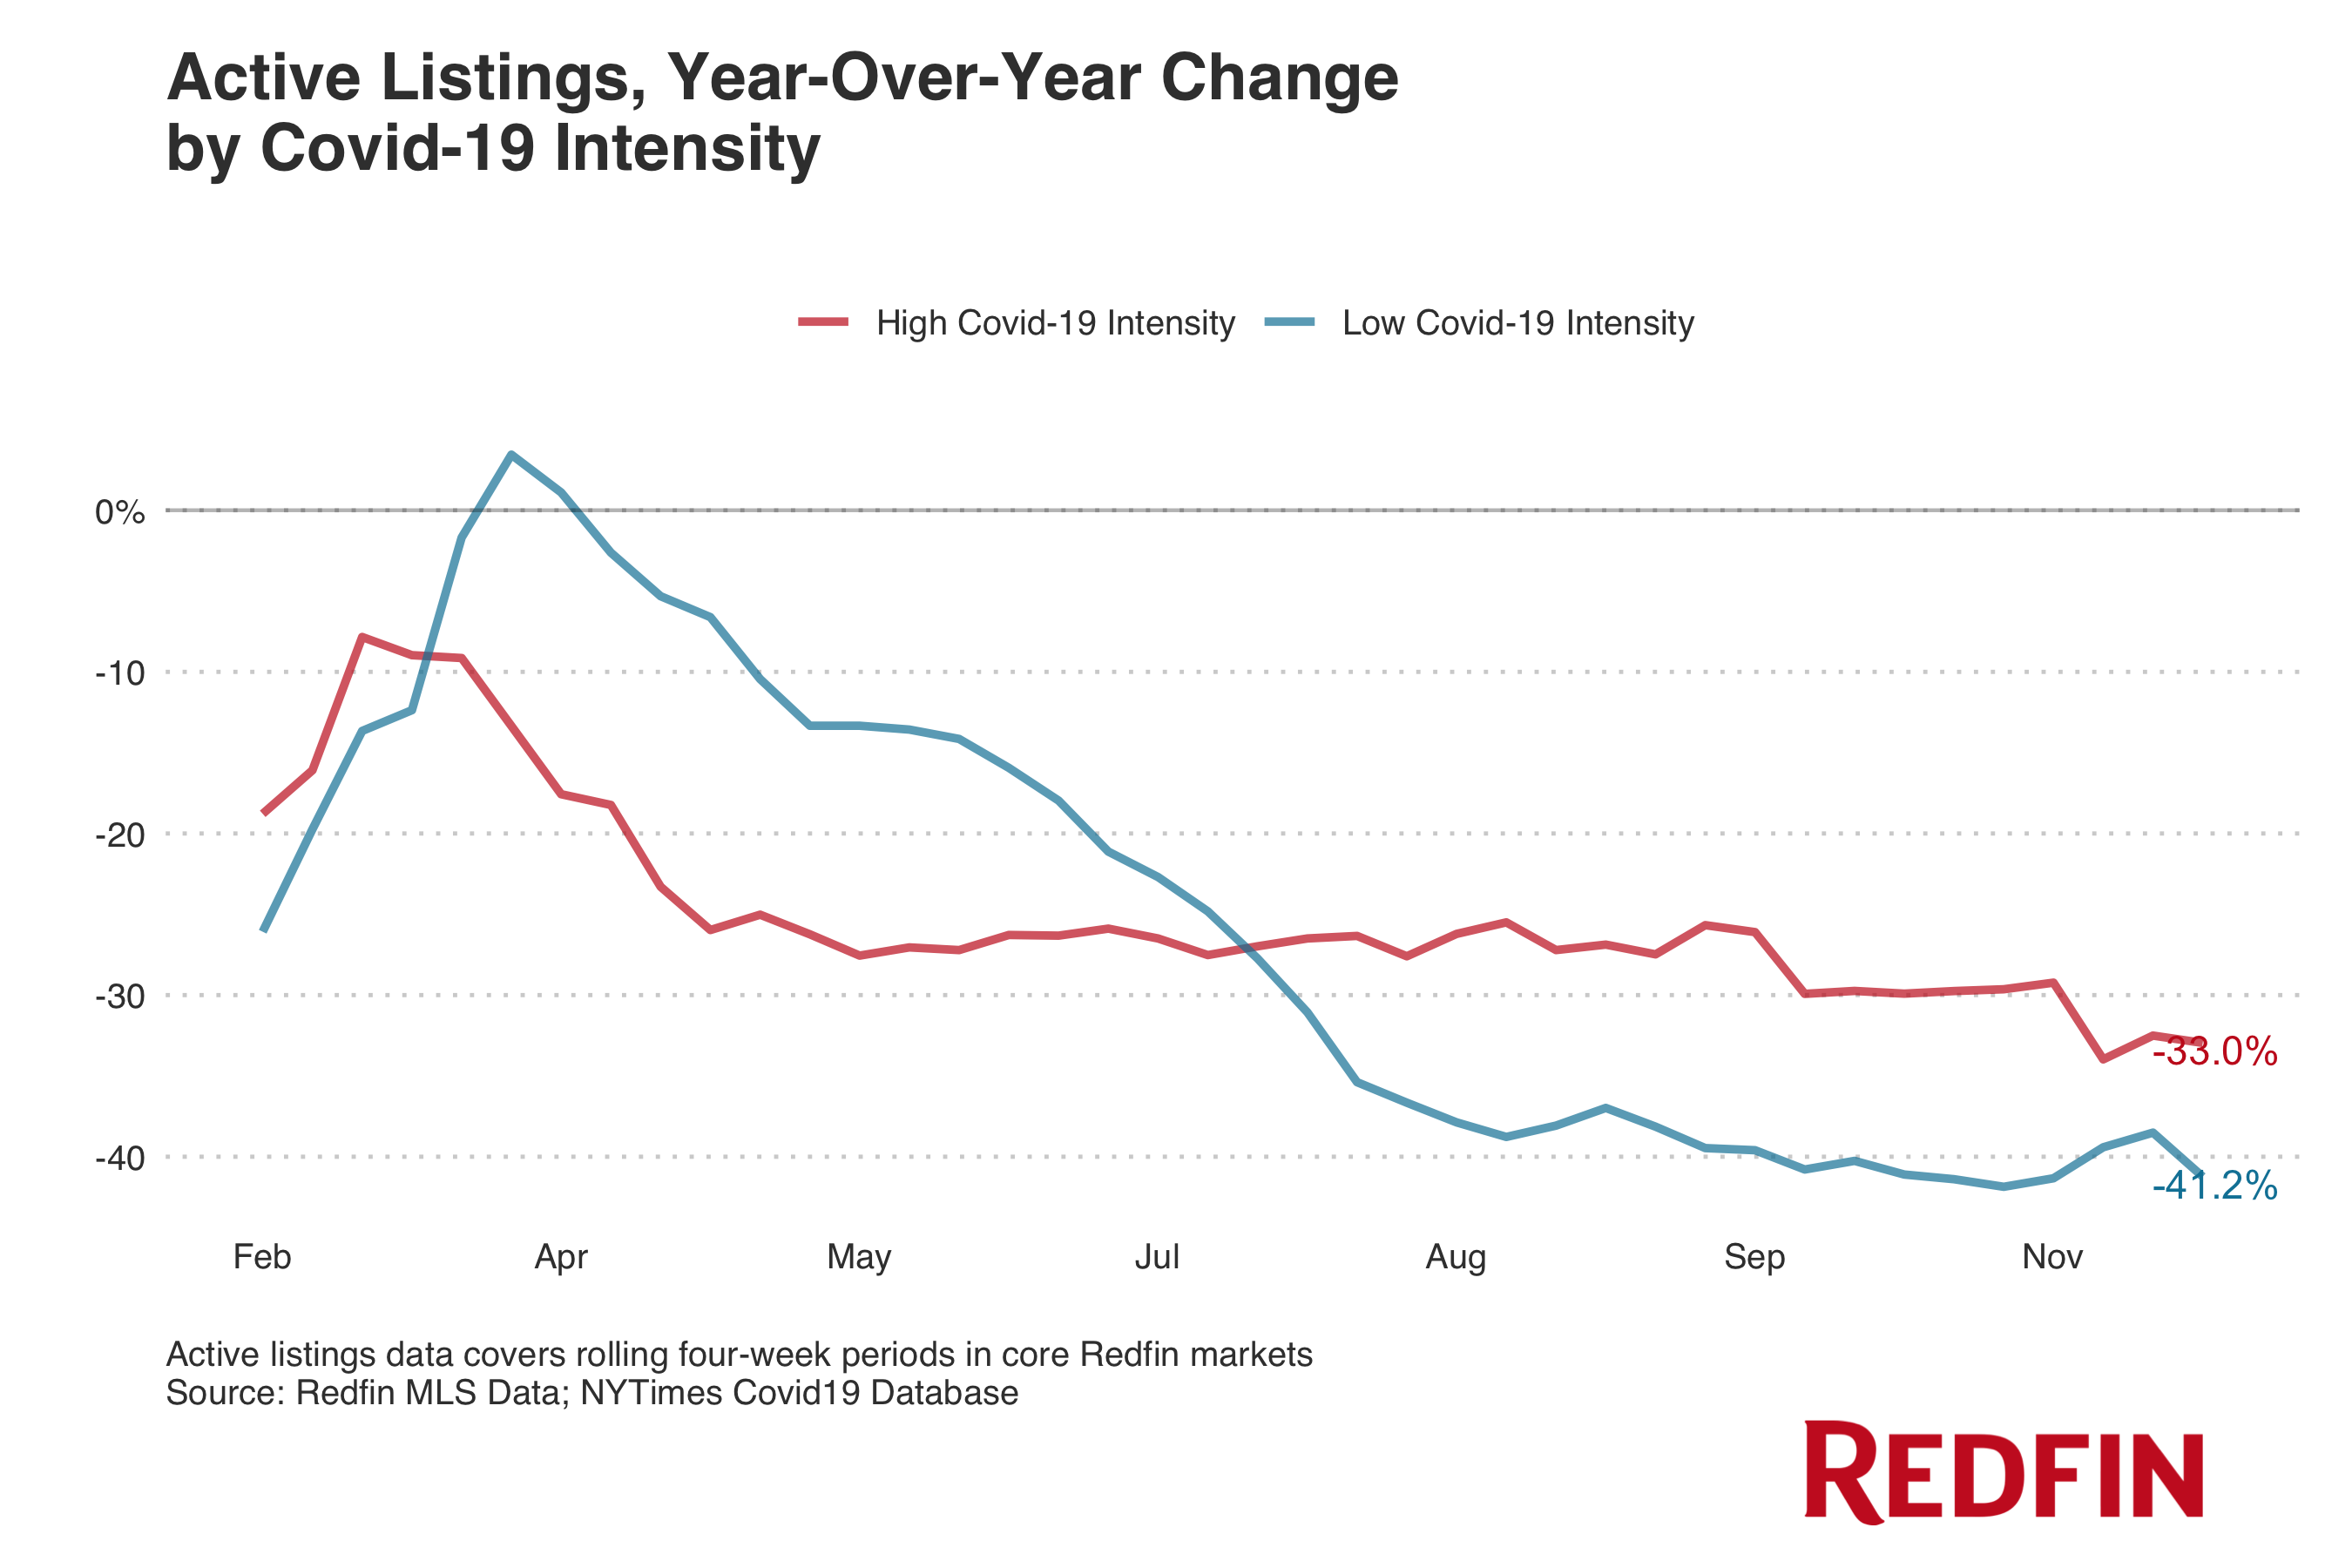
Active listings, a measure of housing inventory, fell 41.2% year over year in counties with low concentrations of Covid-19 cases during the four-week period ending Dec. 1—a more severe drop than the 33.0% decline in counties with high concentrations of Covid-19 cases.

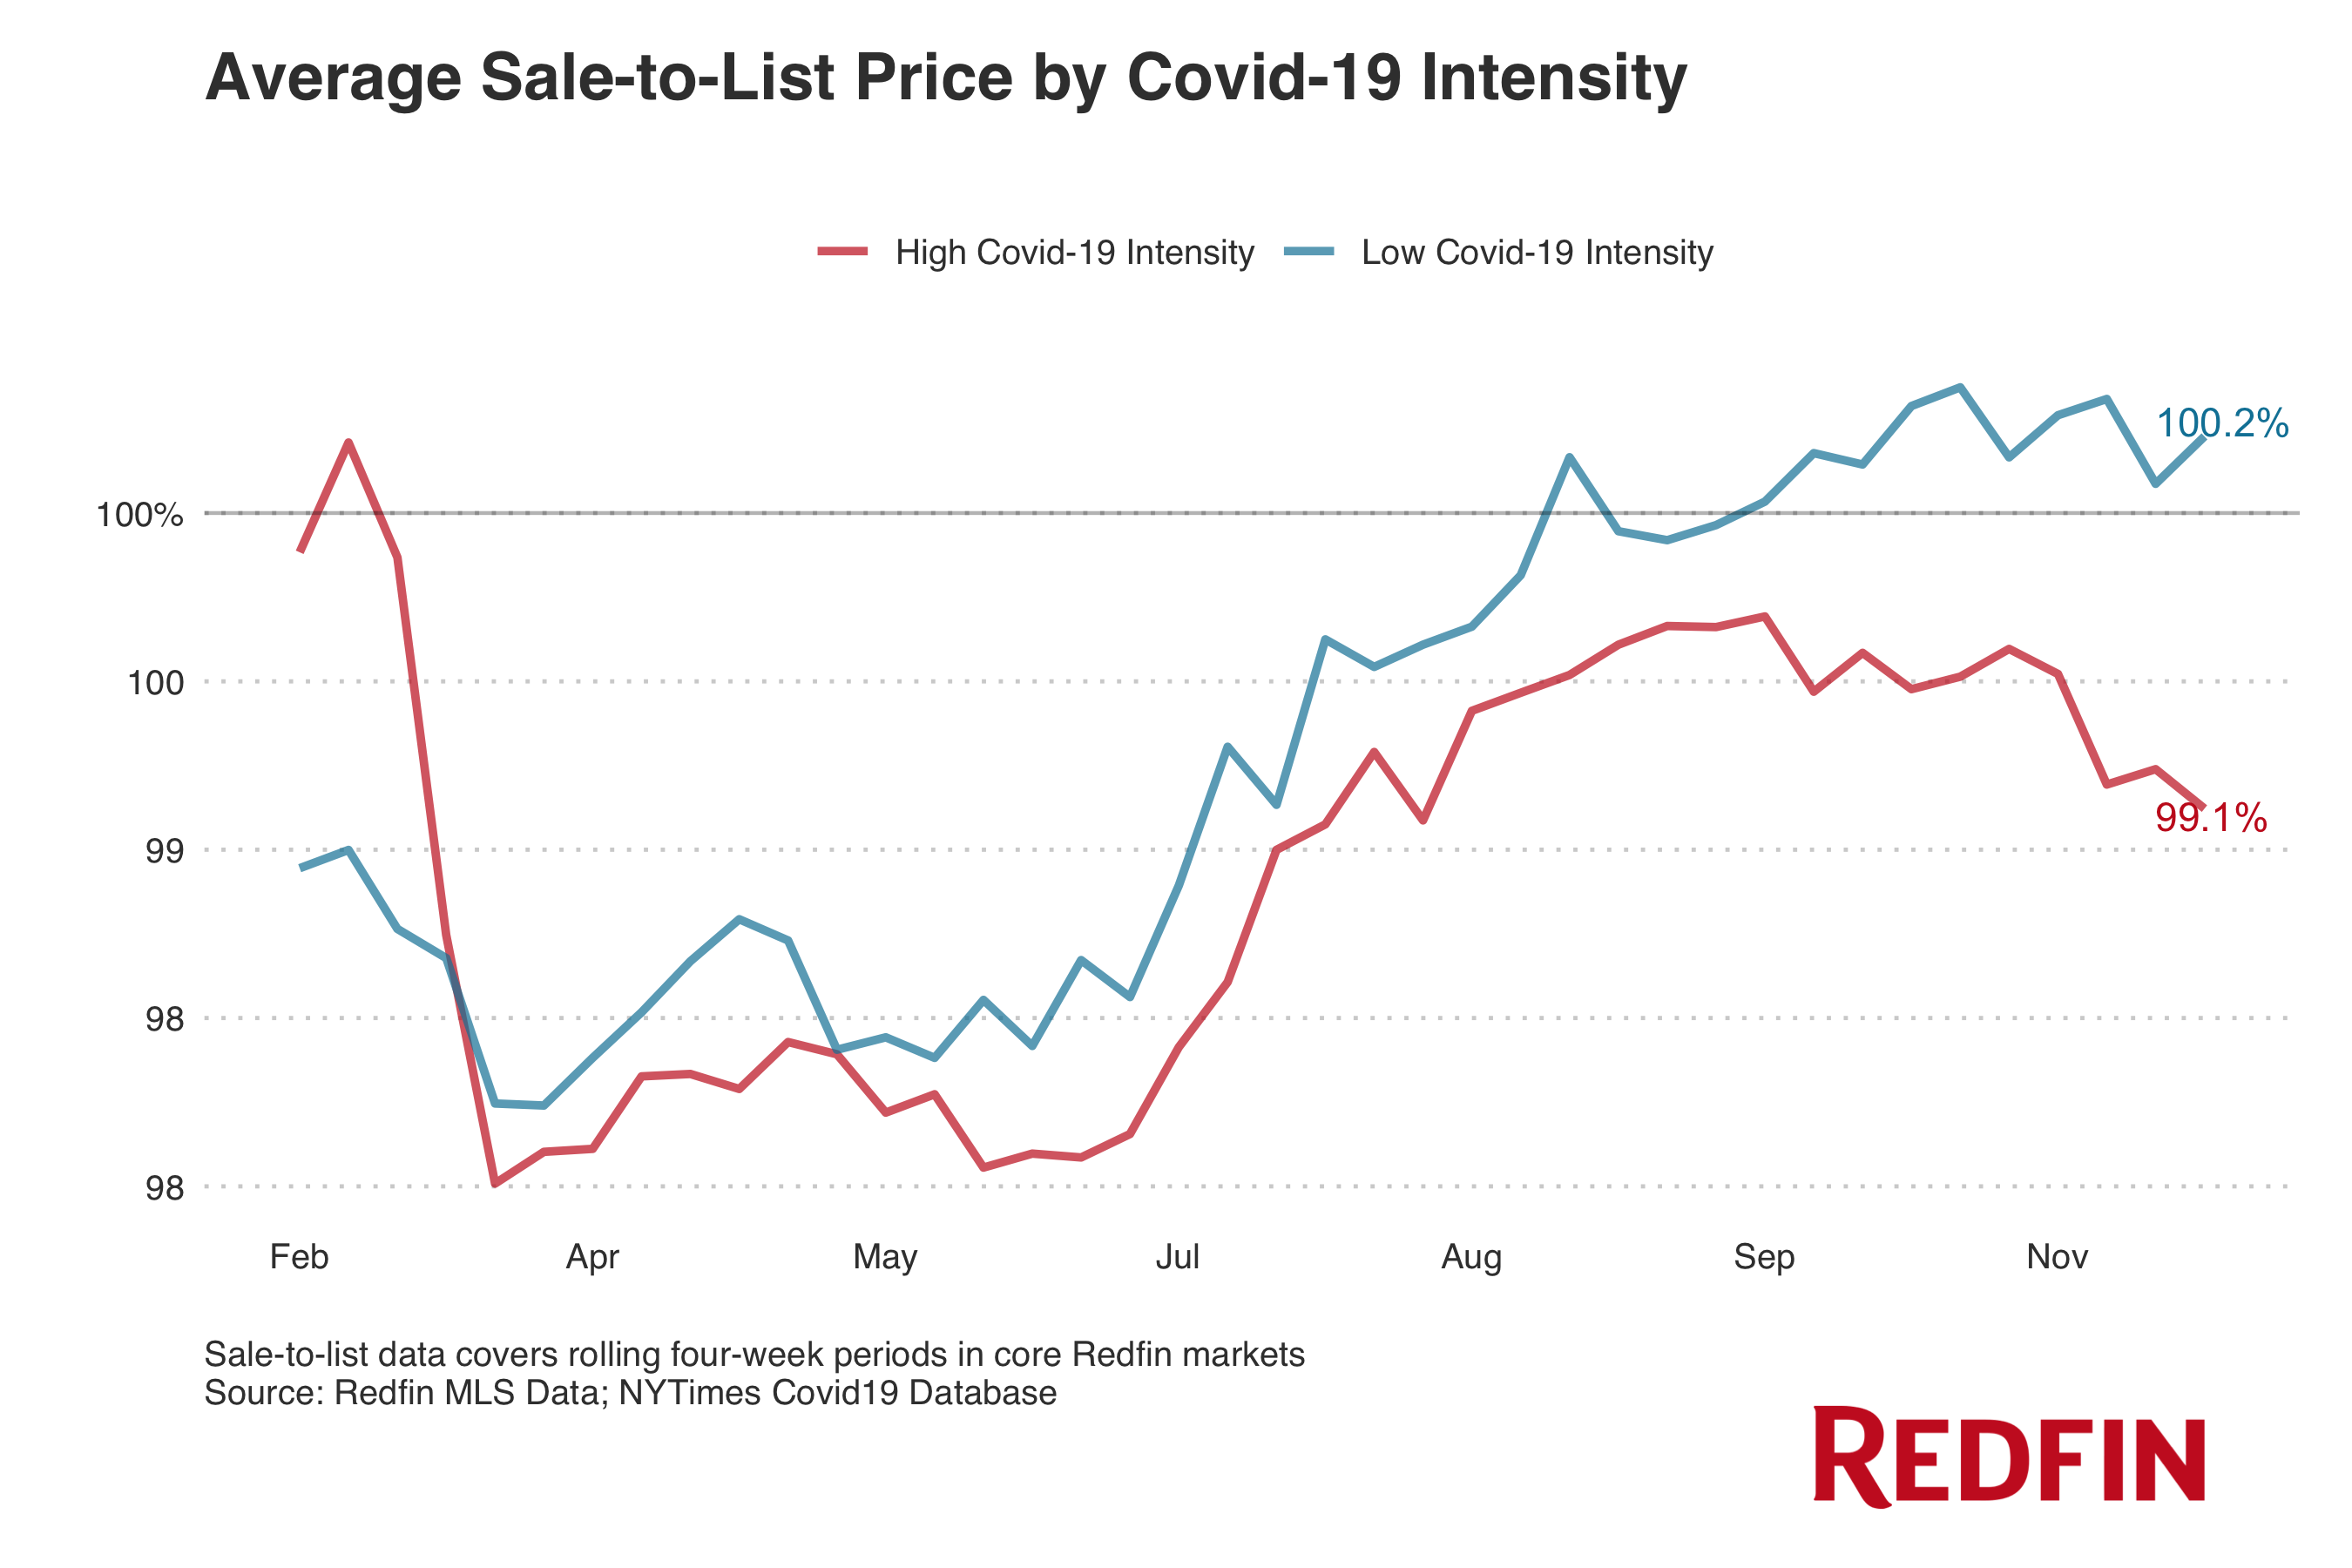
The average sale-to-list price ratio, which measures how close homes are selling to their asking prices, has also been on the rise in places with relatively few coronavirus cases. It clocked in at 100.2% in counties with low concentrations of Covid-19 cases during the period ending Dec. 1, compared with 98.5% a year earlier. In counties with high concentrations of cases, the ratio stood at 99.1%, versus 98% a year earlier. A value above 100% indicates that homes are selling for more than their listing prices, while a value below 100% means that homes are selling for less.

“We’re seeing less demand for homes in places where coronavirus cases are high, which means sellers are more likely to have to drop their prices,” Edwards said. “Typically, homes only sell for more than what they’re listed for in places where there are bidding wars.”
In this analysis, we track housing metrics in counties across 116 U.S. metropolitan areas in the following real estate markets: Austin, Boston, Chicago, Dallas, Denver, Hawaii, Inland Empire, CA, Lake Tahoe, CA, Los Angeles, New Jersey, New York, Orange County, CA, Phoenix, Portland, Sacramento, San Diego, San Francisco, Seattle and the Washington, D.C. area. We analyzed coronavirus case counts from the beginning of the pandemic in March through Dec. 1, 2020. We define a high Covid-19 intensity county as a county where cumulative coronavirus cases per capita are at least 80% higher than the other counties in this analysis, while a low Covid-19 intensity county is one that ranks in the bottom 20% by cumulative cases per capita. County rankings are fluid, meaning one county can be low intensity one week and high intensity the next if cases in a county rise substantially.


