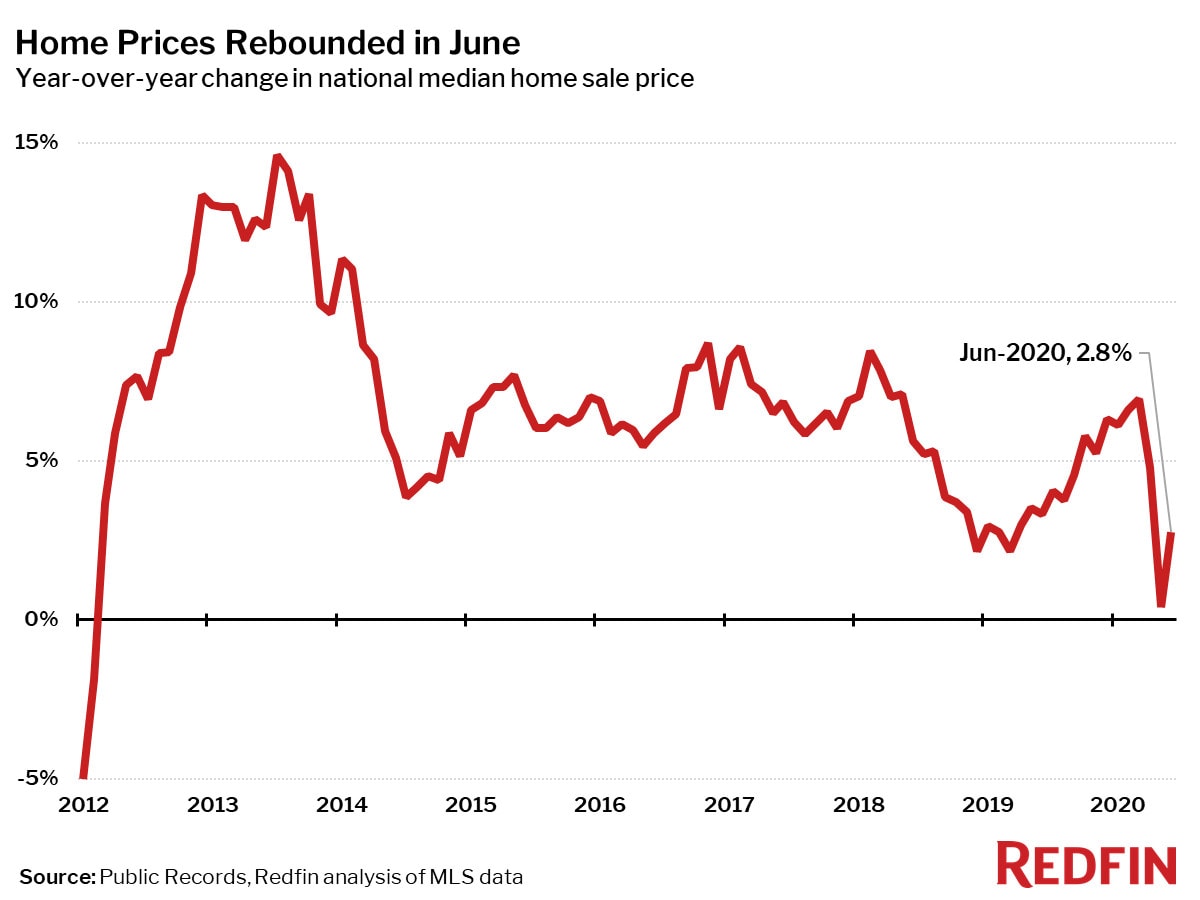
The national median home price rose 2.8% year over year to an all-time high of $311,300 in June, even as new coronavirus cases began to increase again, more than doubling during the month. Home prices typically peak in June each year before trending down slightly through January, but given the pent-up demand that remains following the spring shutdowns, this year has been anything but typical so far, and it’s possible prices may continue to rise further before 2020 is over.
“The coronavirus hasn’t dragged home prices down; in fact we’ve seen just the opposite—prices are rising in spite of the pandemic,” said Brian Walsh, a Redfin agent in Tampa, where the median home price was up 8% year over year in June. “Every house that is the slightest bit cute, fixed-up and priced right gets multiple offers–some up to 10 or 15. The winning offers are almost always all cash with zero contingencies.”
Median prices increased in all but four of the 85 largest metro areas Redfin tracks. The only areas where prices fell were Lake County, IL (-1.9%), New York (-1.9%), Baton Rouge (-1.8%) and Honolulu (-1.2%). Fort Lauderdale (+11.1%), Bridgeport, CT (+11.0%) and Fresno, CA (+10.8%) saw the largest year-over-year increases.
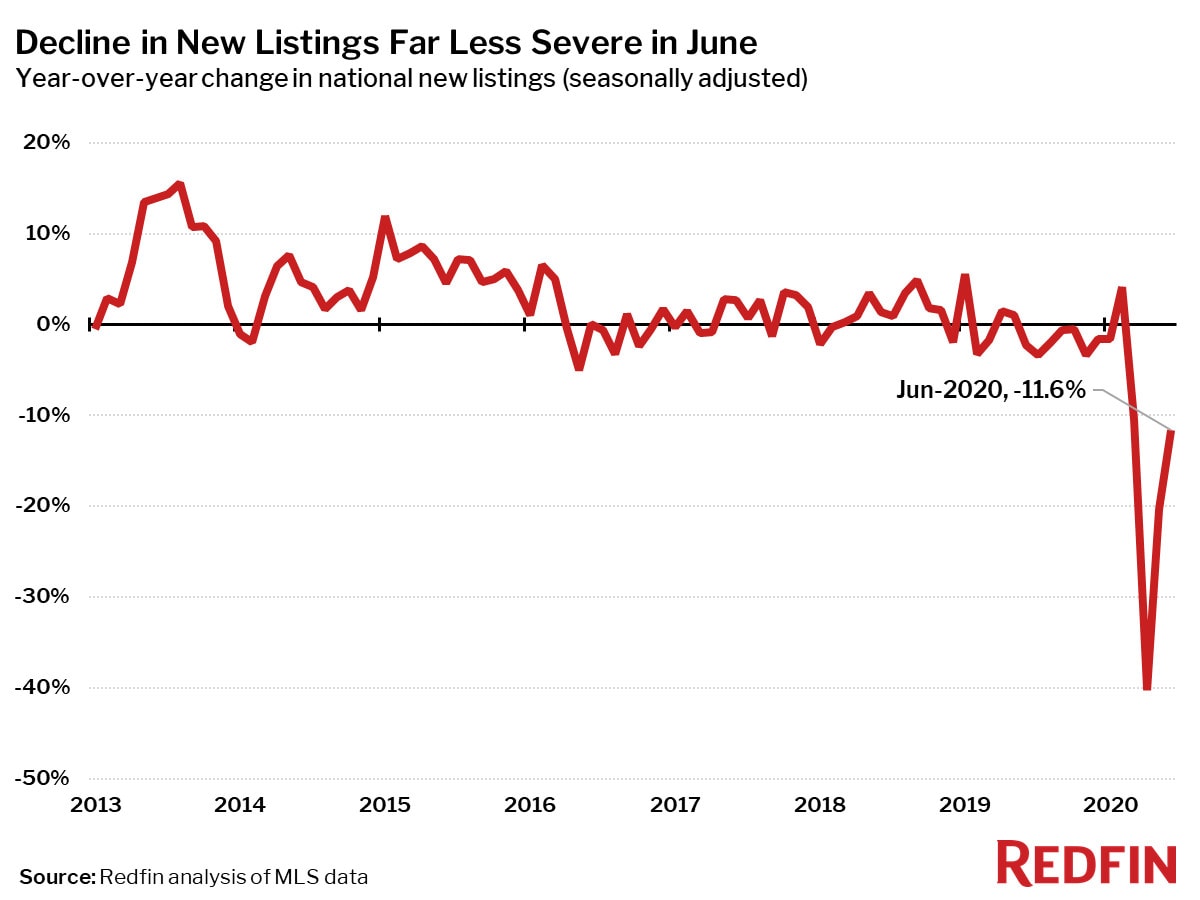
The housing market continued to rebound from the early-spring coronavirus shutdowns, with pending sales up 5.4% year over year, the first increase since February. However, new listings struggled to keep up, falling 11.6%—the fourth month in a row of double-digit declines. As a result, the balance of supply and demand remains strongly tilted in sellers’ favor.
“Pending home sales are a leading indicator of homebuyer activity, and as of early July we’ve begun to see completed home sales rebound back to last year’s levels,” said Redfin lead economist Taylor Marr. “However, there is still plenty of ground to make up as nearly a quarter of a million fewer households have bought a home in the first half of the year compared with the same period last year.”
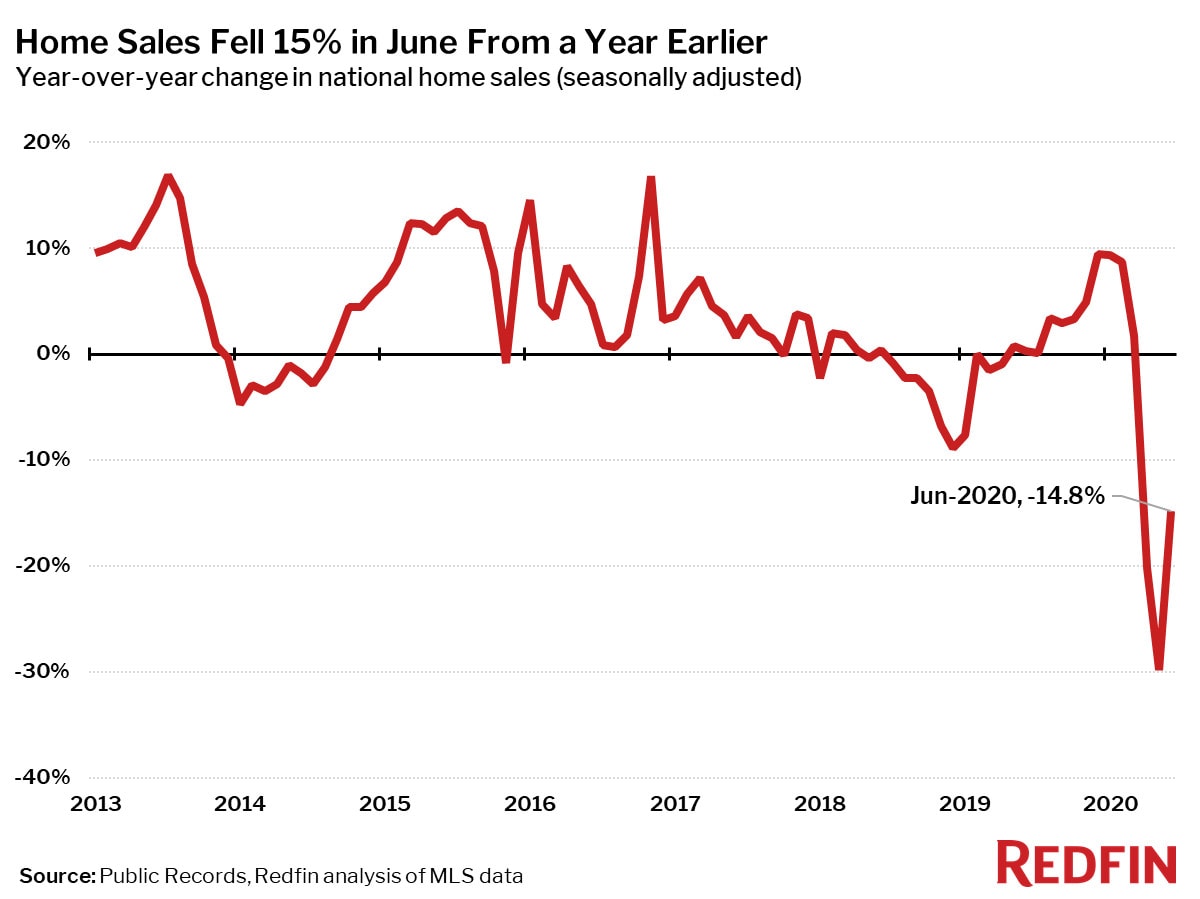
In the month of June, home sales fell 14.8% from a year ago on a seasonally-adjusted basis, a sharp improvement from the 29.8% drop seen in May, but still the third-biggest drop on record going back to 2012 when this data set begins.
Home sales increased in June from a year earlier in 23 of the 85 largest metro areas. This is the first time since April that any of the large metro areas experienced year-over-year gains in home sales. The largest gains in sales were concentrated in Texas, Oklahoma and Louisiana, led by Baton Rouge (+23.3%), Tulsa (+15.5%) and Oklahoma City (+14.2%). There are still plenty of markets where sales are falling though, with the most extreme declines coming in Pennsylvania and New York, led by Allentown, PA (-47.3%), Montgomery County, PA (-46.7%) and Philadelphia (-42.1%).
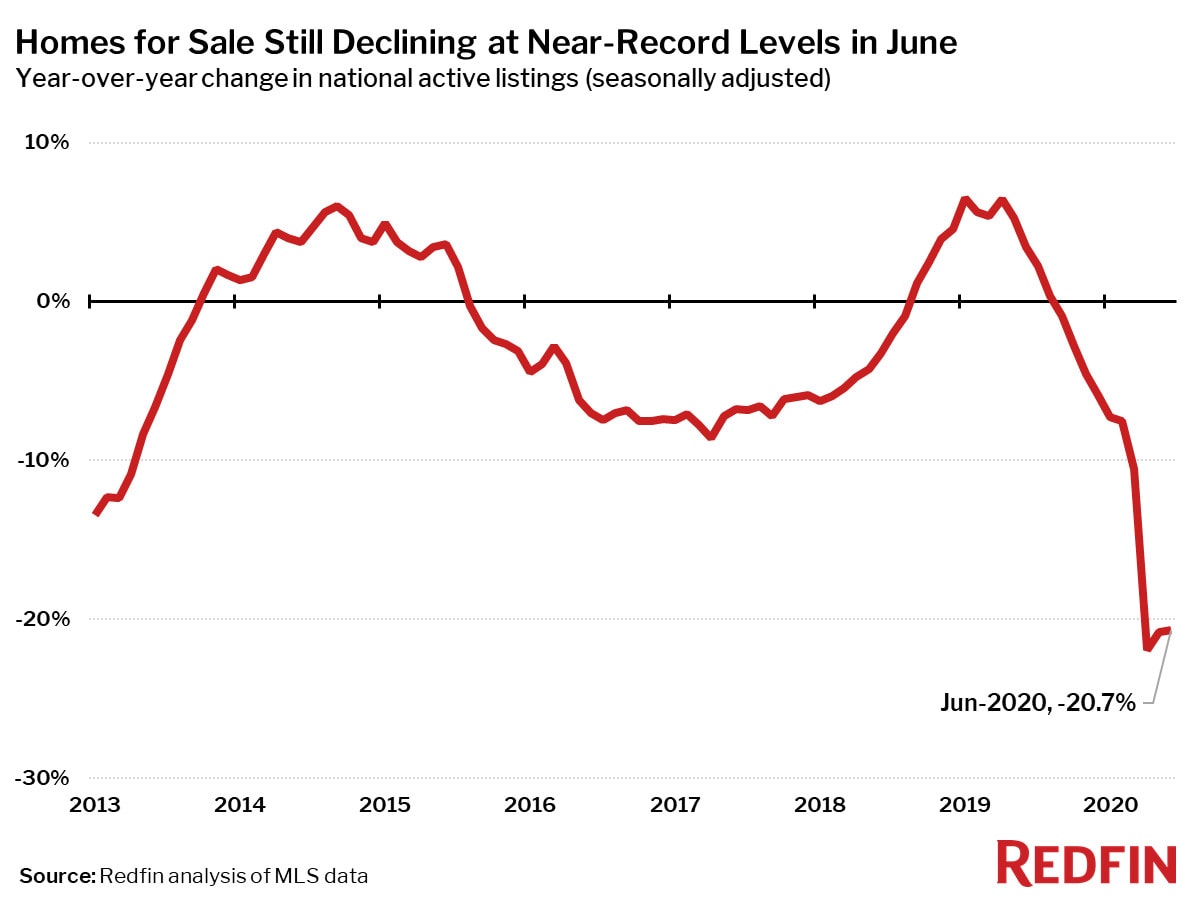
Active listings—the count of all homes that were for sale at any time during the month—fell 20.7% year over year in June, similar to the record declines seen in April and May. This is the 10th-straight month of declines.
San Francisco was the only one of the 85 largest metros tracked by Redfin that posted a year-over-year increase in the count of seasonally-adjusted active listings of homes for sale. Active listings were up 23.8% there.
Compared to a year ago, the biggest declines in active housing supply in May were in Allentown, PA (-53.3%), Tulsa (-53.0%) and Kansas City, MO (-51.6%).
The number of homes for sale remains so far below last year’s level largely because new listings are still down 11.6%, which is much better than the all-time low of -40.2% seen in April, but simply not keeping up with the rate that homes are going off the market as pending sales. Even though home prices are hitting new highs, there are just not enough homeowners willing to sell their homes to balance current homebuying demand.
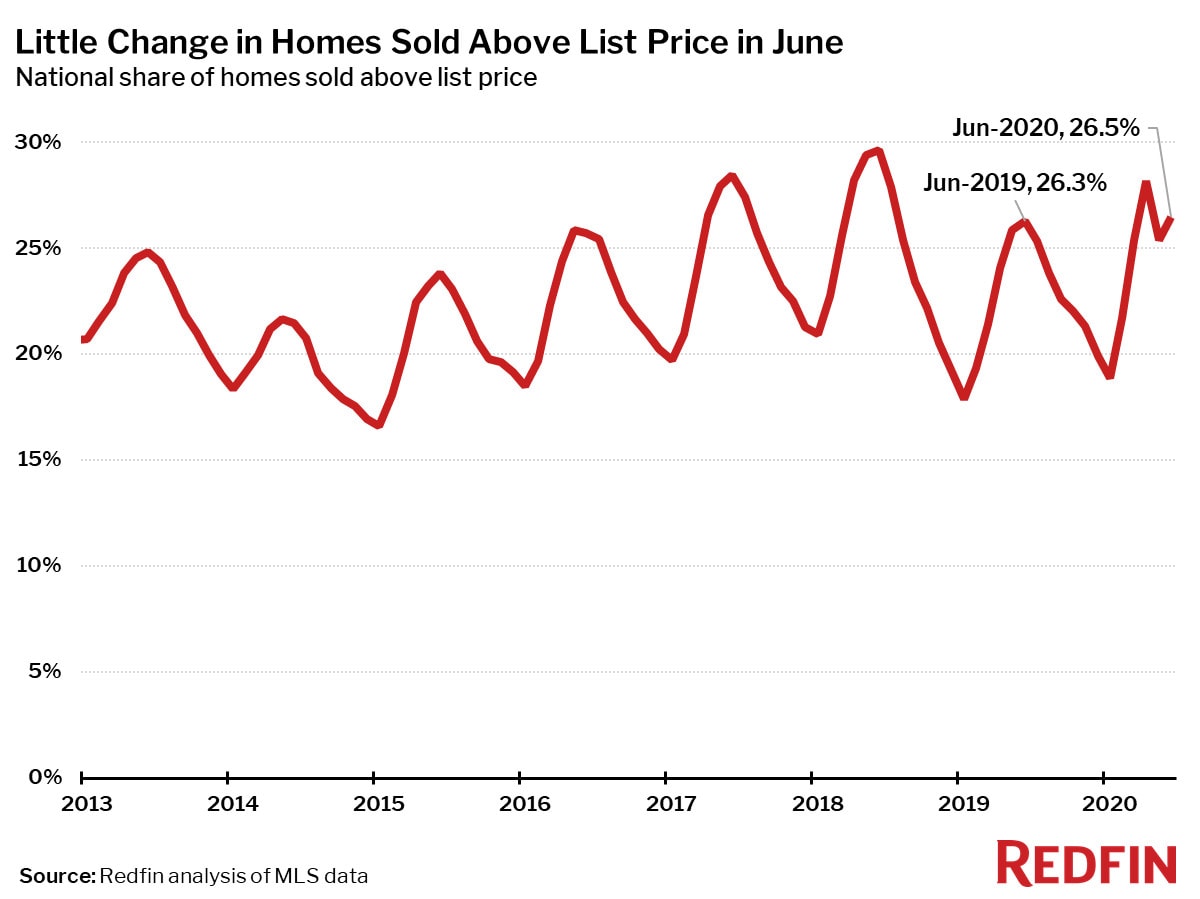
Other measures of competition in the market such as time on market and the share of homes sold above list price continue to paint a picture of a market tilted strongly in sellers’ favor as bidding wars continued unabated in June.
“The market has remained very competitive even as we’re getting towards the late summer months when things usually begin to cool off,“ said Redfin Detroit agent Tony Orlando. “We saw a spike in homebuying immediately after real estate reopened in May, and ever since then we’ve been busy. At this point, homebuyers are assuming that they’ll have to pay a lot more for a home than they initially expected due to all the competition. Today’s record-low mortgage rates help with that some, but the upfront costs are still a tough pill to swallow.”
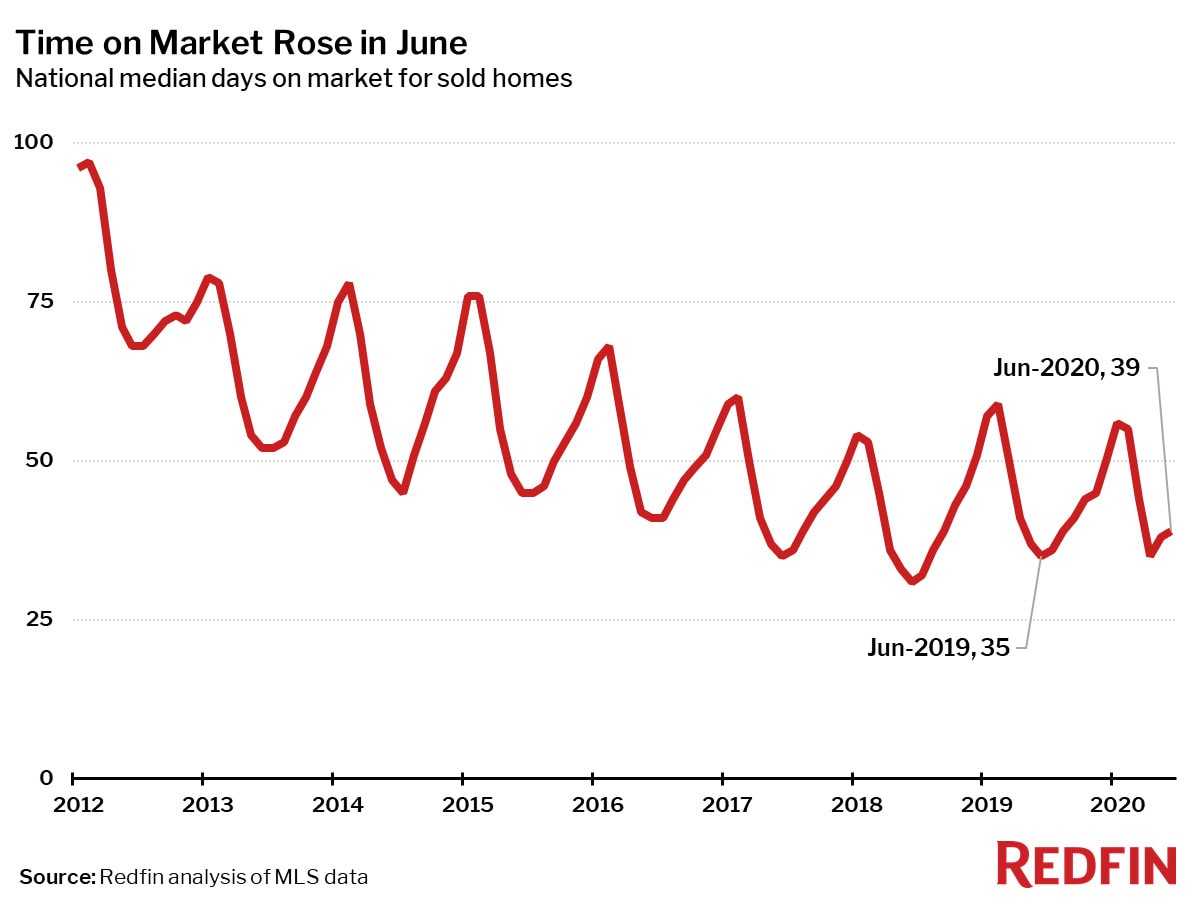
The typical home that sold in June went under contract in 39 days—four days longer than a year earlier, but still five days shorter than the average time on market for homes that sold during June months from 2012-2019. The share of homes that found a buyer within two weeks of listing hit a record high for June at 47.9%—up from just 39.5% in June 2019. The fact that homes spent longer on the market this year than last while a larger share found a buyer within two weeks suggests that the rest of the homes that are selling tend to be those that were on the market a little longer and buyers may be settling on homes they had initially passed up.
The share of homes that sold above list price increased just slightly, rising 0.2 percentage points year over year in June to 26.5%
Competition
Prices
Sales
Inventory
Redfin Estimate
Below are market-by-market breakdowns for prices, inventory, new listings and sales for markets with populations of 750,000 or more. For downloadable data on all of the markets Redfin tracks, visit the Redfin Data Center.


