Demand for second homes hit its highest level in a year in January, with affluent Americans locking in mortgage rates before they increase further. Meanwhile, demand for primary residences was up 42% from pre-pandemic levels.
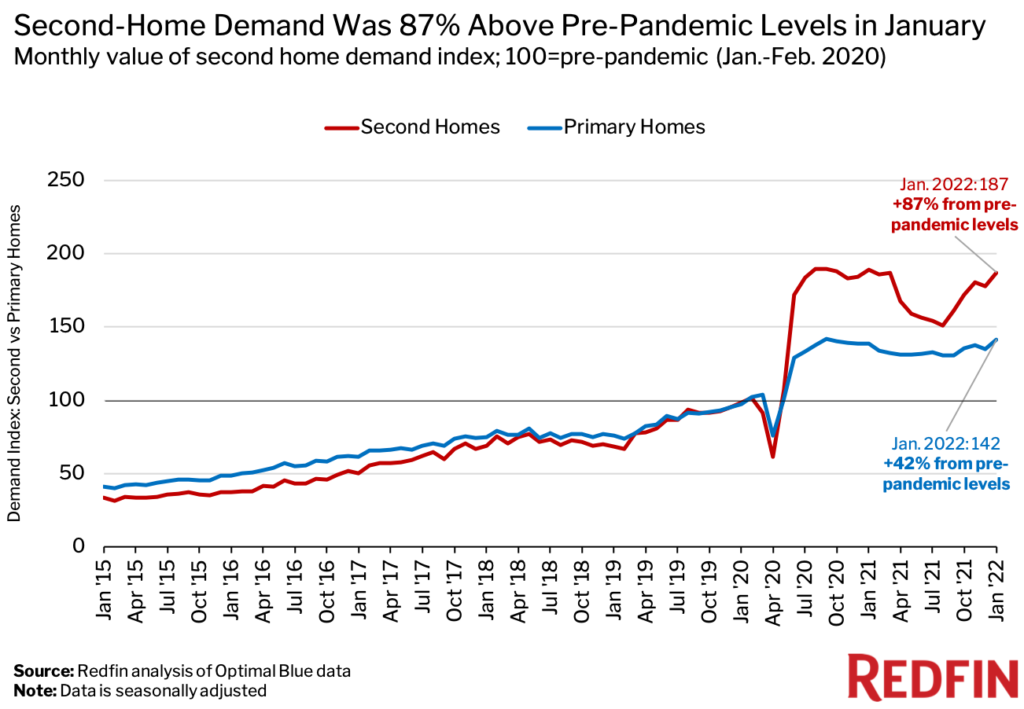
Homebuyer demand for second homes was up 87% from pre-pandemic levels in January, the highest level in a year and just shy of the record 90% gain in September 2020.
Demand for second-home mortgages is outpacing demand for primary residences, which was up 42% from pre-pandemic levels in January. This report uses residential mortgage-rate lock data to measure demand.
Interest in second homes started skyrocketing in mid-2020 as affluent Americans took advantage of remote work and low mortgage rates to escape to and invest in vacation destinations. Demand declined last spring—though it remained well above pre-pandemic levels—before bouncing back in the fall.

“Demand for second homes was strong in January as buyers tried to lock in relatively low mortgage payments,” said Redfin Deputy Chief Economist Taylor Marr. “Mortgage rates surpassed 3.5% in January for the first time since March 2020, encouraging buyers who were on the fence about purchasing a vacation home to commit before rates increase further. While I expect demand for second homes to remain higher than it was before the pandemic, mostly because of remote work, it may fall slightly in the coming year as mortgage rates continue to go up and fees for second-home loans increase.”
Redfin economists predict that the average 30-year fixed mortgage rate will rise to 3.9% over the course of 2022.
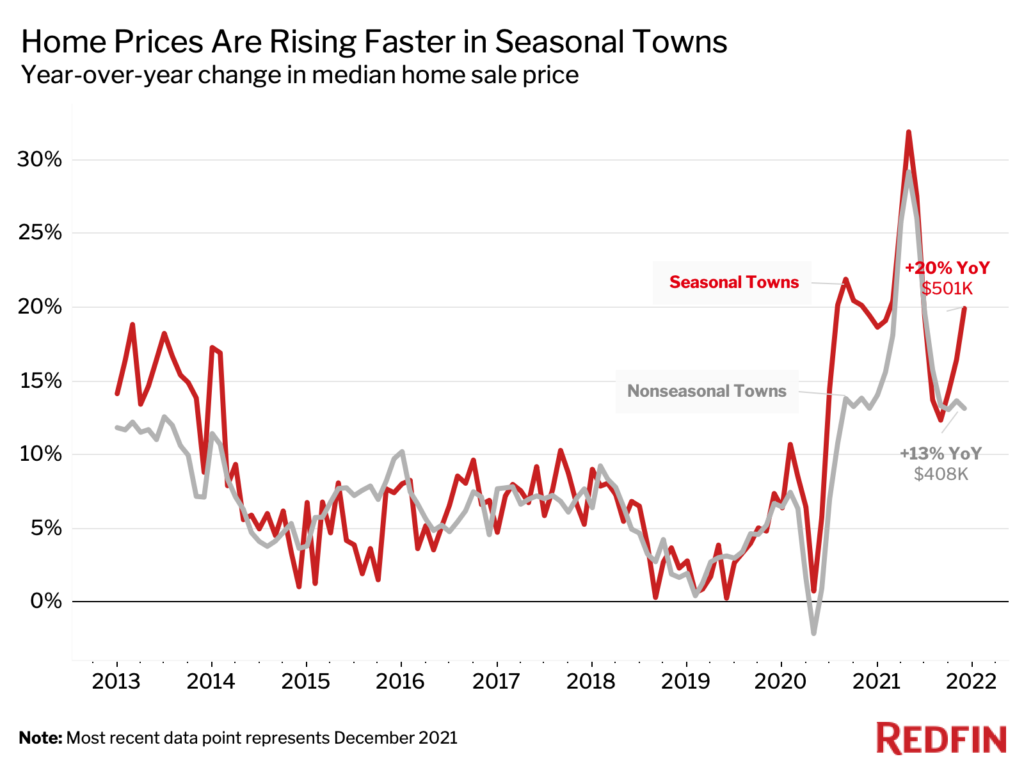
Home prices in seasonal towns—where second homes are often located—are up more than prices in non-seasonal towns. The typical home in a seasonal town sold for $501,000 in December—the most recent month for which data is available—a 20% year-over-year increase. That marks 18 straight months of double-digit price growth.
In non-seasonal towns, the median sale price rose 13% year over year to $408,000. For this analysis, a seasonal town is defined as an area where more than 30% of housing is used for seasonal or recreational purposes according to the 2019 Census.

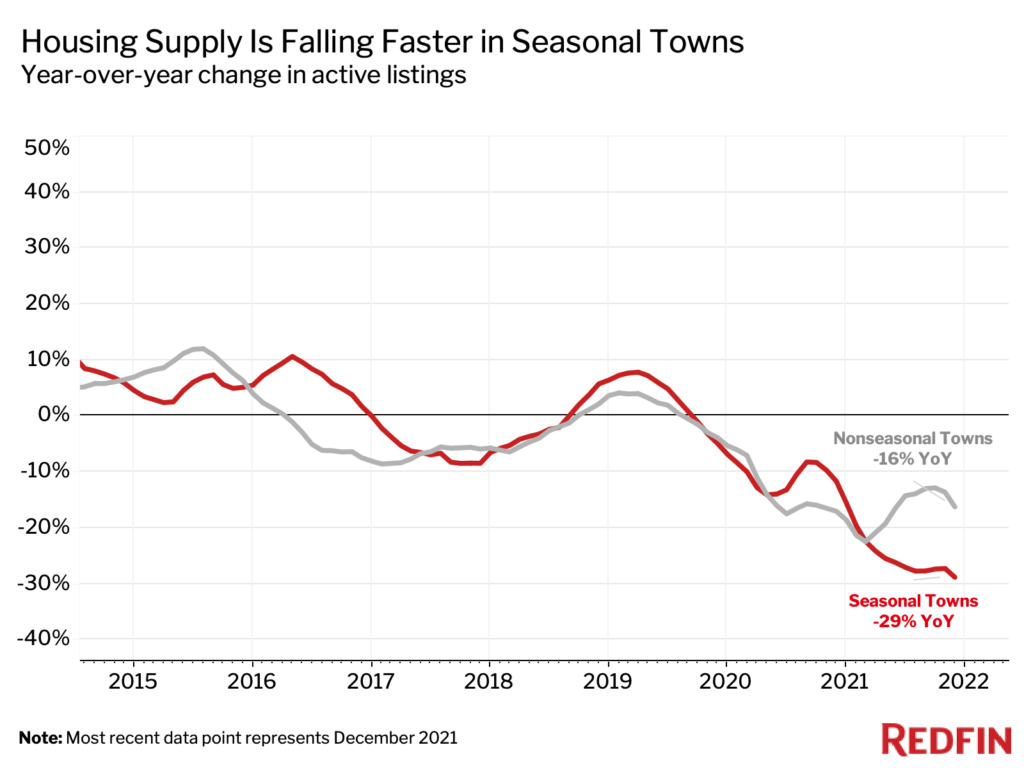
Meanwhile, the number of homes for sale in seasonal towns was down 29% year over year in the fourth quarter, versus a 16% decline in non-seasonal towns. Demand from second-home buyers is likely contributing to the comparatively stronger price growth and tighter inventory in seasonal towns.

Data in the active listings chart above is based on a 3-month moving average.
The data in the first section of this report is from a Redfin analysis of mortgage-rate lock data from real estate analytics firm Optimal Blue. Redfin created a seasonally adjusted index of Optimal Blue’s data to adjust for typical seasonal patterns and allow for simple comparisons of second-home demand during and before the pandemic. We define “pre-pandemic” as January and February 2020 and set the index for that period to 100. Any data point above 100 represents second-home demand that’s above pre-pandemic levels and any data point below 100 represents demand below pre-pandemic levels. This data is subject to revision.
A mortgage-rate lock is an agreement between a homebuyer and a lender that allows the homebuyer to lock in an interest rate on a mortgage for a certain period of time, offering protection against future interest-rate hikes. Homebuyers must specify whether they are applying to secure a mortgage rate for a primary home, a second home or an investment property. Roughly 80% of mortgage-rate locks result in actual home purchases.


