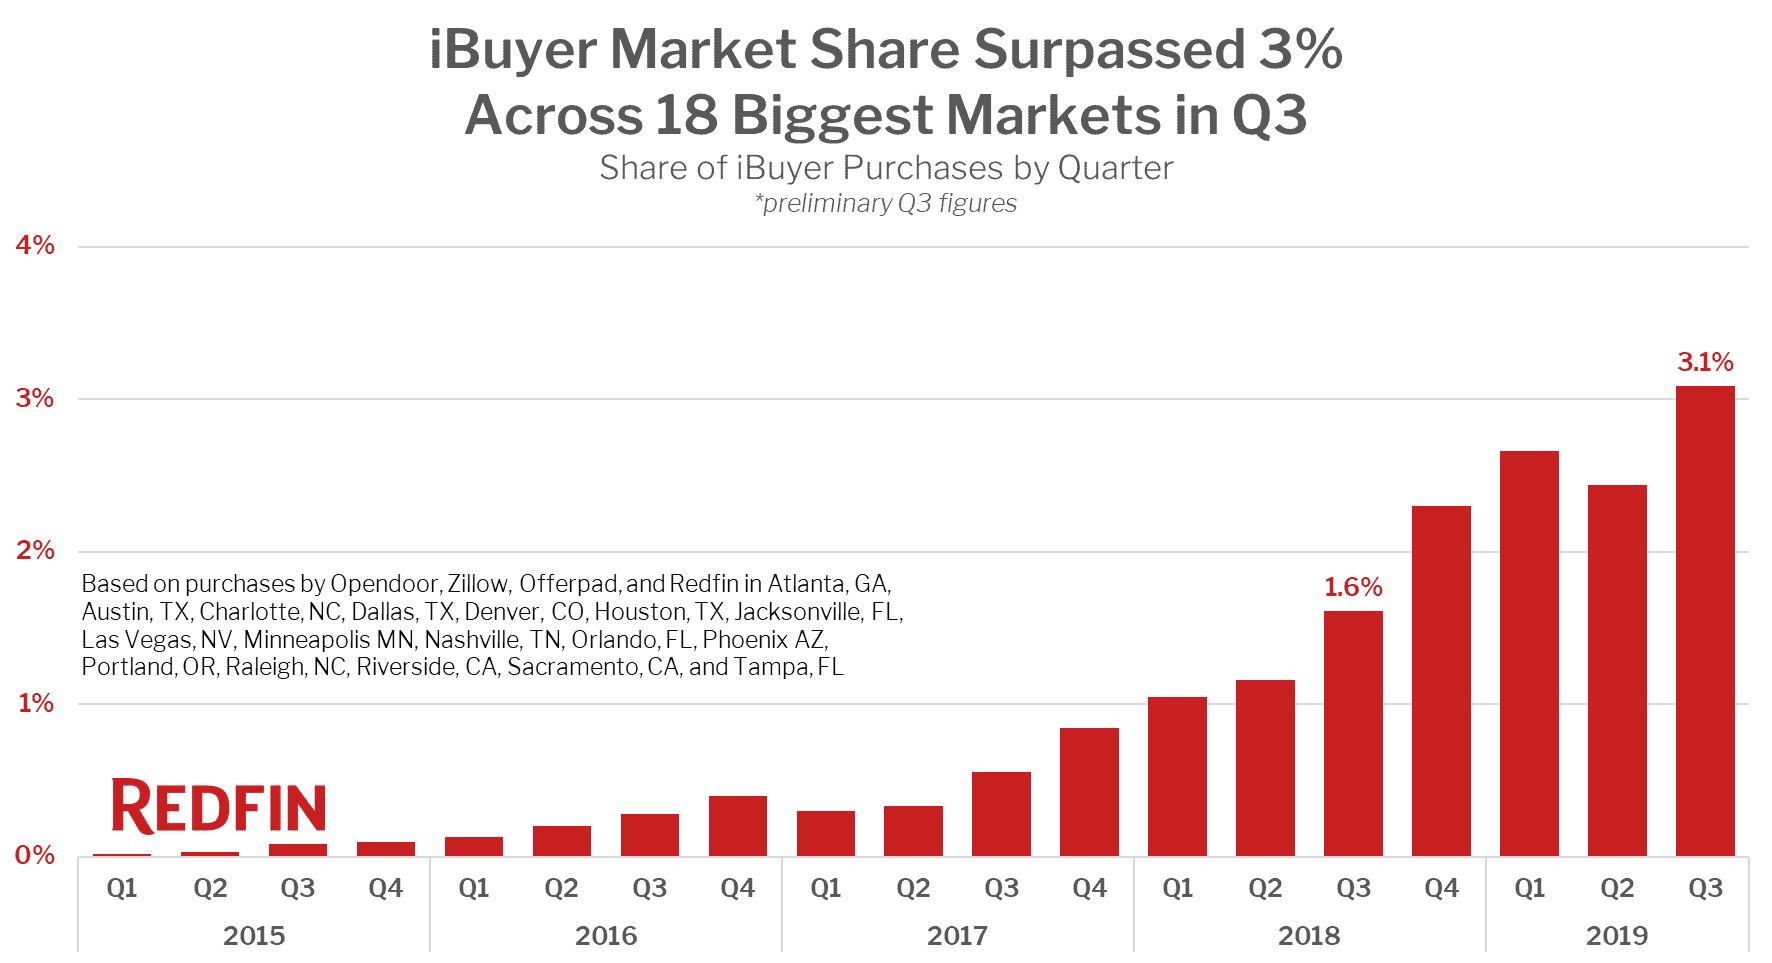
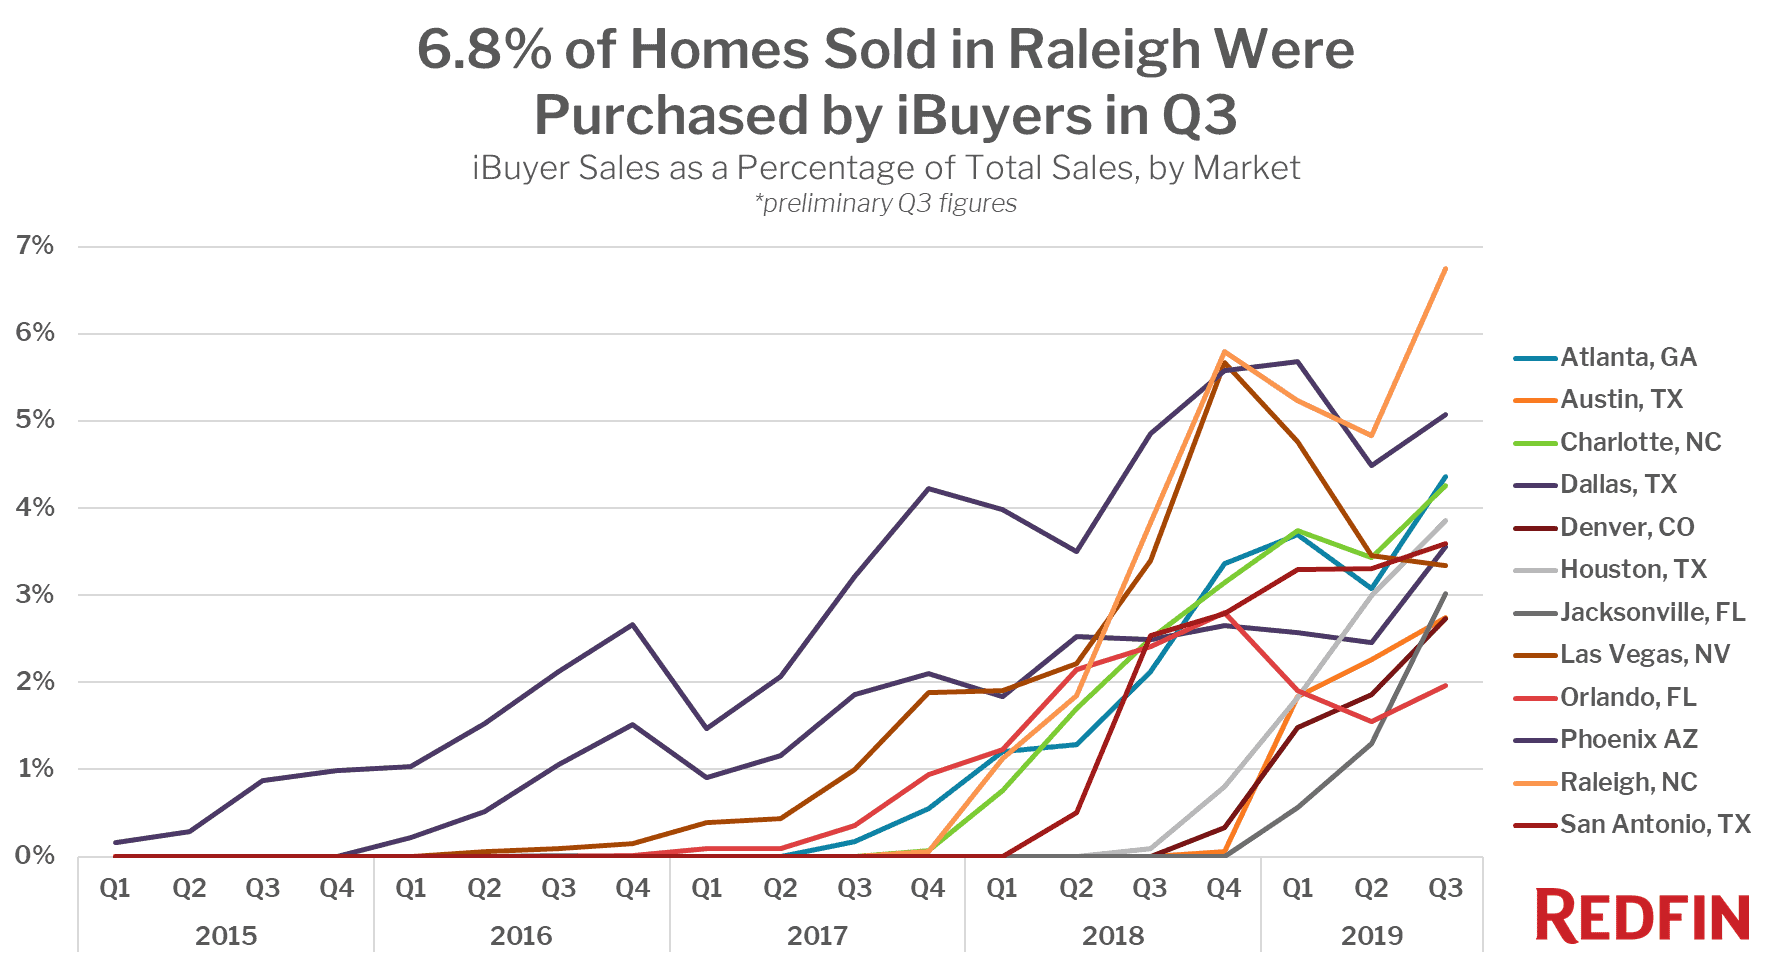
iBuyers purchased 3.1% of the homes sold during the third quarter of 2019 across 18 markets, up from 1.6% a year earlier. The markets where iBuyers had the largest market share, accounting for more than 4% of sales, were Raleigh (6.8%), Phoenix (5.1%), Atlanta (4.4%) and Charlotte (4.3%). That’s based on home sales in the third quarter across the 18 markets iBuyers were most active in, according to a Redfin analysis of the latest public data on home purchases and sales made by the iBuyers Opendoor, Zillow, Offerpad, and RedfinNow.
The term “iBuyer” (short for instant buyer) is used to describe real estate companies, such as Opendoor and RedfinNow, that use technology to make rapid offers to home sellers and then purchase homes in quick, cash transactions. iBuyers charge sellers a higher fee than a typical seller’s agent would for the convenience of helping offload the seller’s property quickly. They then make any necessary improvements and resell these homes swiftly to homebuyers.

“iBuyers are concentrating their efforts in southern markets where both home sales and prices are poised for strong growth,” said Redfin chief economist Daryl Fairweather. “We think that iBuyers are likely to accelerate home sales in these markets. Homeowners who may have been reluctant to sell because they didn’t want to deal with the hassle may be persuaded by the convenience of an iBuyer sale.”
Raleigh unseated Phoenix—birthplace of the iBuyer movement—as the biggest market for iBuyers in the second and third quarters. The combination of affordable homes and a tech-savvy populace (Raleigh is home to Research Triangle Park—a growing tech jobs center) is the perfect combination that allows iBuyers to fuel their rapid growth in the region.

The markets where iBuyers are currently doing the most business are those where the typical home is priced at or below the national median ($313,200 in October). Focusing on these more affordable homes allows iBuyers to purchase more homes with the same amount of money. Affordable homes also tend to sell more quickly than more expensive homes, which allows iBuyers to move through their housing inventory and buy additional homes more quickly, refining their process with every home they sell.
The share of homes purchased by iBuyers increased the most in Houston, where they bought 3.8% of the homes in the third quarter of 2019, up from just 0.1% a year prior. Jacksonville saw the second-largest increase, up to 3.0% from 0%. The third-largest jump was in Raleigh, where iBuyer market share rose to 6.8% up from 3.8%.
iBuyers sold homes for less than the local median price in all but two markets: Riverside, CA and Dallas, where the median price of homes sold by iBuyers ($390,500 and $231,250, respectively) was higher than the local median home sale price ($382,000 and $223,700).
The biggest price gap was in Austin, where the $235,000 median price of homes sold by iBuyers was 27% below the $320,000 metrowide median price. iBuyers sold their homes for 20% or more below the local median price in four other relatively affordable metro areas: Nashville (23%), Charlotte (21%), San Antonio (21%) and Atlanta (20%).
The median price of homes sold by iBuyers fell in 17 of 18 markets in the third quarter compared to a year earlier, despite the overall price of homes increasing in every market. Phoenix was the only market where the median iBuyer sale price was unchanged.
Homes sold by iBuyers in the third quarter stayed on the market for a median of 28 days, down from 74 days a year prior. This large decline is likely due to the iBuyers improving their processes and becoming better at pricing homes to sell. We have not seen a similar decline in days on market in the market as a whole.
Homes sold by iBuyers spent less time on market than the typical home in 13 of the 18 metros.
The three metro areas with the largest difference in days on market were Raleigh (33 days faster), Charlotte (33 days) and Nashville (30 days). The outliers where iBuyer homes took longer to sell were Portland, OR—where iBuyer homes spent 13 more days on the market than the median for the metro—Sacramento (11 days), Minneapolis (6 days), Denver (5 days) and Austin (3 days).
In most of the metro areas where iBuyers sold their homes relatively quickly, the biggest factor was likely the relatively low price of the homes they were selling. Affordable homes are harder to find and tend to have more competition among buyers, so are more likely to sell more quickly.
The mostly hands-off iBuyer model also has other features that help them sell their homes more quickly, according to Phoenix Redfin agent Heather Mahmood-Corley, who explained that “the homes iBuyers are selling are definitely attractive to many homebuyers since they’re vacant and can be viewed any time.”
Another reason these homes may be selling so fast is the aggressive strategies some iBuyers are experimenting with.
“iBuyers listing their homes for sale in Phoenix are starting to sweeten the pot with incentives like homebuyer credits—sometimes as high as $4,000—for people who go without a buyer’s agent and use the iBuyer’s preferred mortgage and title companies,” said Mahmood-Corley. “However, even with the lure of extra incentives, most homebuyers prefer to have the guidance of an agent to help them through their purchase.”
To identify purchases made by iBuyers, we analyzed public records data of home sales across all the markets that Redfin covers. When an iBuyer purchases a home, public records usually show the buyer as an entity (e.g., corporation, partnership, or LLC), and each iBuyer can have multiple purchasing entities. Our analysis identifies these entities to the extent possible, and we connect them to iBuyers as they appear in the records, but sometimes there are homes that we don’t realize an iBuyer purchased until we see it hit the market for sale. When that happens we update our data to include all purchases by the entity on record for that home, which can cause our iBuyer share numbers for previous periods to increase.
In determining market share, we included all currently known iBuyer purchases as the numerator and all single-family, condo, and townhome sales, excluding new construction and bank-owned homes, as the denominator. While we collected data from many more markets across the country, for this report we only focused on the 18 metro areas where iBuyer purchases accounted for at least 1% of the market in the third quarter of 2019.
Our data showed transactions from the following iBuyers in the 18 metro areas in the study.


