

Residential real estate deals are falling through at the highest rate in almost a year as high mortgage rates give homebuyers sticker shock.
Nationwide, nearly 60,000 home-purchase agreements were canceled in August, equal to 15.7% of homes that went under contract that month. That’s up from 14.3% a year earlier and marks the highest percentage since October 2022, when mortgage rates surpassed 7% for the first time in two decades.
The average interest rate on a 30-year-fixed mortgage was 7.07% in August. At one point last month, it hit 7.23%—the highest since 2001—sending the typical homebuyer’s monthly payment up significantly from last year.
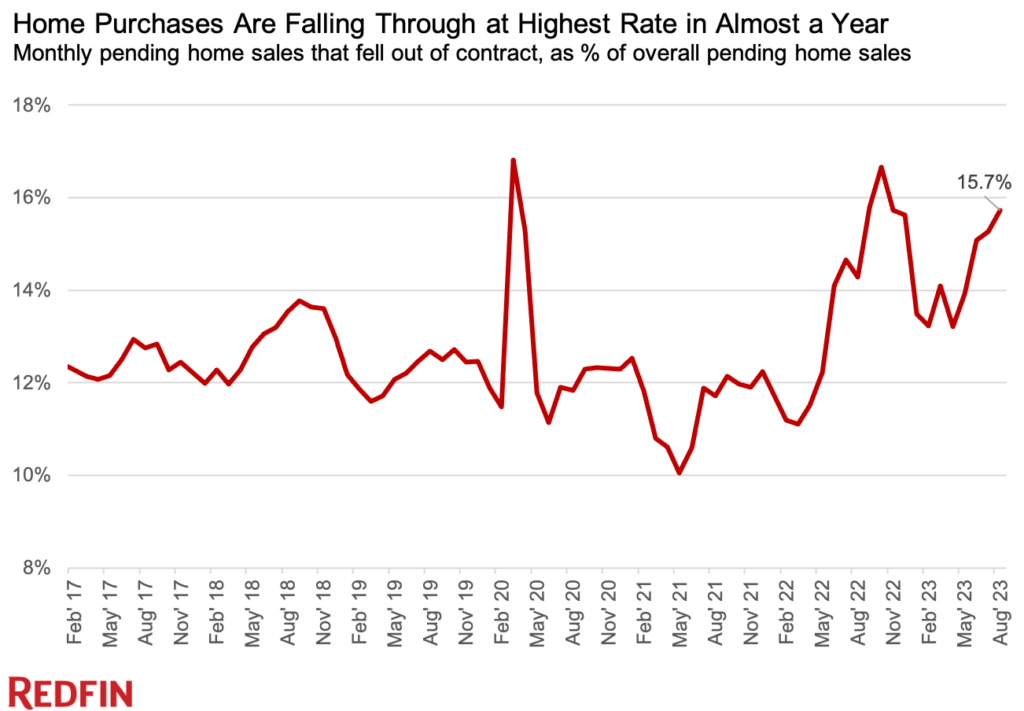
“I’ve seen more homebuyers cancel deals in the last six months than I’ve seen at any point during my 24 years of working in real estate. They’re getting cold feet,” said Jaime Moore, a Redfin Premier real estate agent in Reno, NV. “Buyers get sticker shock when they see their high rate on paper alongside extra expenses for maintenance, repairs and closing costs. Many of them would rather back out, even if it means losing their earnest money. A lot of sellers are also willing to let buyers slip away because they don’t want to concede to repair requests.”
Scroll to the bottom of this report to find the deal cancellation rate for the 50 most populous U.S. metropolitan areas, along with other local insights.
Note: Data is subject to revision
The median U.S. home sale price rose 3% year over year to $420,846 in August, the largest annual increase since October 2022, and was little changed (-0.2%) from a month earlier. It was 2.8% below the May 2022 record high of $432,780.
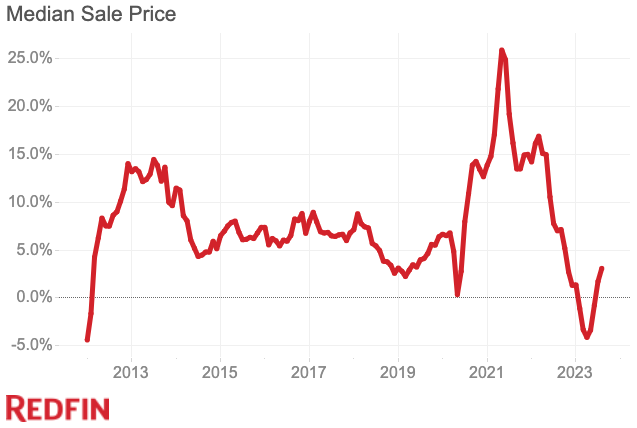
Activity in the housing market is sluggish due to rising mortgage rates, but prices remain high because the buyers who are out there are competing for a limited number of homes.
“Home prices will likely remain elevated for the foreseeable future,” said Redfin Economics Research Lead Chen Zhao. “The Federal Reserve still has more work to do in its battle against inflation, which means mortgage rates are unlikely to come down anytime soon. As long as rates remain high, homeowners will be reluctant to sell. And that lack of homes for sale will keep prices high because it means buyers are duking it out for a limited supply of houses.”
Home prices also posted a year-over-year gain in August due to the “base effect” from a year earlier; in August 2022, prices had recently started descending from their record high, which is contributing to the size of year-over-year increases we’re seeing now.
Pending sales declined 0.6% from a month earlier in August on a seasonally-adjusted basis, and fell 18.1% year over year. While they’re no longer falling as rapidly as they were earlier in 2023, pending sales remain below pre-pandemic levels. They’ve been hovering below 400,000 since the end of last year, compared with nearly 500,000 just before the pandemic.
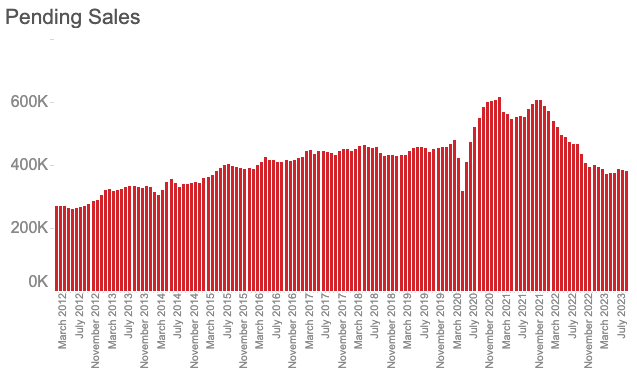
Pending sales have stabilized as the initial shock of elevated mortgage rates has moved further into the rearview mirror, but high housing costs are still keeping many buyers on the sidelines.
New listings rose 0.8% from a month earlier in August—the second small uptick on a seasonally adjusted basis following nearly a year’s worth of declines—and were down 14.4% year over year. 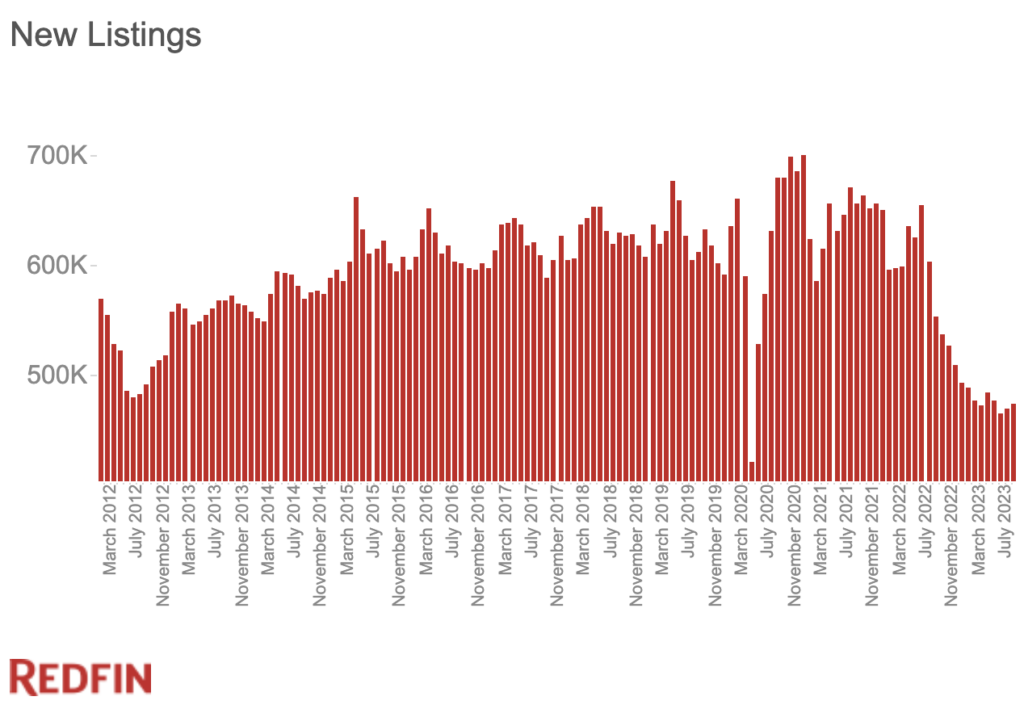
“New listings have likely bottomed out,” Zhao said. “Most of the homeowners who feel handcuffed by high rates have already made the decision not to sell. That means many of today’s sellers are putting their homes on the market because they have to, in some cases due to divorce, family emergencies or return-to-office policies.”
Still, the total number of homes for sales hit a record low in August, falling 1.1% month over month on a seasonally adjusted basis and 20.8% year over year—the largest annual decline since June 2021.
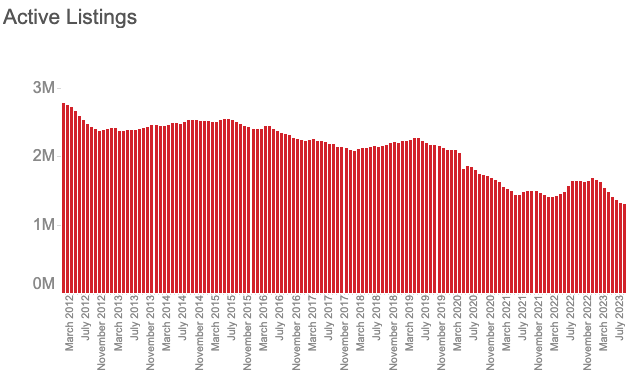
Housing supply is at an all-time low because homeowners feel locked in to their low mortgage rates; for many, selling their home and buying a new one would mean taking on a much higher monthly payment.
Data in the bullets below came from a list of the 91 U.S. metro areas with populations of at least 750,000. Select metros may be excluded from time to time to ensure data accuracy. A full metro-level data table can be found in the “download” tab of the dashboard embedded below or in the monthly section of the Redfin Data Center. Refer to our metrics definition page for explanations of metrics used in this report. Metro-level data is not seasonally adjusted.
Data below came from a list of the 50 most populous metro areas. Please note that homes that fell out of contract during a given month didn’t necessarily go under contract the same month. For example, a home that fell out of contract in August could have gone under contract in July.
