

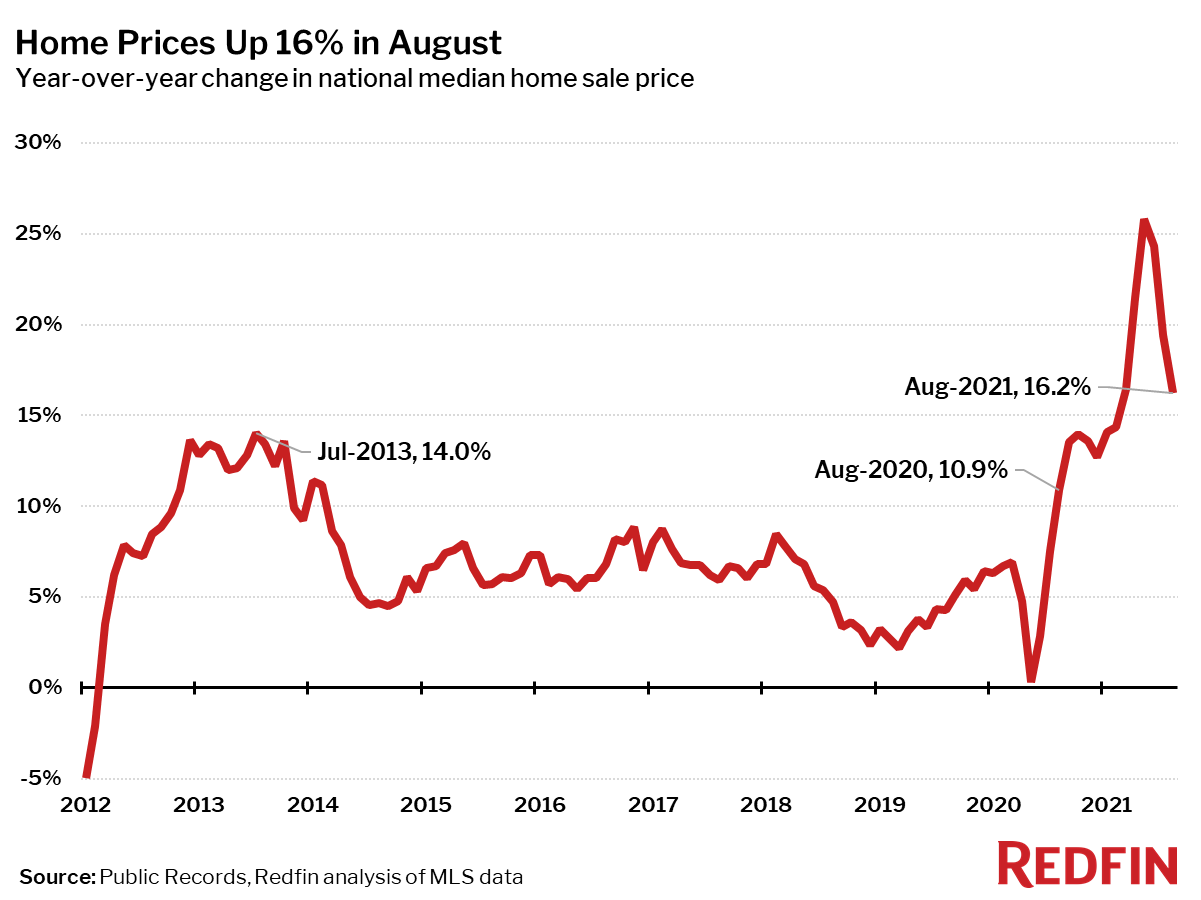
The median price of homes sold in August was $380,271, up 16% from a year earlier, the lowest growth rate since February. August marked the 13th consecutive month of double-digit price gains.
“When it comes to home prices in this market, what goes up stays up,” said Redfin Chief Economist Daryl Fairweather. “That’s especially true in the Sun Belt; home prices are up more than 20% from last year in Austin and Phoenix. Even with these steep increases, homes in these areas are still relatively affordable, so these and other hot migration destinations are going to continue to attract homebuyers from the coasts. As workers change jobs en masse and enhanced unemployment benefits come to an end, we could see even more households relocate for affordability in the coming months.”
Median sale prices increased from a year earlier in all but two of the 85 largest metro areas Redfin tracks: Milwaukee, WI (-1.6%) and Bridgeport, CT (-1.1%). It is worth noting that both of these metro areas had already seen significant price gains a year ago, with prices up 14% and 30% respectively in August of 2020, compared to a 11% gain nationally. So they may have overheated last year, and prices have moderated since, leading to a slight decline in the latest data.
The largest price increases in August 2021 were in Austin, TX (+36%), followed by Phoenix (+25%) and Salt Lake City (+24%).
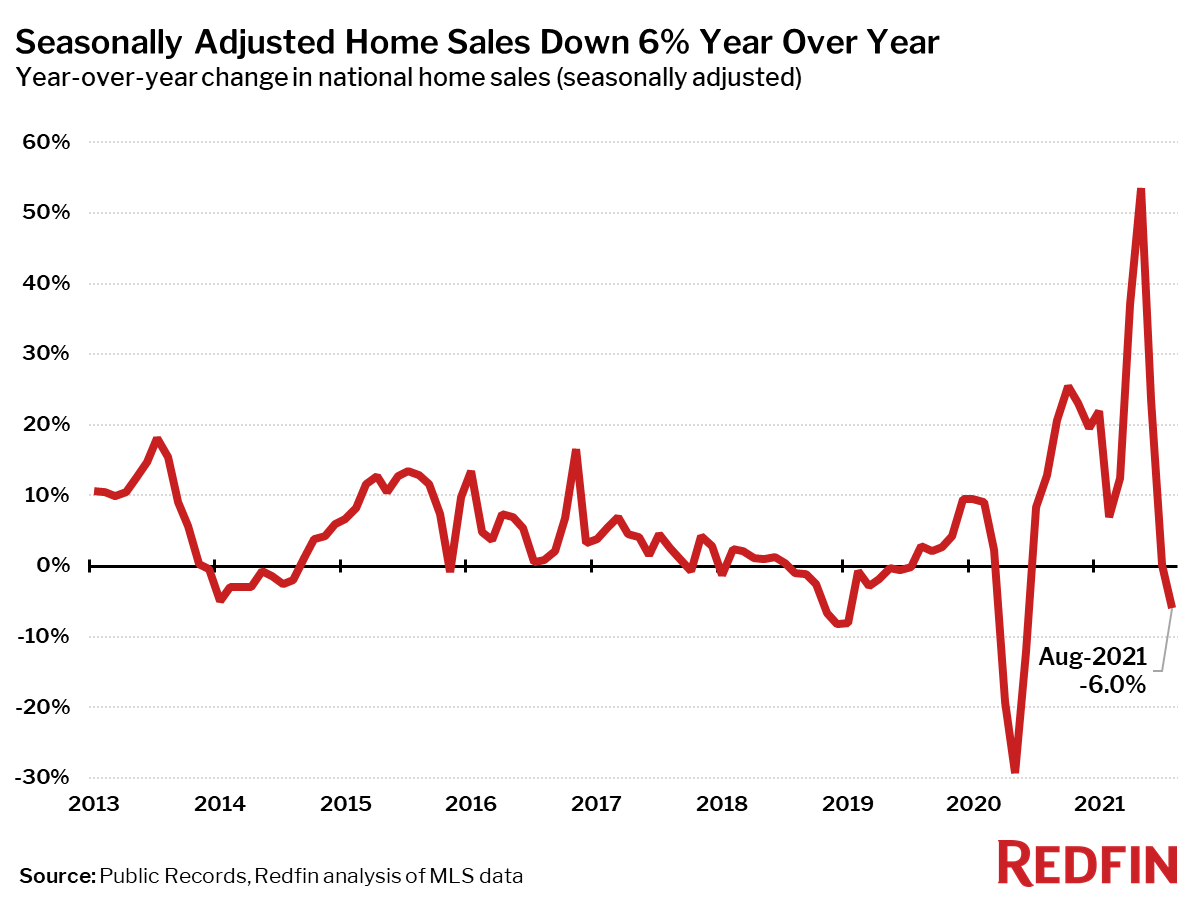
Seasonally-adjusted home sales in August were down 6% from a year earlier, the first annual decline in 15 months. They were also down 1.4% from July. Compared to August 2020, home sales fell in 44 of the 85 largest metro areas Redfin tracks. The biggest sales declines were seen in New Orleans (-23%), Salt Lake City (-16%) and Warren, MI (-14%). The largest gains were in places where sales were still somewhat depressed in August 2020, including New York (+65%), Honolulu (+47%), and Nassau County, NY (+32%).
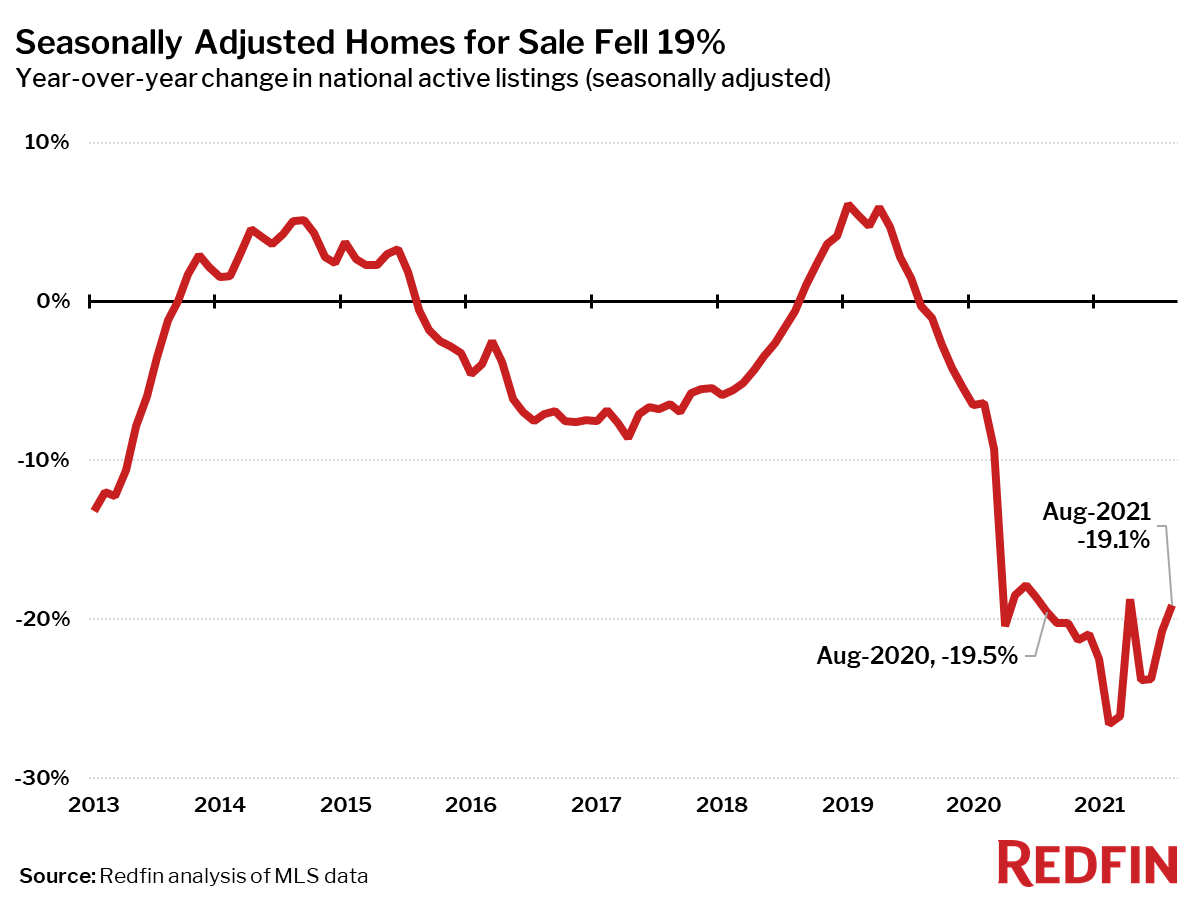
Seasonally adjusted active listings—the count of all homes that were for sale at any time during the month—fell 19% year over year, the smallest decline since April.
Only four of the 85 largest metros tracked by Redfin posted a year-over-year increase in the number of seasonally adjusted active listings of homes for sale: Austin, TX (+5%), Virginia Beach, VA (+4%), Columbus (+3%) and Milwaukee (+1%). The biggest year-over-year declines in active housing supply in July were in Baton Rouge, LA (-53%), North Port, FL (-44%) and West Palm Beach, FL (-37%).
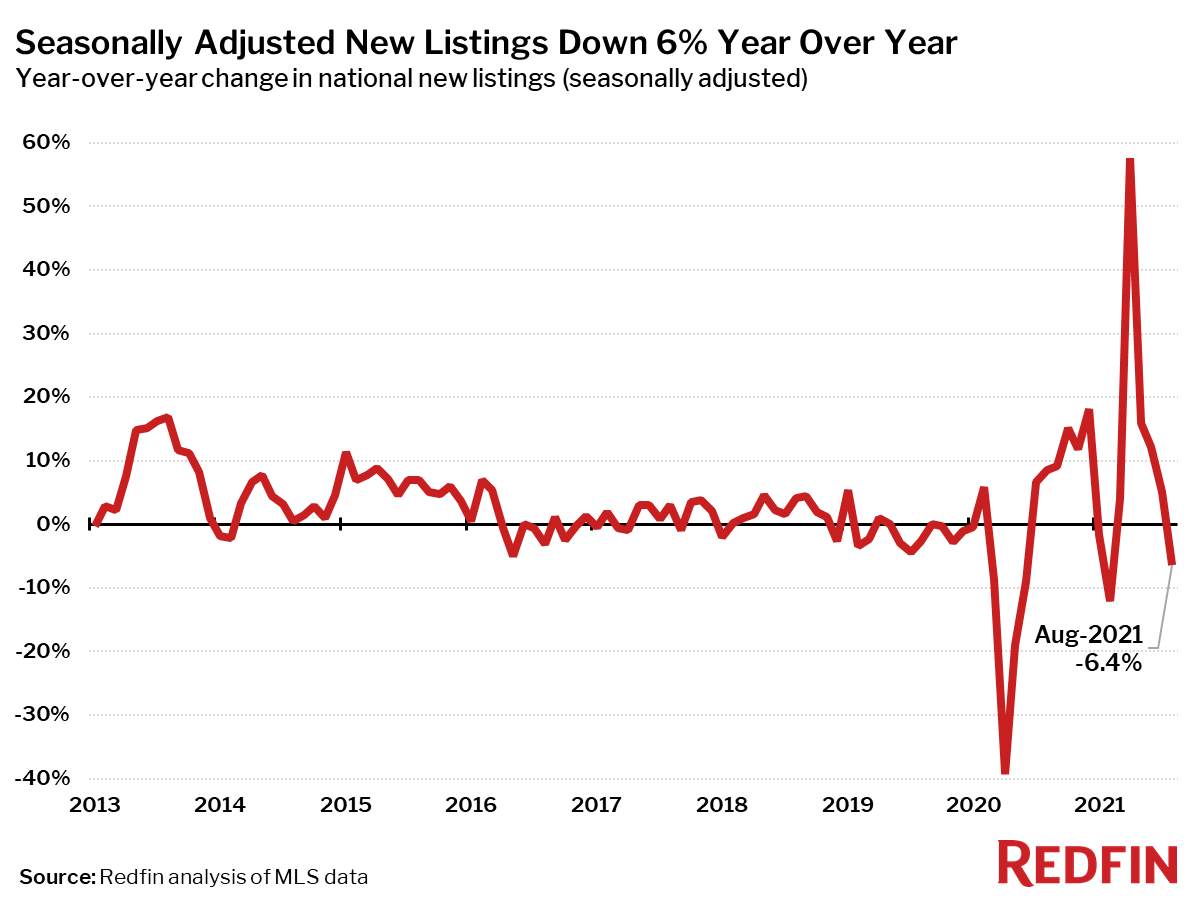
Seasonally adjusted new listings of homes for sale were down 6% in August from a year earlier, the first decline since February. New listings fell from a year ago in 56 of the 85 largest metro areas. The biggest declines were in Baton Rouge (-55%), Allentown, PA (-49%) and St. Louis, MO (-39%). New listings rose the most from a year ago in McAllen, TX (+27%), Virginia Beach, VA (+17%) and Tulsa, OK (+15%).
Measures of housing market competition based on completed home sales eased further in August from all-time records set in June.
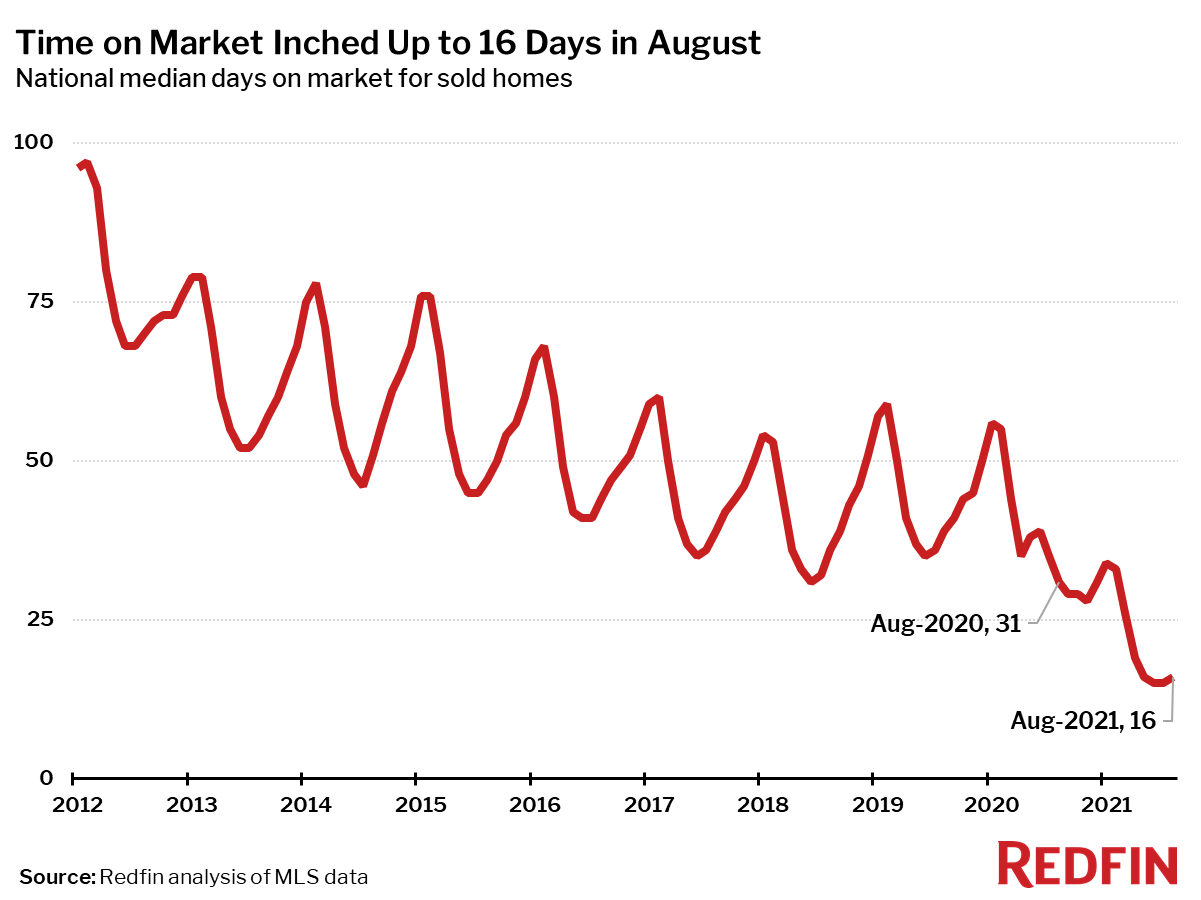
The typical home that sold in August went under contract in 16 days—about half as much time as a year earlier, when homes sold in a median 31 days, but up one day from the record low in June.
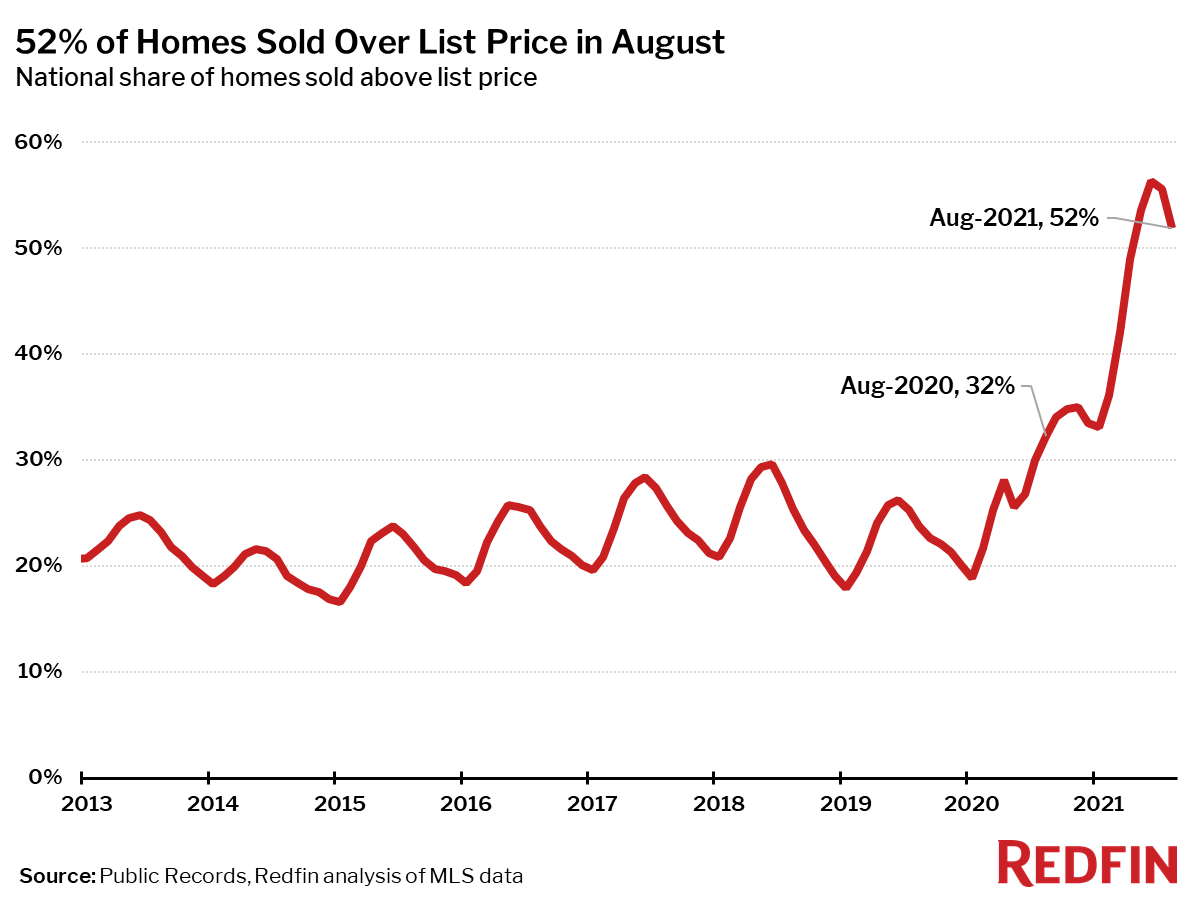
In August, 52% of homes sold above list price, down 4 percentage points from the record high in June, but up 20 percentage points from a year earlier.
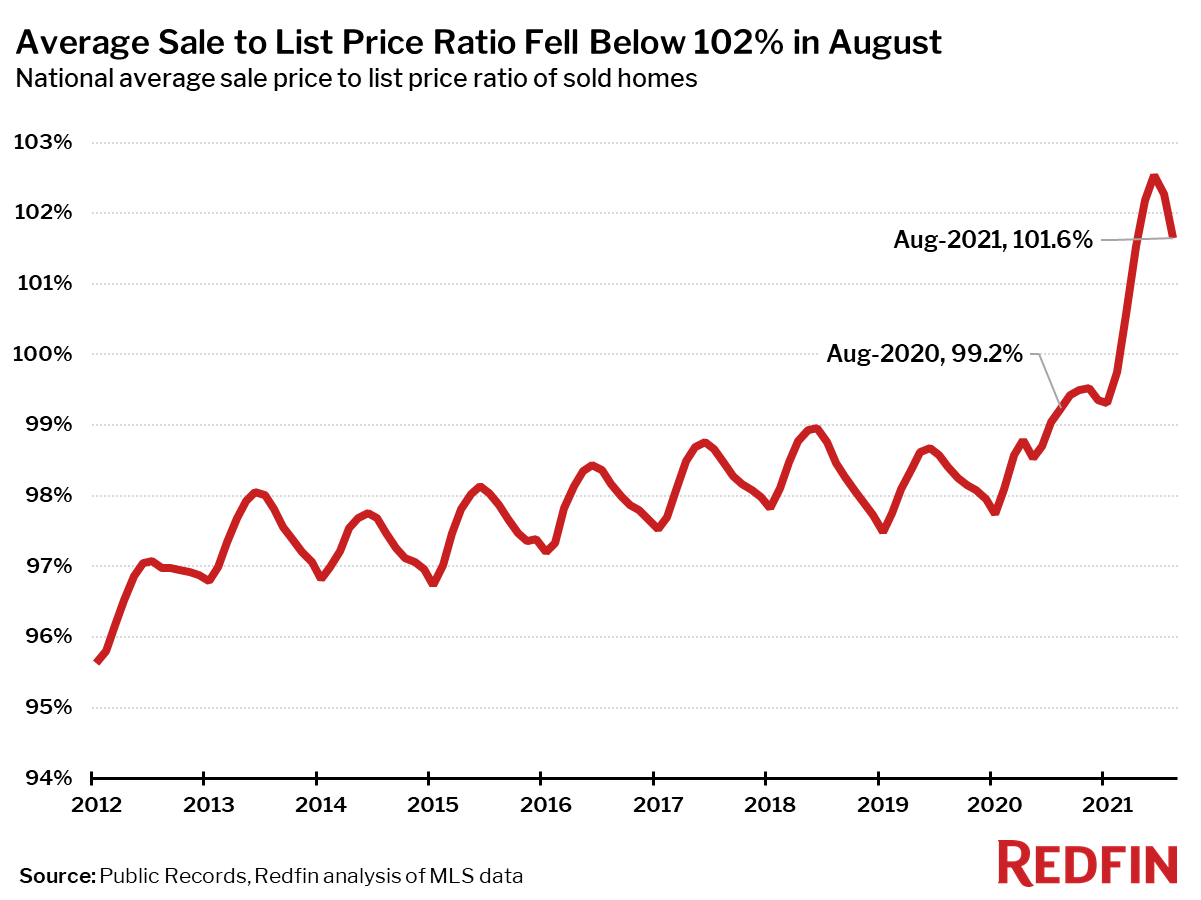
The average sale-to-list price ratio also dipped slightly in August to 101.6%, down from a record high of 102.5% in June but up from 99.2% a year earlier.
Below are market-by-market breakdowns for prices, inventory, new listings and sales for markets with populations of 750,000 or more. For downloadable data on all of the markets Redfin tracks, visit the Redfin Data Center.
