

Home prices surged 14% and sales were up 23%; supply fell by as much to an all-time low.
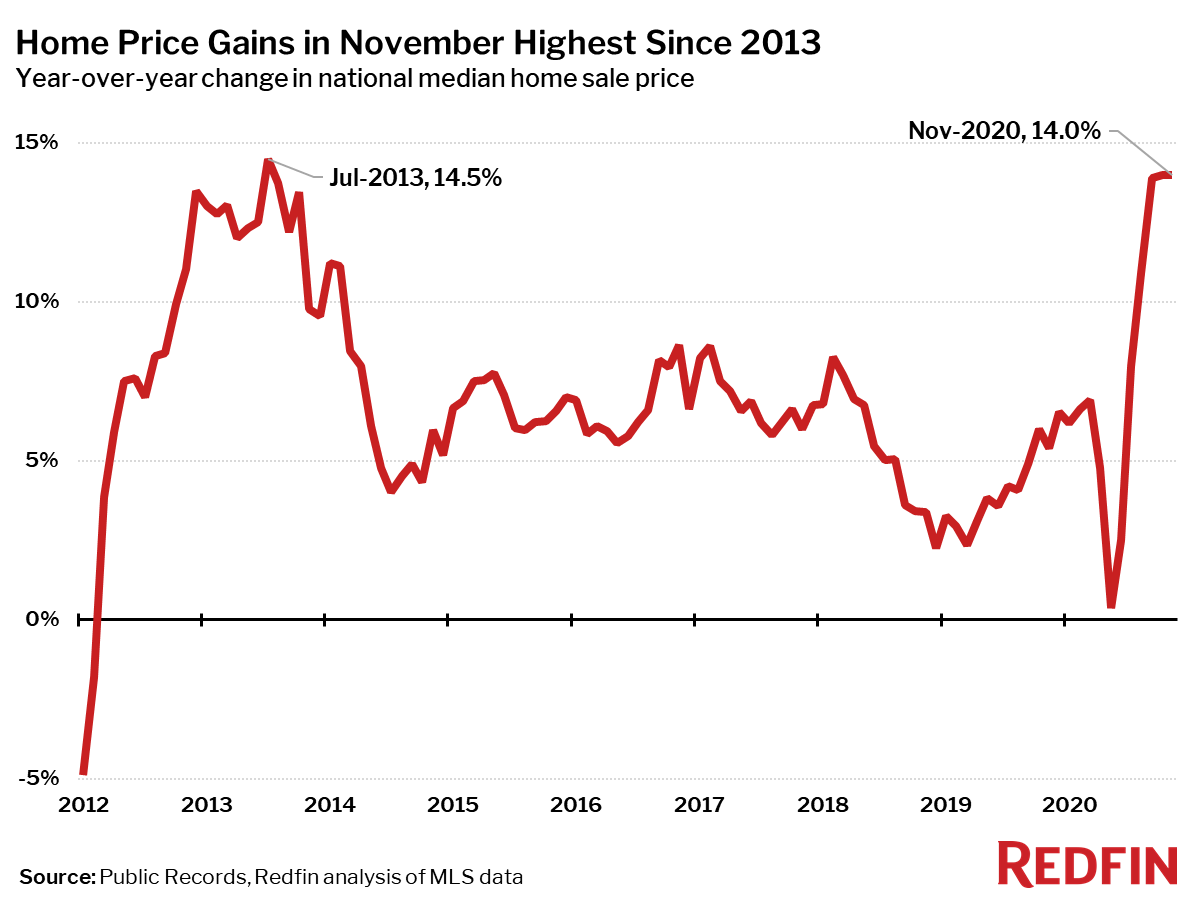
The national median home price rose 14.0% year over year to $335,519 in November—the second-largest annual increase on record as far back as our data goes (2012), bested only by a 14.5% gain in July 2013. These near-record gains are fueled by an extreme imbalance between homebuying demand and the supply of homes for sale. Closed home sales surged 23% from a year earlier and pending sales were up 37%, while new listings were up just 8%.
“Neither the election nor the Thanksgiving holiday weekend curbed homebuyers’ appetite in November,” said Redfin chief economist Daryl Fairweather. “I personally bought a home last month because I knew if I didn’t seal the deal by then, I would have to wait until January for more new listings to hit the market to find one that checked all of my boxes. Plus, there is no guarantee mortgage rates will stay this low for much longer. And like most buyers this time of year, once I had it in my head that it was time to move, I wanted to be settled in my new home in time for the holidays.”
The housing market set multiple records in November for time on market, the share of homes sold above list price and the number of homes for sale. The rate of home price and sales growth are also both near their all-time highs, suggesting that November may be the hottest housing market on record.
Median prices increased in each of the 85 largest metro areas Redfin tracks. The smallest price gains compared to a year earlier were in San Francisco (+1.8%). The largest price increases were in Bridgeport, CT (+22%), Newark, NJ (+22%) and Memphis, TN (+20%). Nationally, home price increases leveled off in November close to the all-time high.
“Memphis’ low cost of living is attracting a lot of newly-mobile people here from big cities,” said Redfin Memphis real estate agent David Taube. “Most homes receive multiple offers within a day or two of hitting the market. It’s stressful for local homebuyers, because now they have to offer well above list price to have a chance at competing with an out-of-towner’s offer.”
This is the second month in a row that the Bridgeport and Newark areas have seen the largest price gains in the nation as they continue to see an influx of newly work-from-home buyers moving from New York City in search of more space.
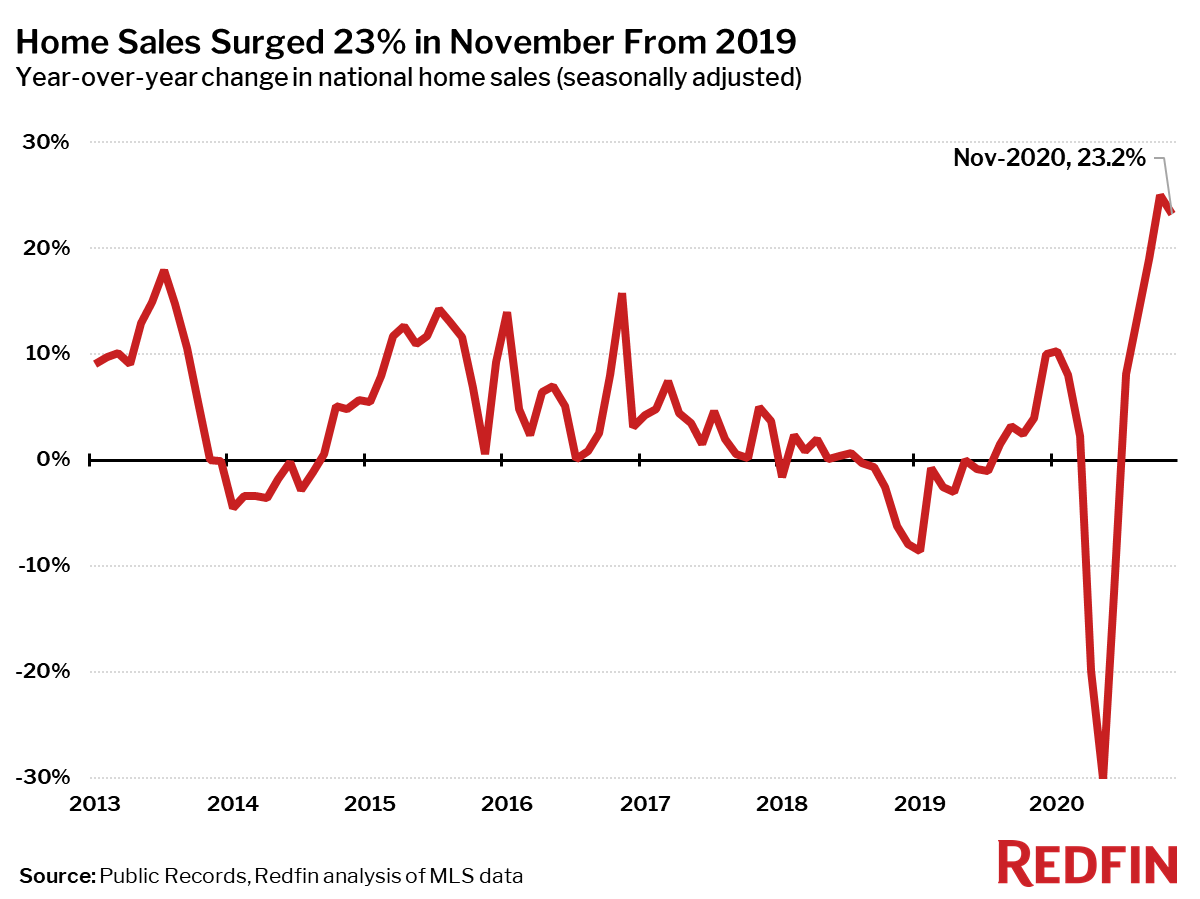
Home sales were up 23% in November from a year earlier on a seasonally-adjusted basis, down slightly from the record high of 25% set in October.
The number of homes sold in November was up from a year earlier in all but one of the 85 largest metro areas Redfin tracks. The largest gains in sales were in Bridgeport, CT (+65%), Lake County, IL (+45%) and Elgin, IL (+44%). The only market that saw a decrease in the number of homes sold was Honolulu (-0.8%).
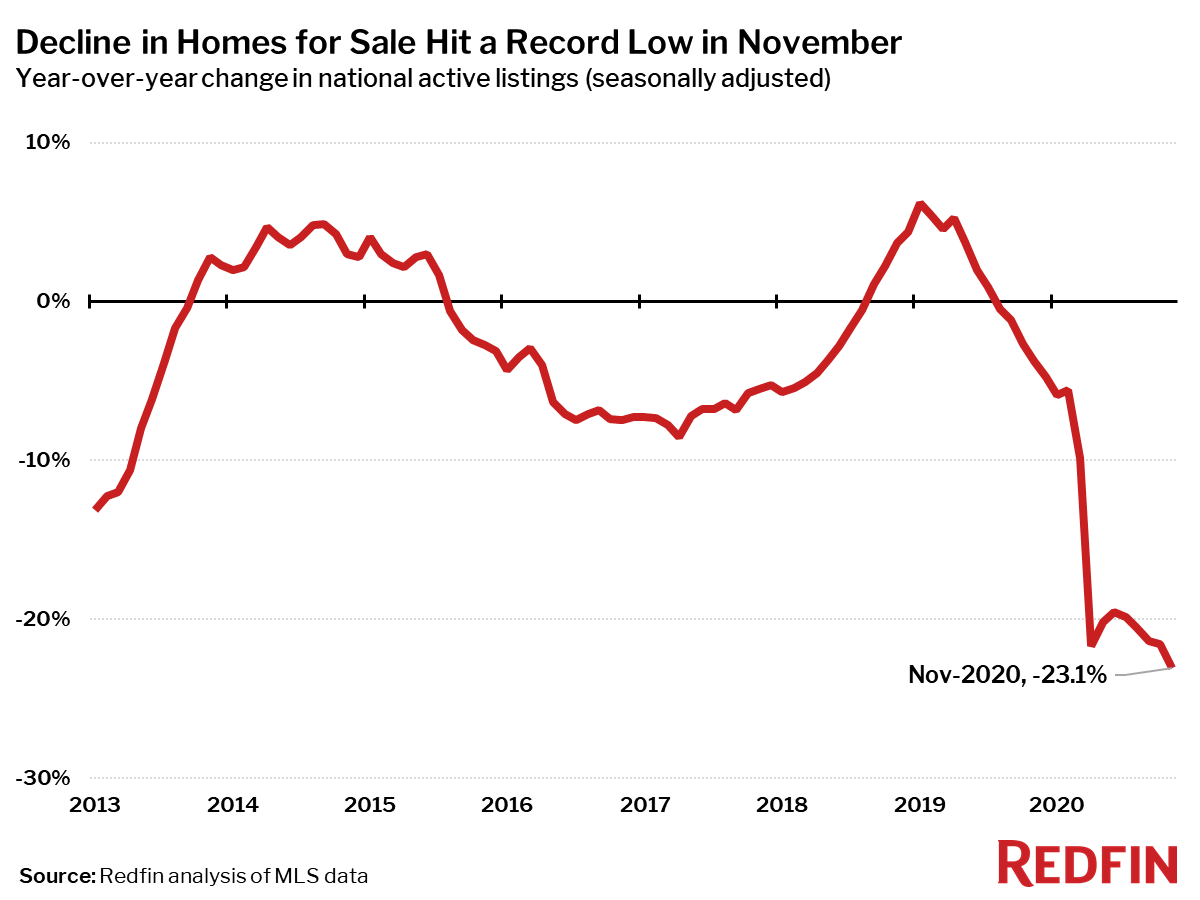
Active listings—the count of all homes that were for sale at any time during the month—fell 23% year over year to their lowest level on record in November, the 16th-straight month of declines.
Only two of the 85 largest metros tracked by Redfin posted a year-over-year increase in the count of seasonally-adjusted active listings of homes for sale: San Francisco (+72%) and New York City (+32%). The number of homes for sale continued to build up in these markets as growth in new listings (53% and 37% year over year, respectively) dwarfs increases in home sales (+23% and +21%).
Compared to a year ago, the biggest declines in active housing supply in November were in Kansas City, MO (-50%), Salt Lake City (-54%) and Elgin, IL (+45%).
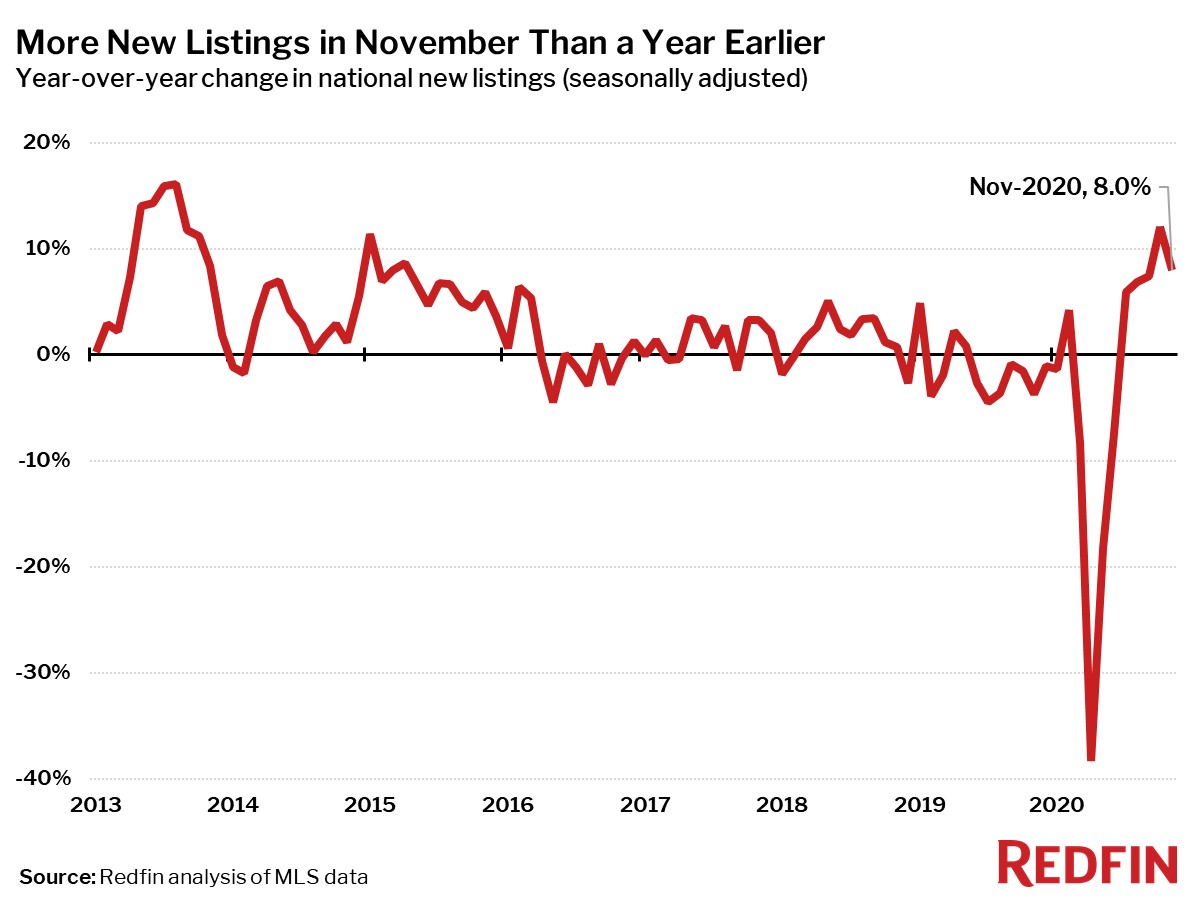
The number of new listings of homes for sale increased 8% in November from a year earlier, a slight dip from the seven-year high in October. Increases in new listings are still being heavily outpaced by increases in pending sales, which were up 37% year over year in November.
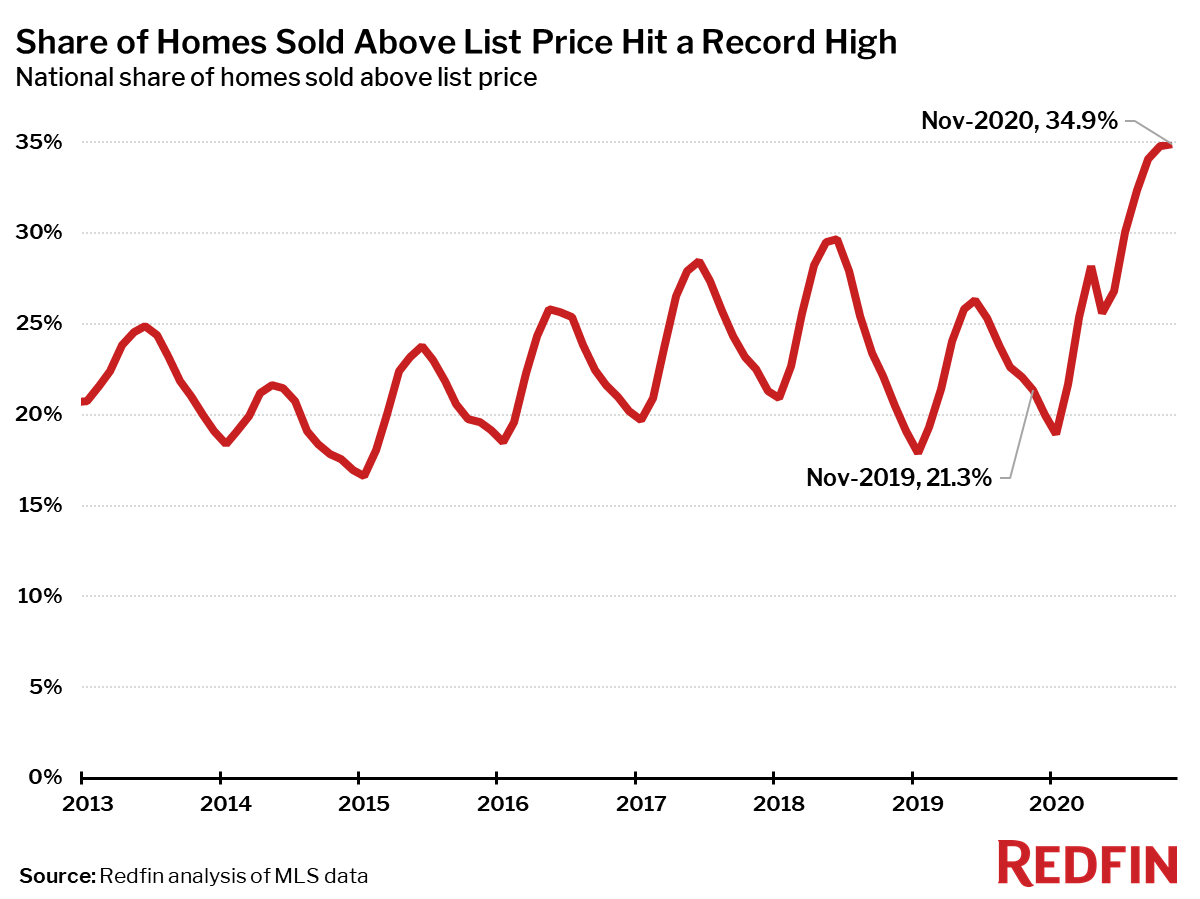
Measures of competition such as time on market and the share of homes sold above list price hit new records in November as they continued to run against the typical seasonal trend. This ongoing market dynamic is a reflection of the severe imbalance between the number of homebuyers and sellers in the market.
The typical home that sold in November went under contract in 27 days—18 days less than a year earlier–a new all-time low since the beginning of Redfin’s data in 2012.
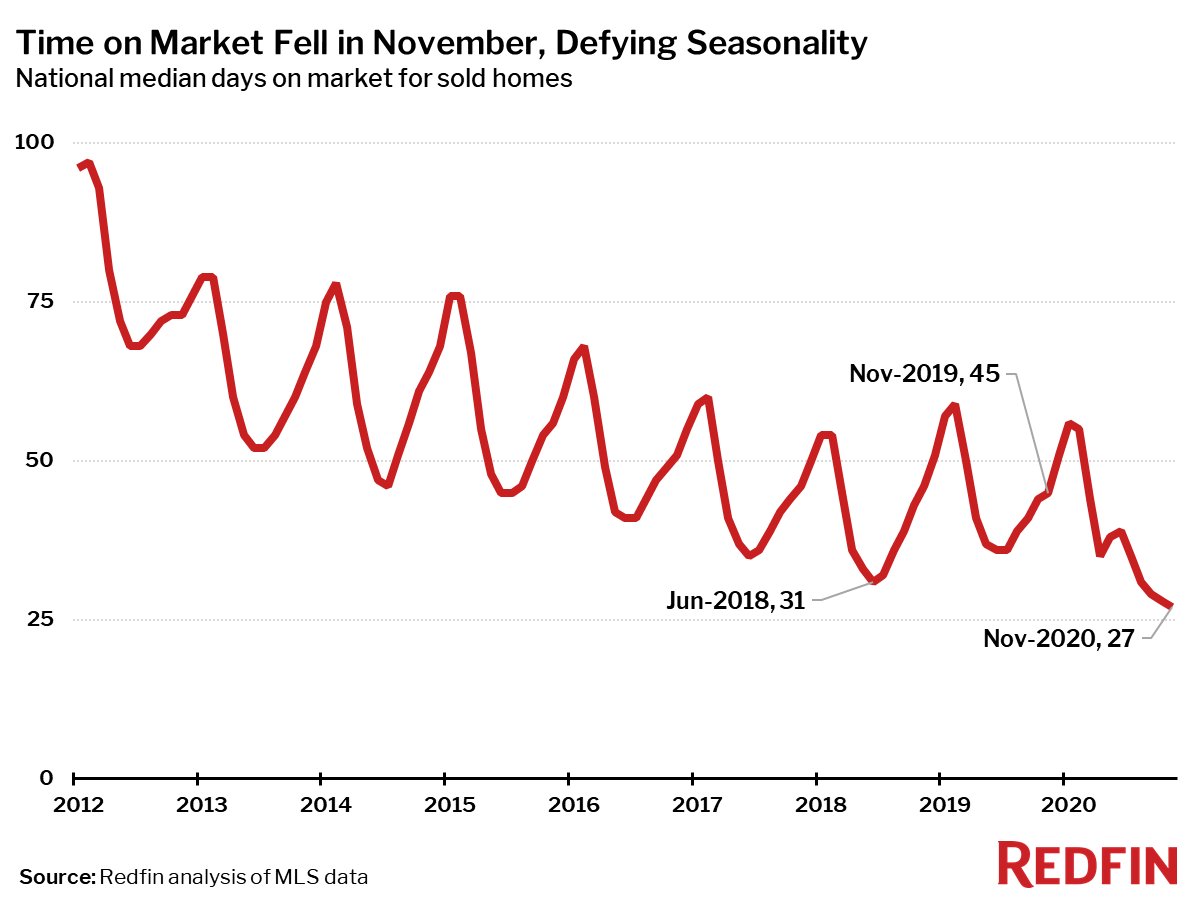
Typically during the last few months of the year homes spend more time on the market and the share of homes that sell above list price declines. This year the ongoing pandemic and recession has thrown the housing market into disarray, completely upending the typical seasonal trends.
In November 35% of homes sold above list price—the highest level in our data, which goes back through 2012—up from 21% a year earlier.
Below are market-by-market breakdowns for prices, inventory, new listings and sales for markets with populations of 750,000 or more. For downloadable data on all of the markets Redfin tracks, visit the Redfin Data Center.
