

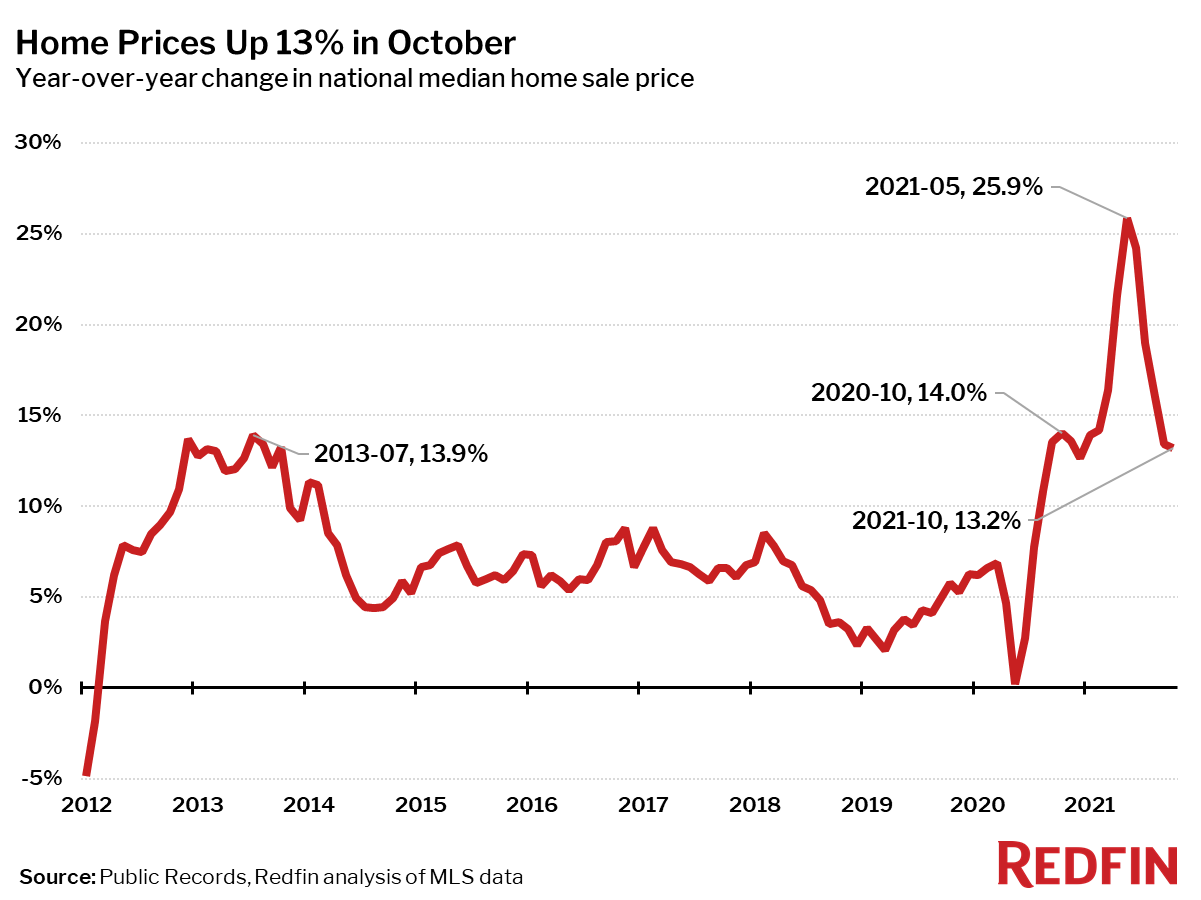
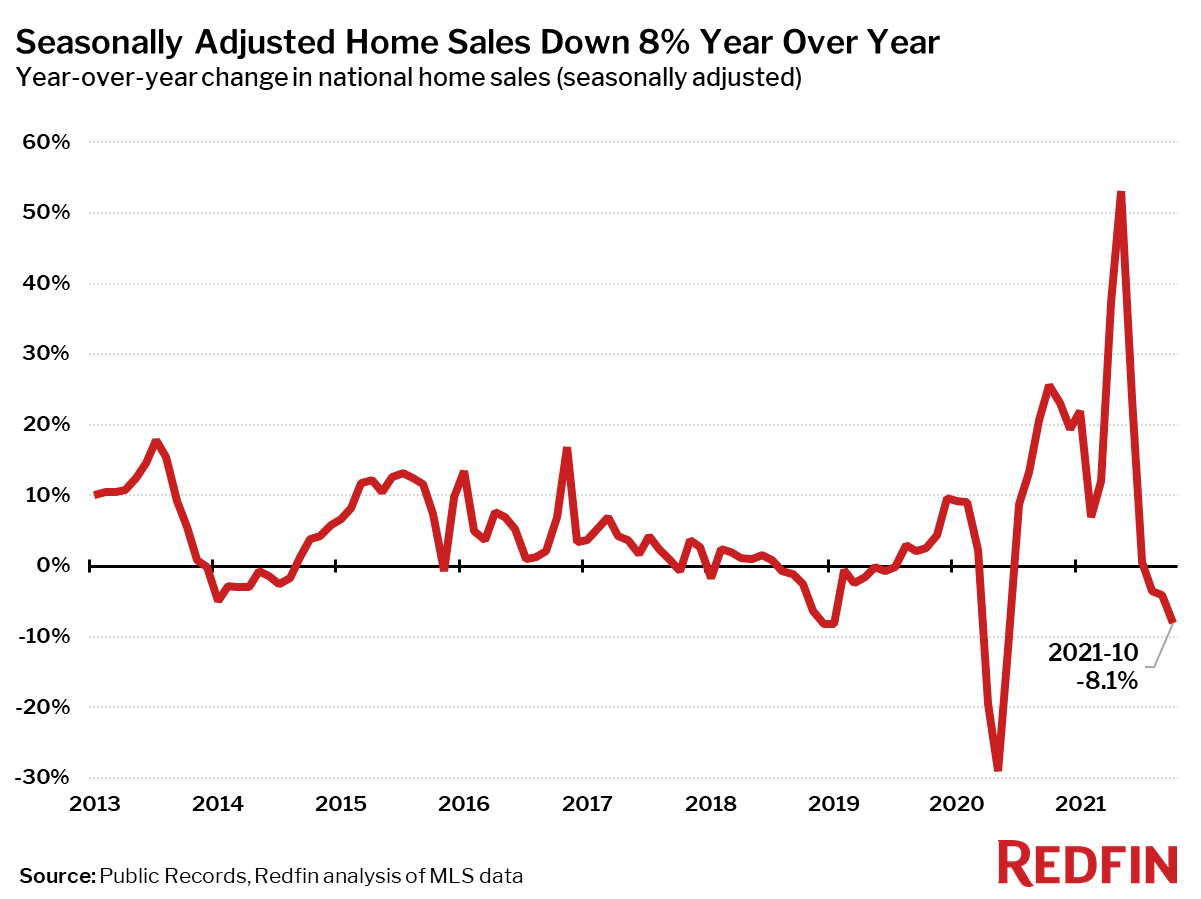
The median price of homes sold in October was $378,700, up 13% from a year earlier, the lowest growth rate since December 2020. October marked the 15th consecutive month of double-digit price gains. Seasonally-adjusted closed home sales and new listings of homes for sale both fell from a year earlier, by 8% and 11% respectively. Overall the housing market experienced fairly typical seasonal cooling in October. However, relief for homebuyers may be short-lived as pending sales rose 3% from September and early signals of demand are picking back up again in the first weeks of November.
“Although October brought fairly typical seasonal cooling to the housing market, the latest homebuying demand data suggests that the market is heating back up this month,” said Redfin Chief Economist Daryl Fairweather. “Homebuyers who were waiting until fall or winter to try to find a home in a less competitive market may be disappointed. Even record-high home prices have not convinced many homeowners to sell. We may not see the historic inventory crunch abate until the second half of next year.”
Median sale prices increased from a year earlier in all but one of the 85 largest metro areas Redfin tracks: Bridgeport, CT (Fairfield County), where prices were down 4.2%. A year ago home price gains in Bridgeport had peaked at 40% while the area rode a wave of in-migration of homebuyers leaving New York City. Price declines over the past few months are likely a continued cooling from an extremely overheated state.
The largest price increases in October 2021 were in Phoenix, AZ (+25%), Austin, TX (+25%) and McAllen, TX (+24%).
Seasonally-adjusted home sales in October were down 8% from a year earlier, the largest decline in 16 months. Home sales fell in 76 of the 85 largest metro areas Redfin tracks. The biggest sales declines were seen in Bridgeport, CT (-26%), New Brunswick, NJ (-22%) and Salt Lake City (-21%). The largest gains were in places where sales were still somewhat depressed in October 2020, including Honolulu (+18%), New York (+11%), and San Jose, CA (+7%).
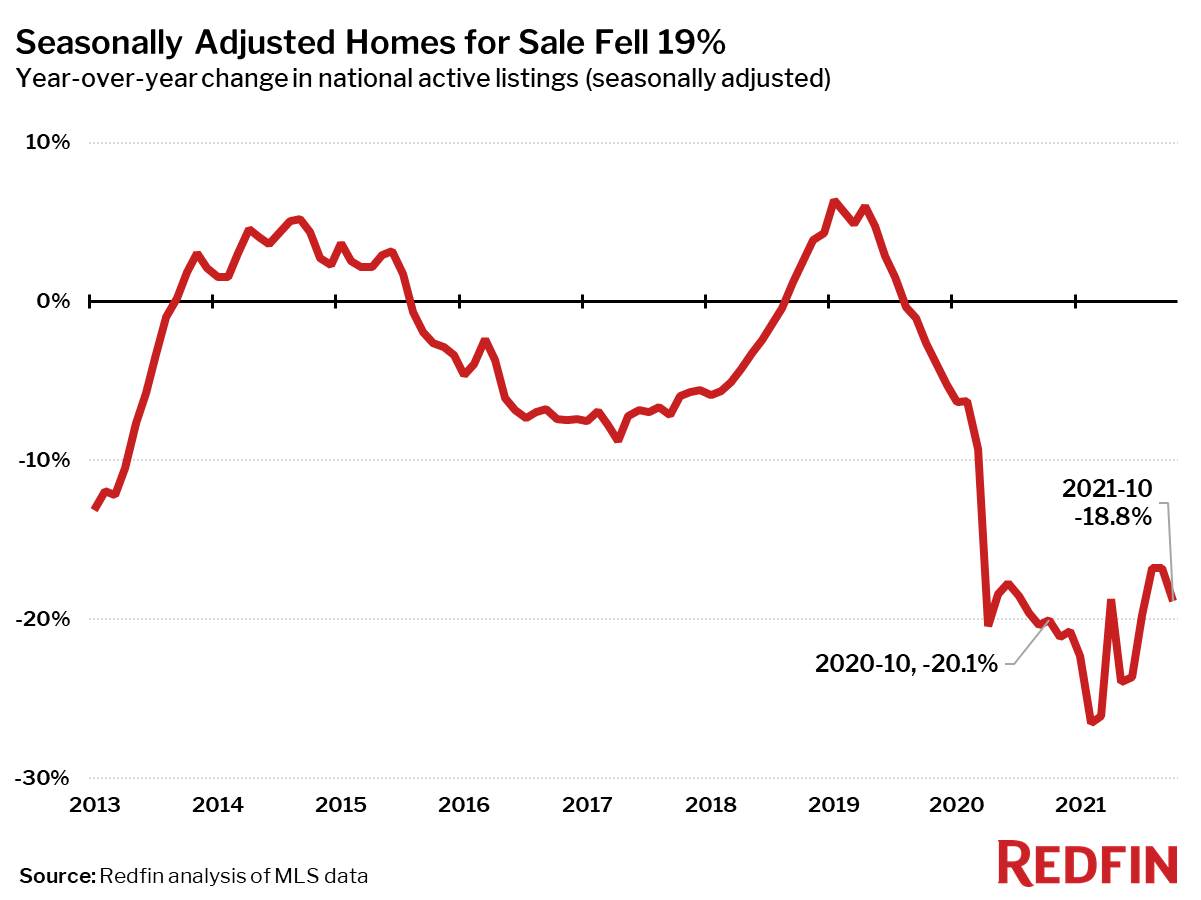
Seasonally adjusted active listings—the count of all homes that were for sale at any time during the month—fell 19% year over year in October, on par with recent months.
Only one of the 85 largest metros tracked by Redfin posted a year-over-year increase in the number of seasonally adjusted active listings of homes for sale: Tacoma, WA (+2%). The biggest year-over-year declines in active housing supply in September were in Baton Rouge, LA (-50%), Salt Lake City (-50%) and North Port, FL (-41%).
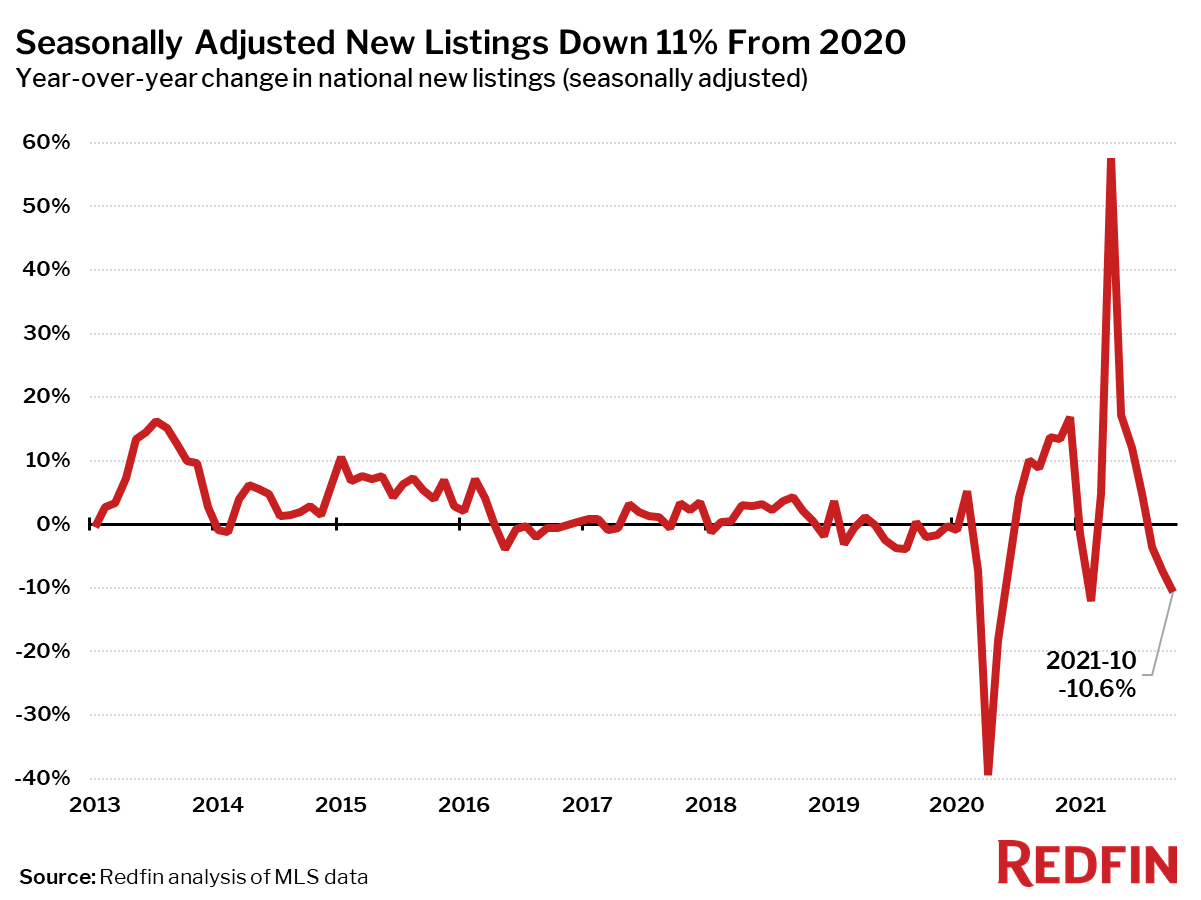
Seasonally adjusted new listings of homes for sale were down 11% in October from a year earlier, the largest decline in eight months. New listings fell from a year ago in 78 of the 85 largest metro areas. The biggest declines were in Salt Lake City, UT (-59%), Allentown, PA (-58%) and Baton Rouge (-52%). New listings rose the most from a year ago in Oklahoma City (+6%), Buffalo, NY (+3%) and Austin, TX (+2%).
The housing market became less competitive in October than it was in August or September, however the latest data shows some of these measures beginning to heat back up.
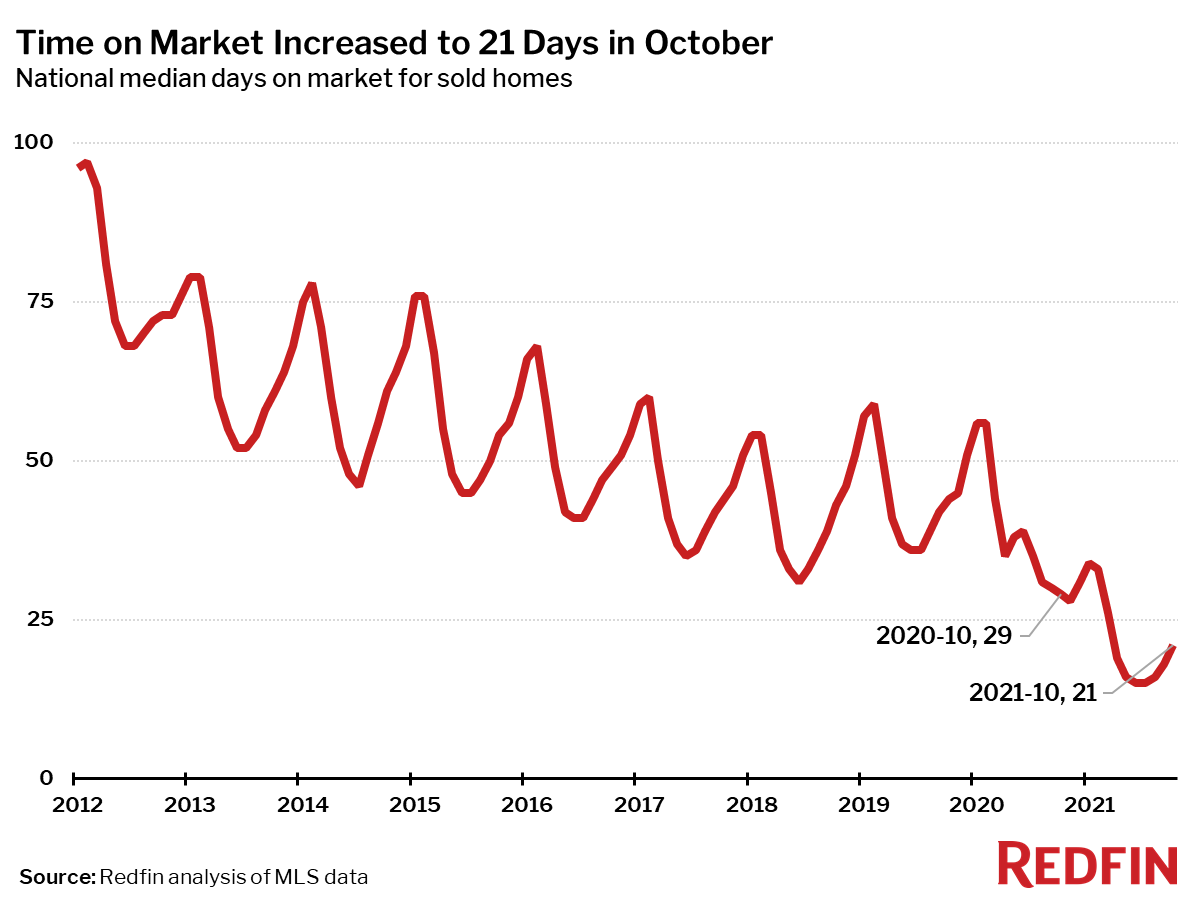
The typical home that sold in October went under contract in 21 days—more than a week faster than a year earlier, when homes sold in a median 29 days, but up three days from the record low of 15 days in June.
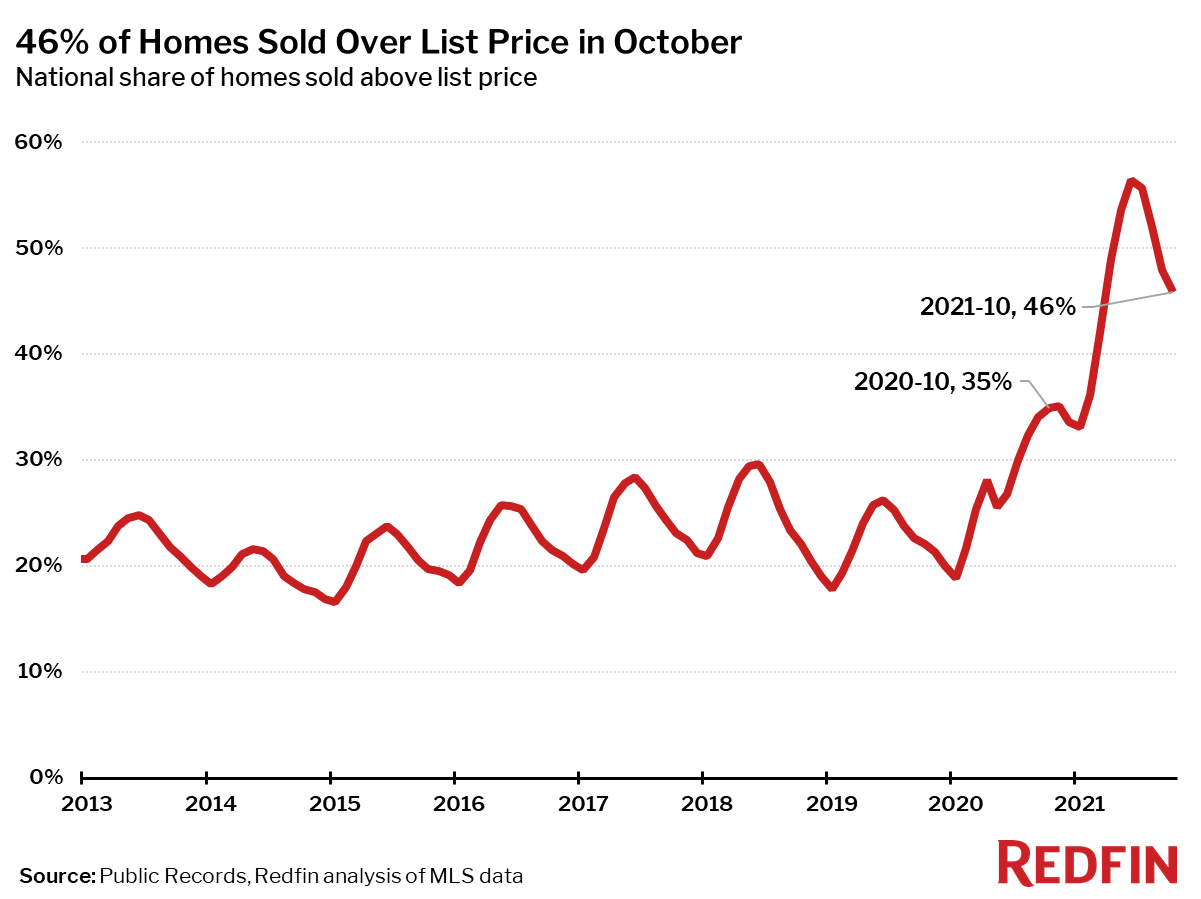
In October, 46% of homes sold above list price, down 11 percentage points from the record high in June, but up 11 percentage points from a year earlier.
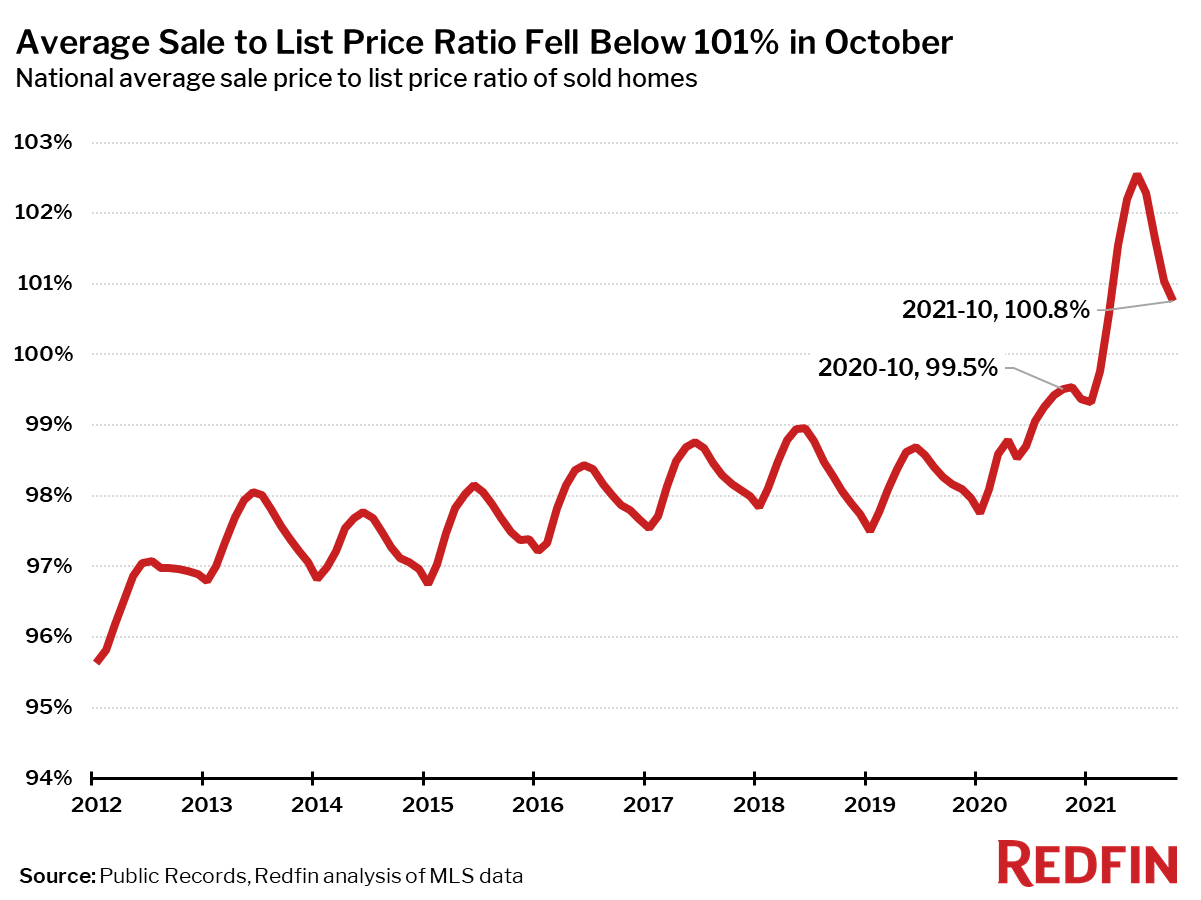
The average sale-to-list price ratio also dipped slightly in October to 100.8%, down from a record high of 102.6% in June but up from 99.5% a year earlier.
Below are market-by-market breakdowns for prices, inventory, new listings and sales for markets with populations of 750,000 or more. For downloadable data on all of the markets Redfin tracks, visit the Redfin Data Center.
