An increase in home searches and tours at the end of 2022 is starting to translate into purchases as mortgage rates fall. Mortgage applications are up 25% and the slowdown in pending sales is easing.
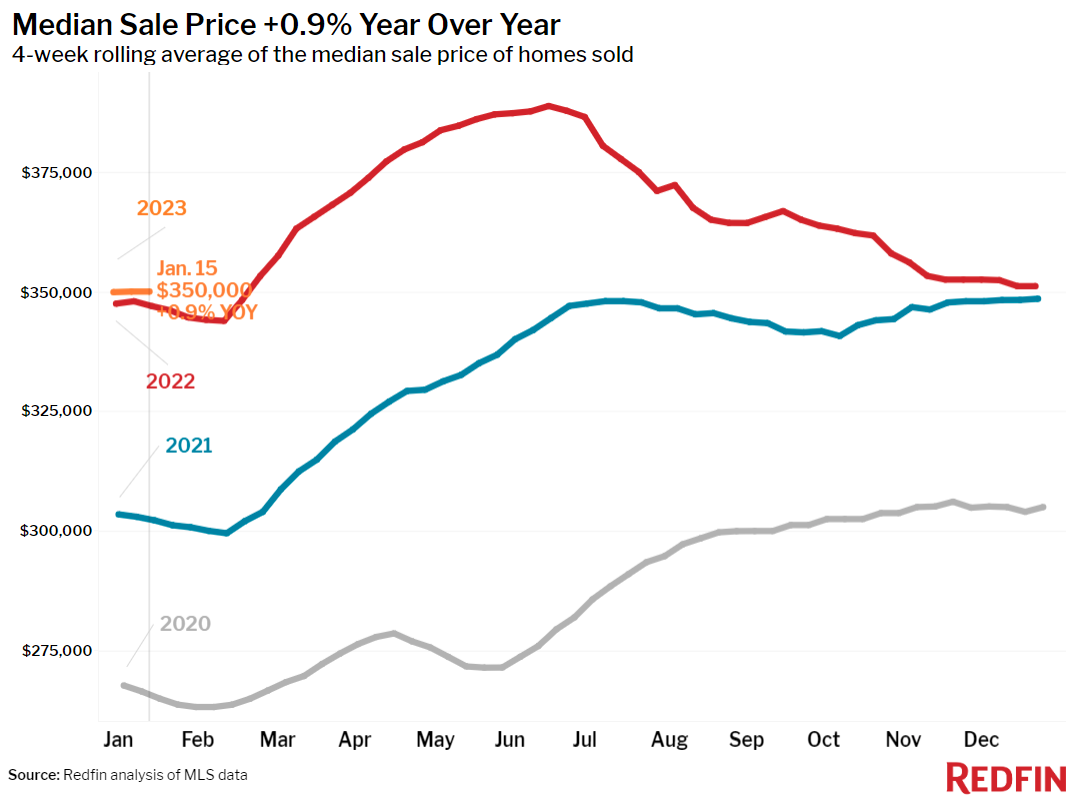
The median U.S. home-sale price increased 0.9% from a year earlier to $350,250 during the four weeks ending January 15, the biggest increase in a month.
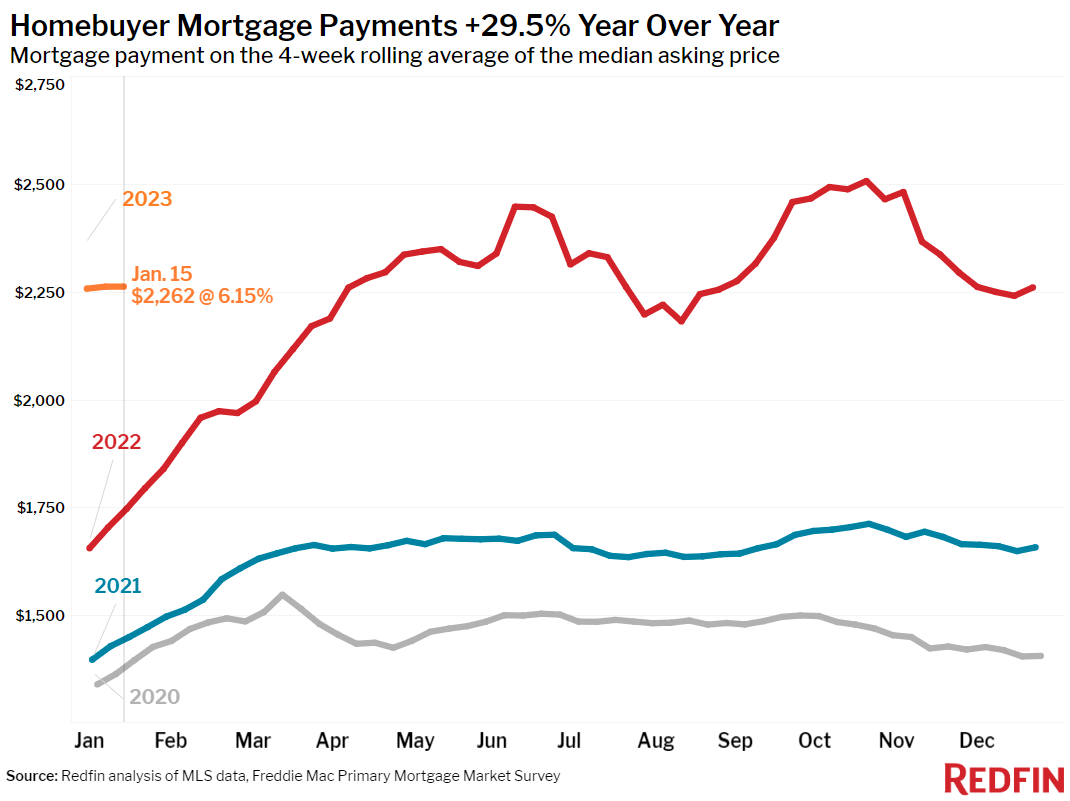
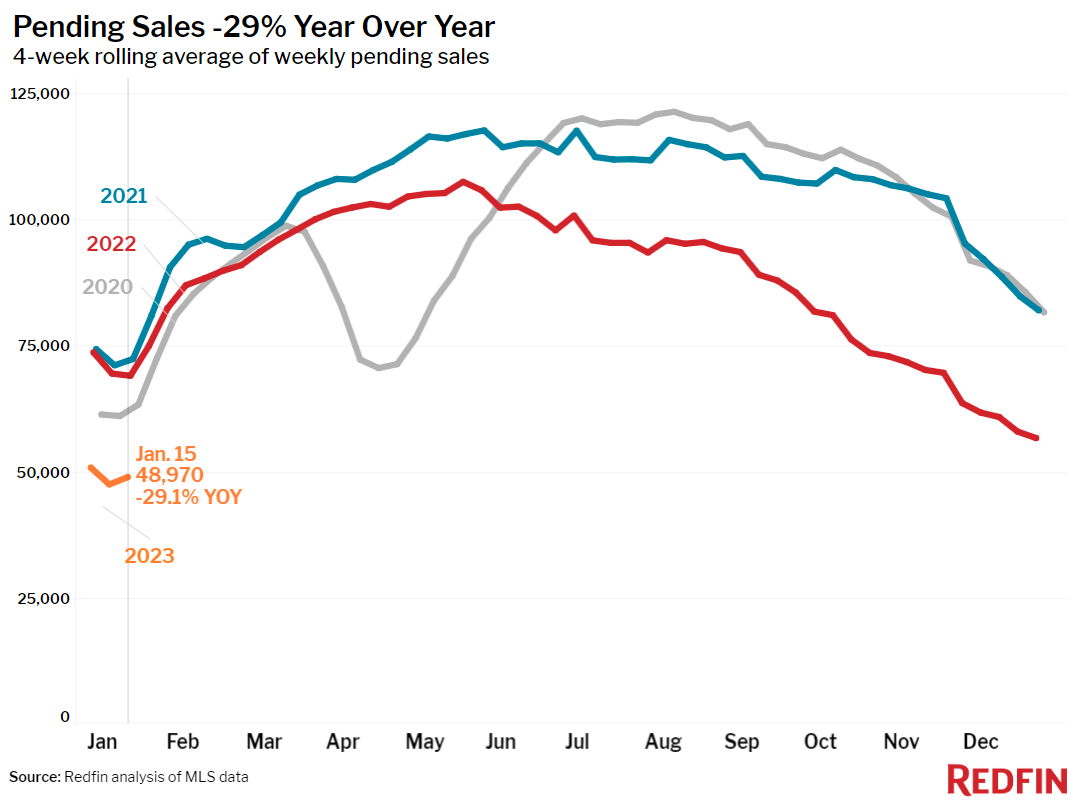
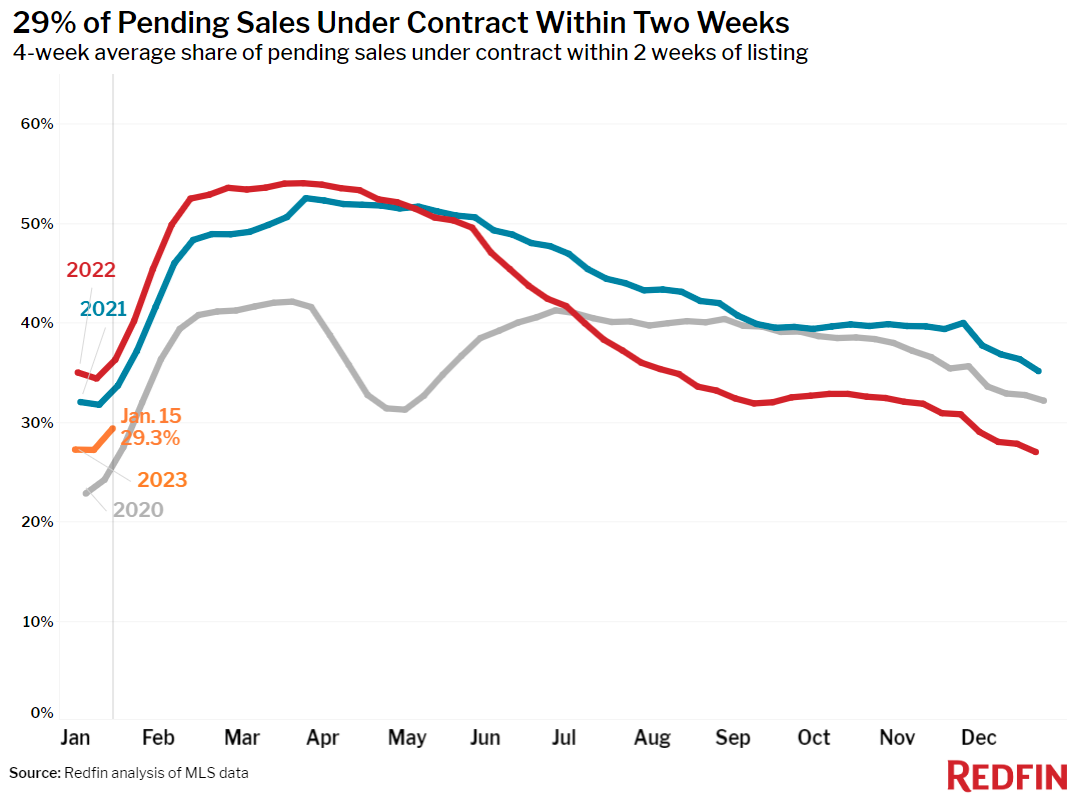
Prices remain elevated because buyer activity has started to pick up as mortgage rates decline due to slowing inflation. Average mortgage rates dropped to 6.15% during the week ending January 19, their lowest level since September. Pending home sales fell 29% year over year–a significant decline, but the first sub-30% drop in three months. Mortgage-purchase applications rose 25% from the week before during the week ending January 13, a jump that’s likely to lead to more pending sales in the coming months.
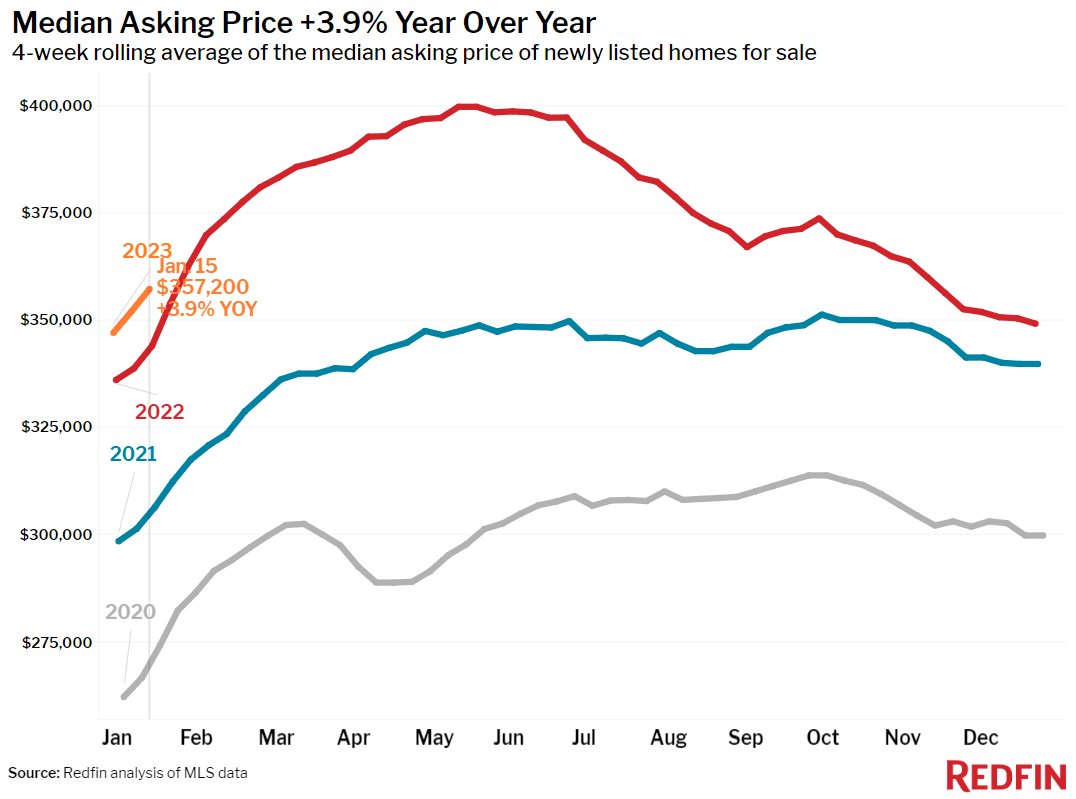
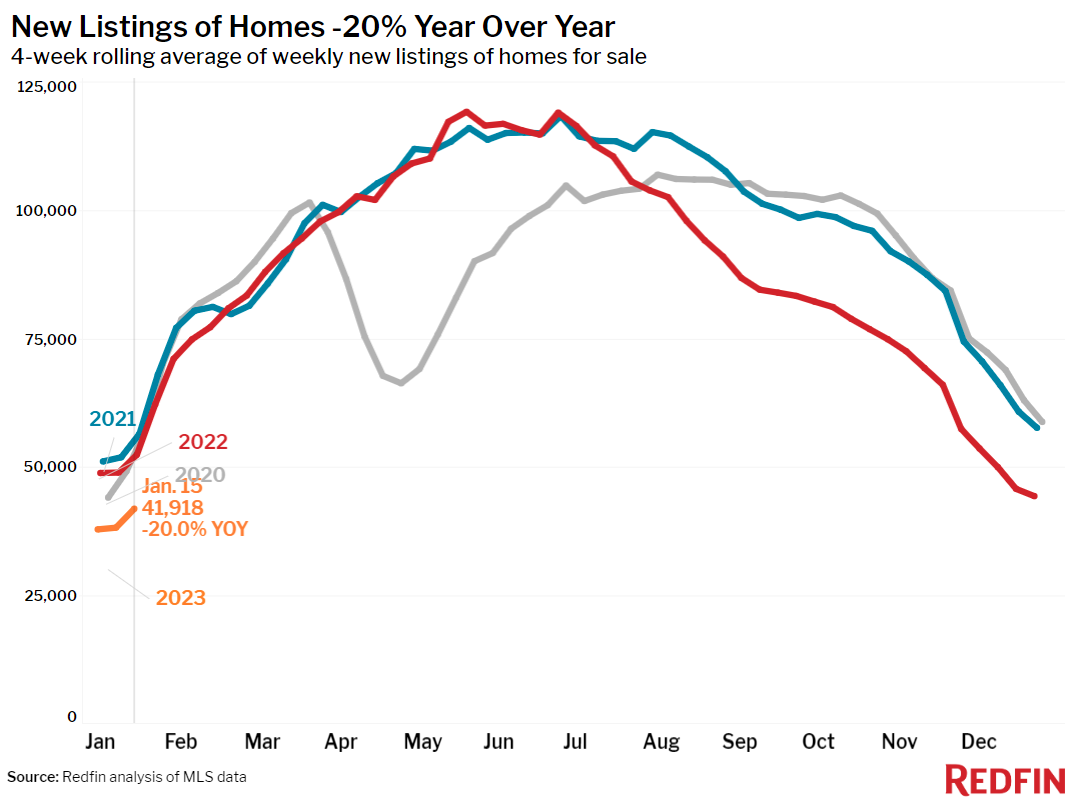
As demand inches back, some homeowners are less reluctant to sell. New listings of homes for sale fell 20% year over year during the four weeks ending January 15–but that’s the smallest decline in two months.
“The people who started browsing homes online and scheduling house tours at the end of 2022 are now turning into actual homebuyers,” said Redfin Deputy Chief Economist Taylor Marr. “Low competition, falling mortgage rates and seller concessions are bringing some buyers back to the market. That’s helping keep national home prices afloat, which is one bright spot for sellers. But many buyers are still sitting on the sidelines and demand could dip back down if inflation declines slower than expected or mortgage rates rise again.”
Home-sale prices fell year over year in 18 of the 50 most populous U.S. metros during the four weeks ending January 15. By comparison, 20 metros saw a price decline during the prior four-week period and 11 metros saw price declines a month earlier.
Prices fell 10.1% year over year in San Francisco, 6.7% in San Jose, 5.5% in Austin, 4.3% in Detroit, 3.8% in Seattle, 3.7% in Phoenix, 3.4% in Sacramento, 3.1% in San Diego, 2.8% in Anaheim, CA, 2.5% in Chicago, 2.4% in Los Angeles, 2.3% in Oakland, CA and 2.2% in Boston. They fell less than 2% in Riverside, CA, Portland, OR, New York, Newark, NJ, and Las Vegas.
This week’s report excludes the Redfin Homebuyer Demand Index due to a data-collection issue. It will be back next week.
Unless otherwise noted, the data in this report covers the four-week period ending January 15. Redfin’s weekly housing market data goes back through 2015.
Refer to our metrics definition page for explanations of all the metrics used in this report.