Note: At this time last year, pandemic stay-at-home orders halted homebuying and selling, which makes year-over-year comparisons unreliable for select housing metrics. As such, we have broken this report into two sections: metrics that are OK to compare to the same period in 2020, and metrics for which it makes more sense to compare to the same period in 2019.
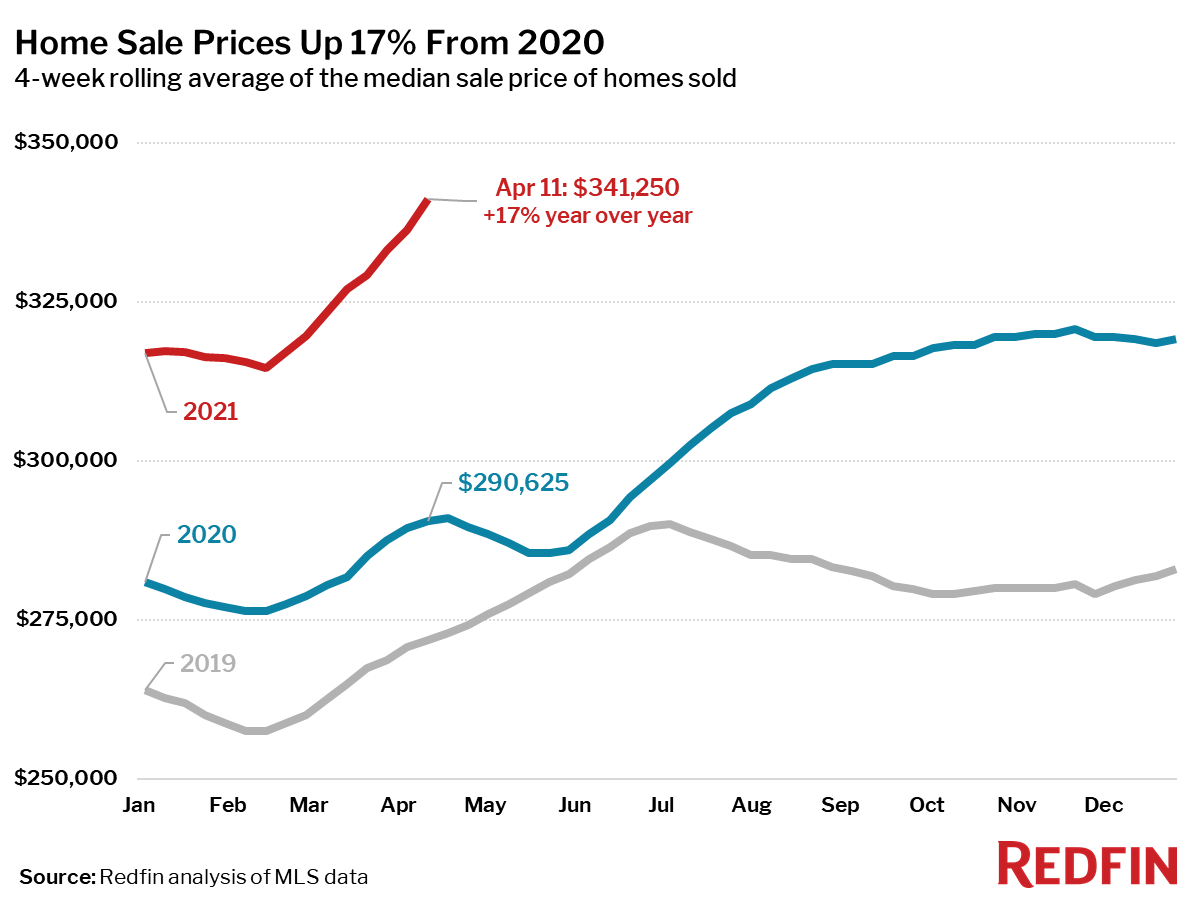
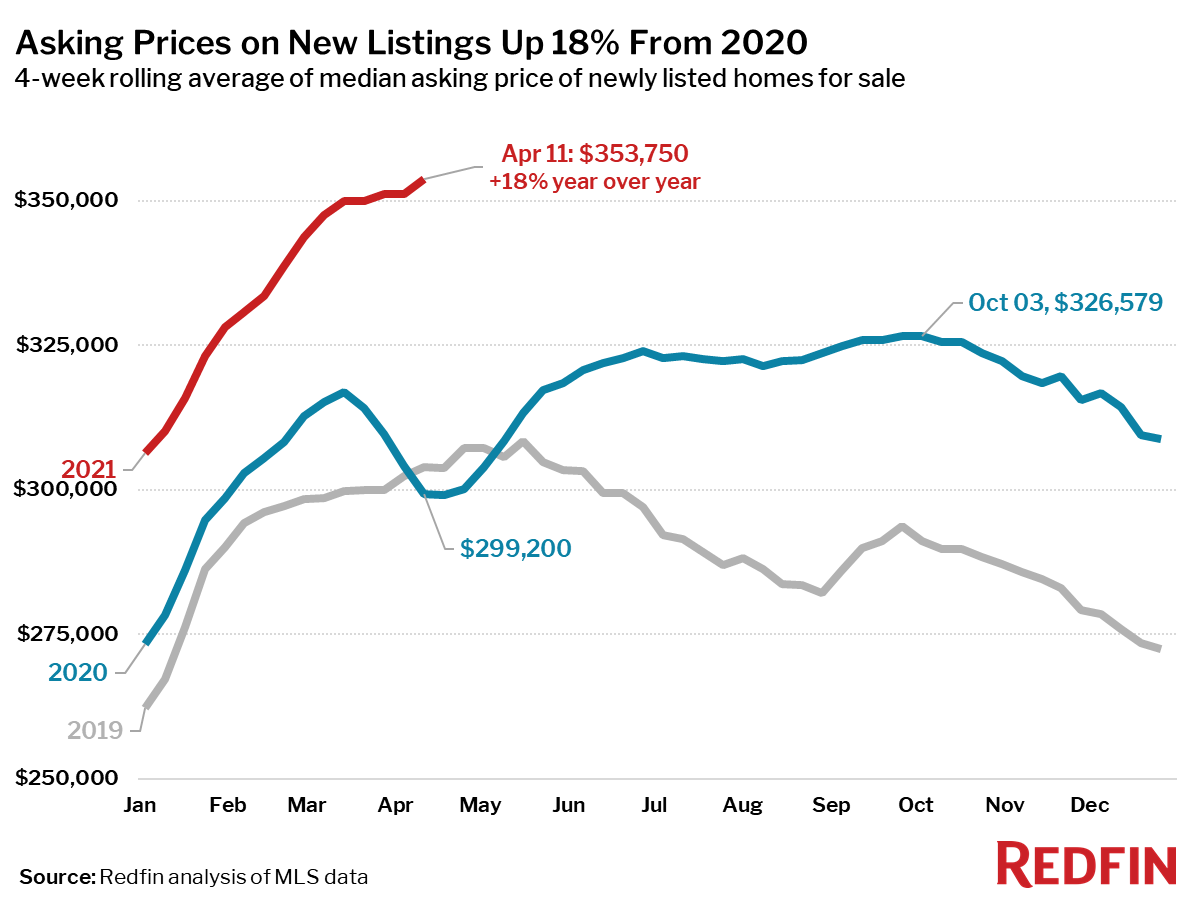
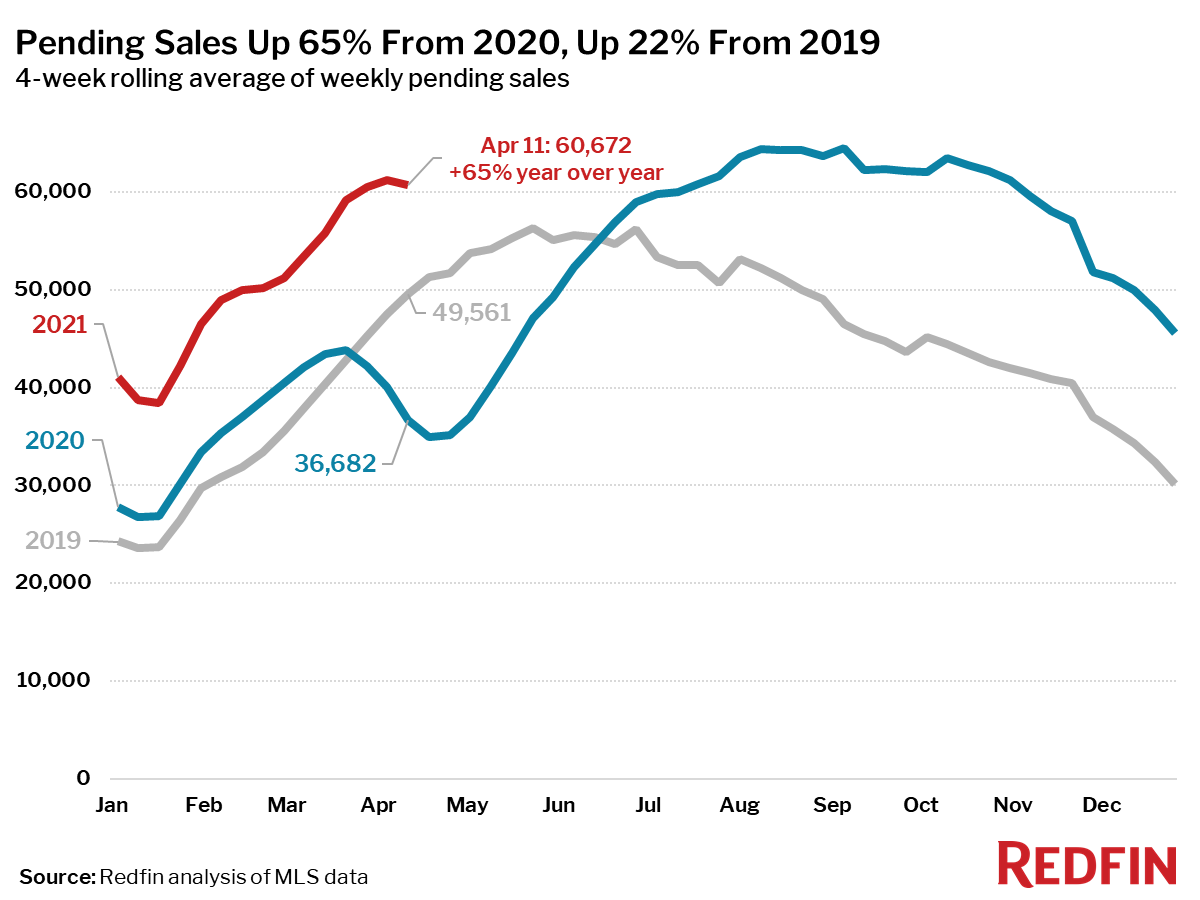
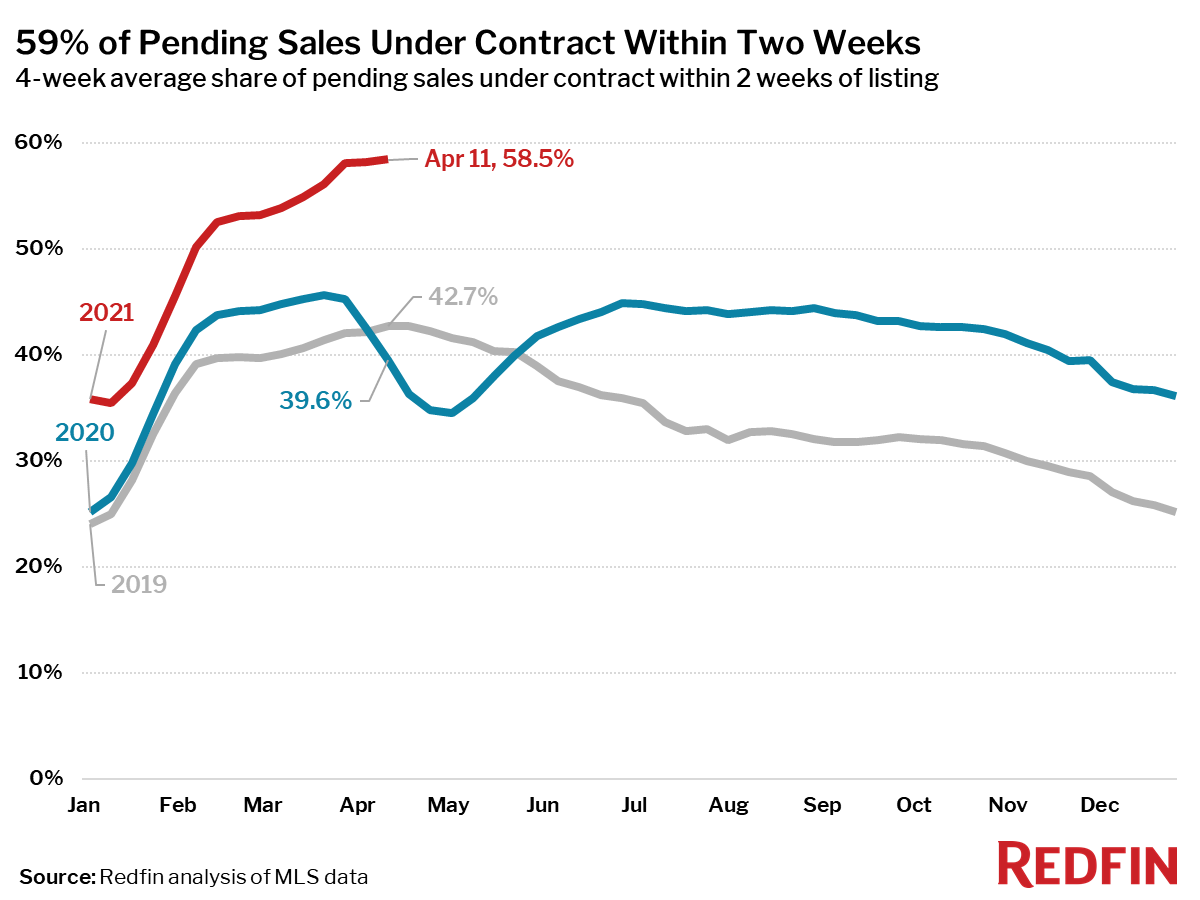
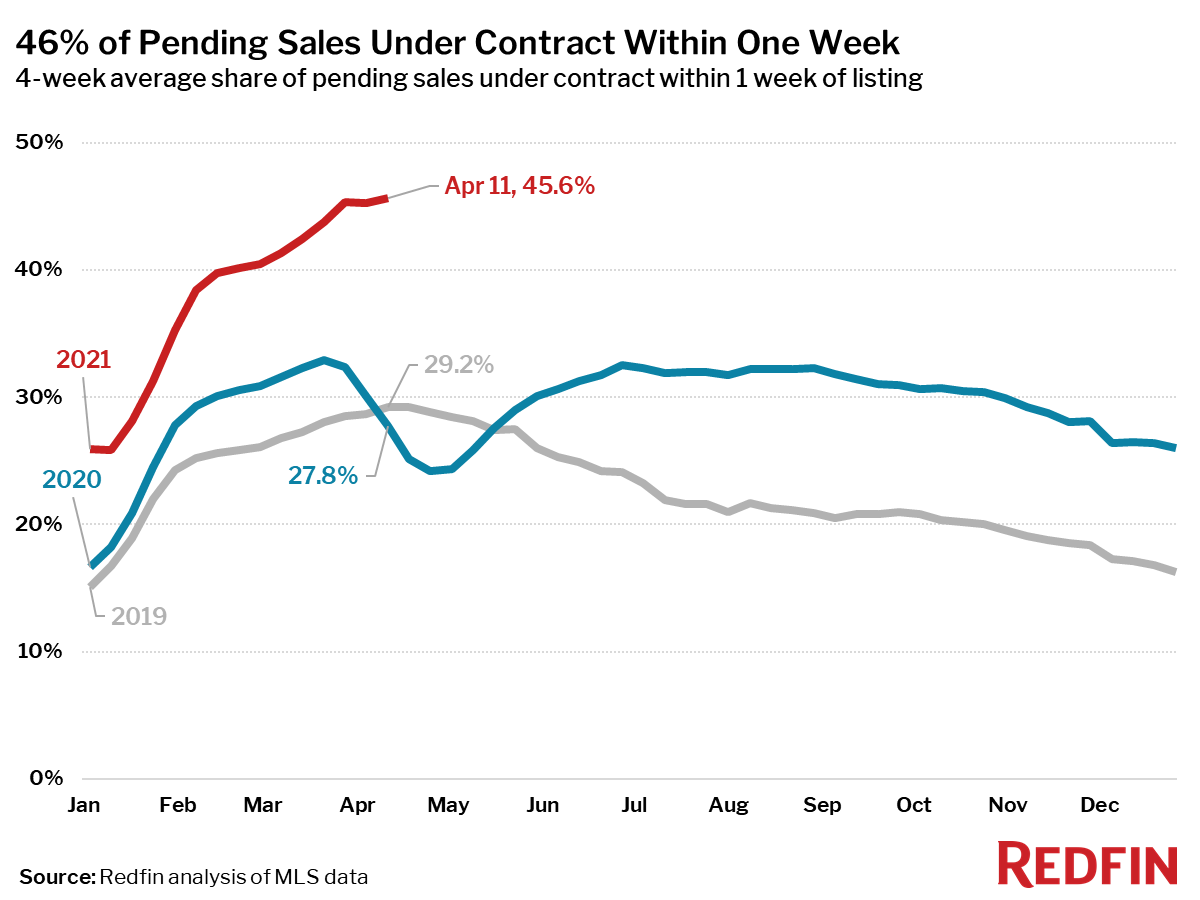
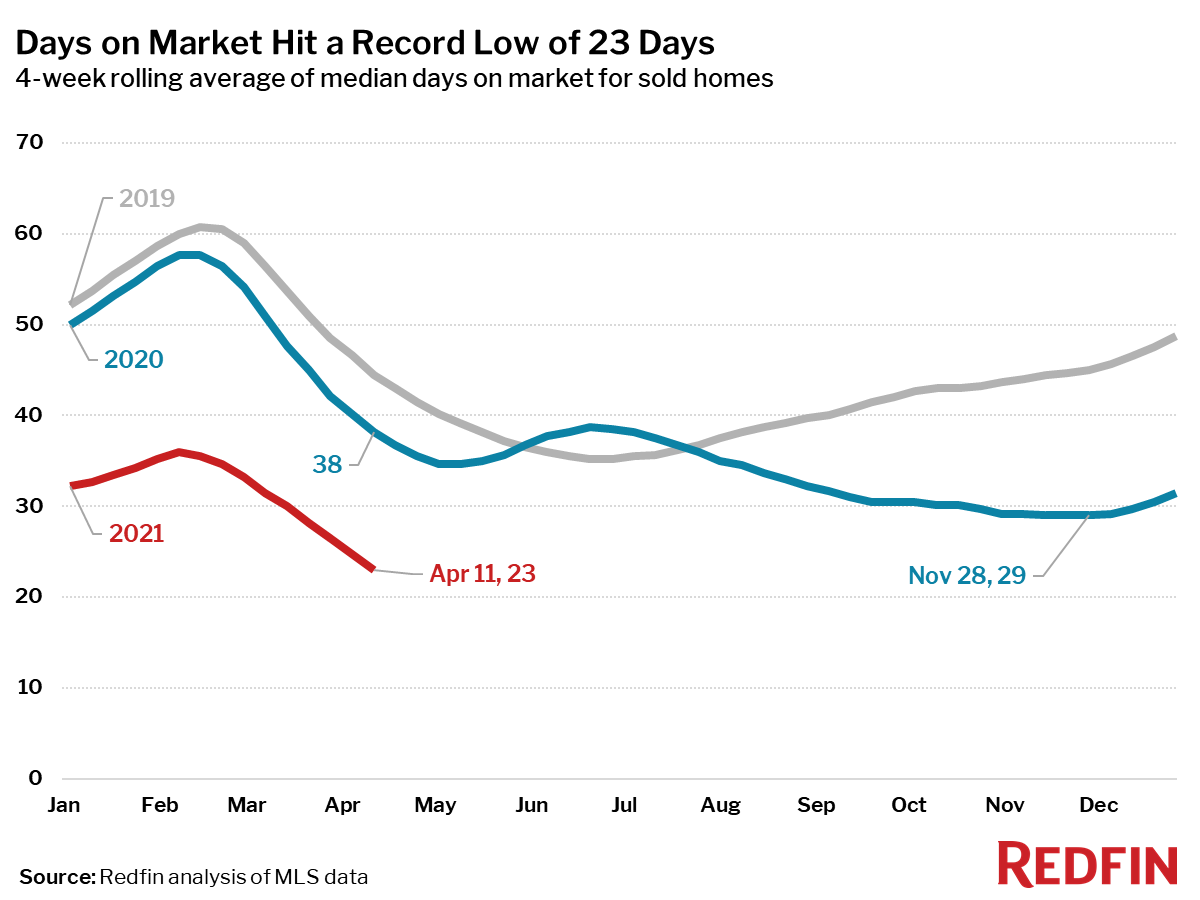
Metrics to compare to 2020:
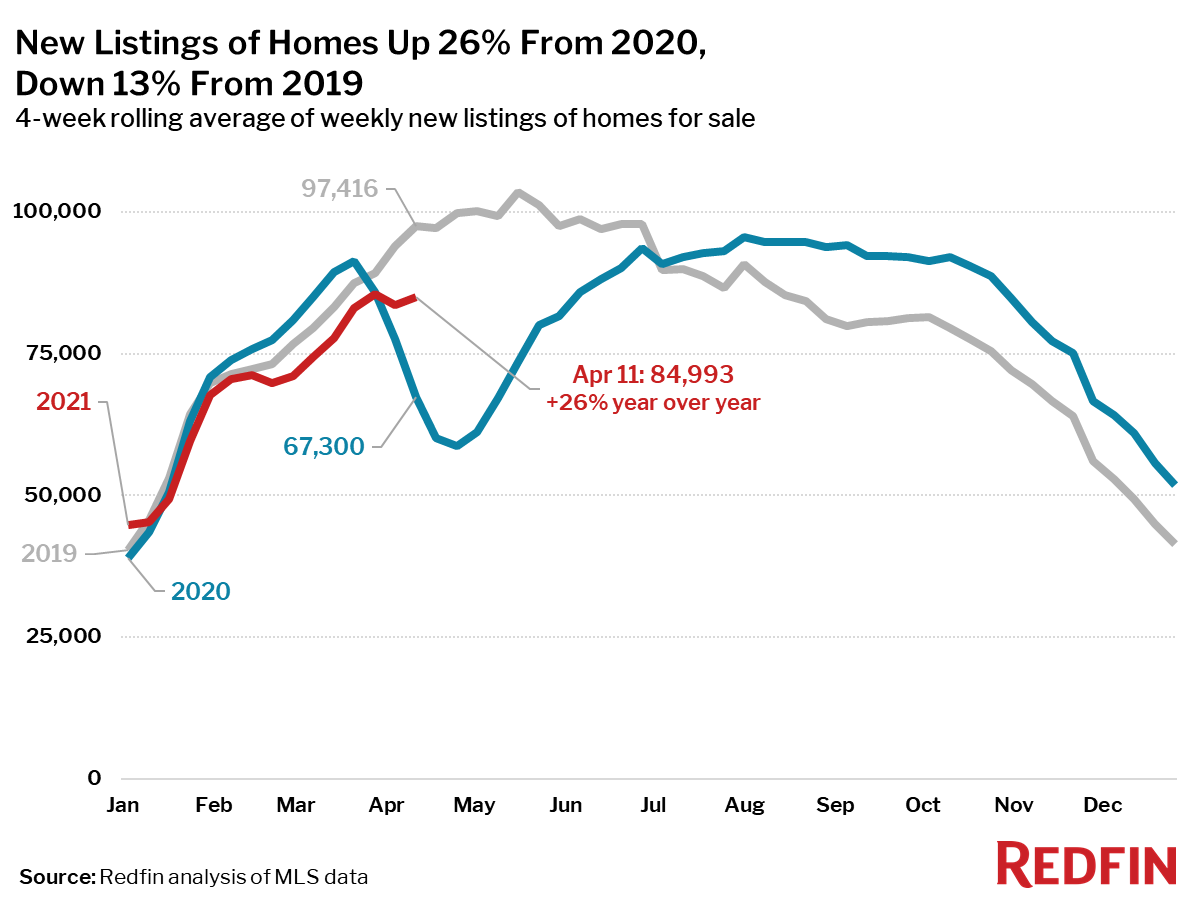
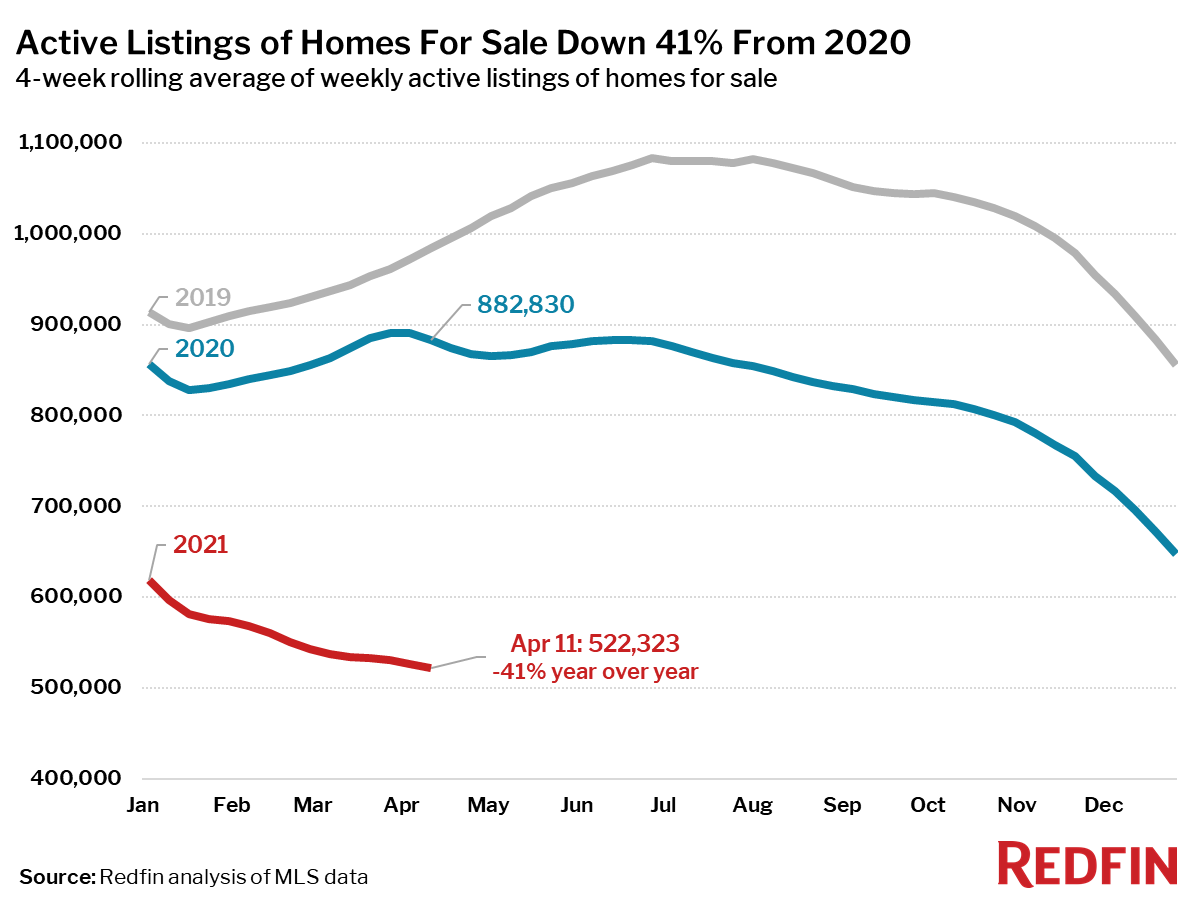
Metrics to compare to 2019:
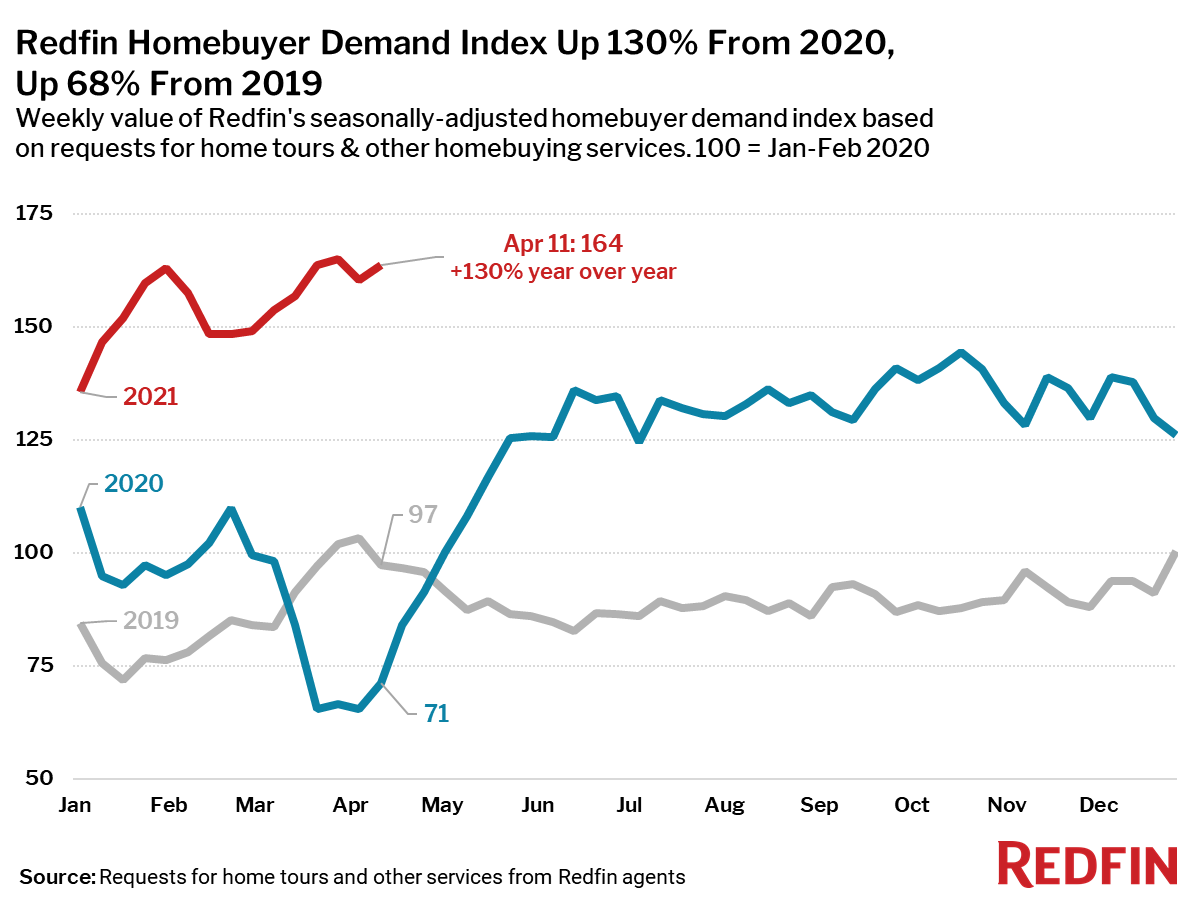
“The Easter holiday may have contributed to the latest decline in new listings, as many Americans were spending time with family instead of putting their homes on the market. The overall lack of homes for sale is limiting how much home sales can grow,” said Redfin Lead Economist Taylor Marr. “However, Redfin’s homebuyer demand index is up 4.3% from a month ago, revealing that house hunters are still out in full force. They’re jumping on low mortgage rates, which are sliding back down toward 3%, and bidding up prices of the homes that do hit the market. The good news for buyers is that they should start to see more homes listed now that Easter is behind us.”
Refer to our metrics definition page for explanations of all the metrics used in this report.