U.S. home prices are up 3% year over year despite relatively slow demand. That’s due to a shortage of homes for sale, with inventory posting its biggest drop in over a year and a half.
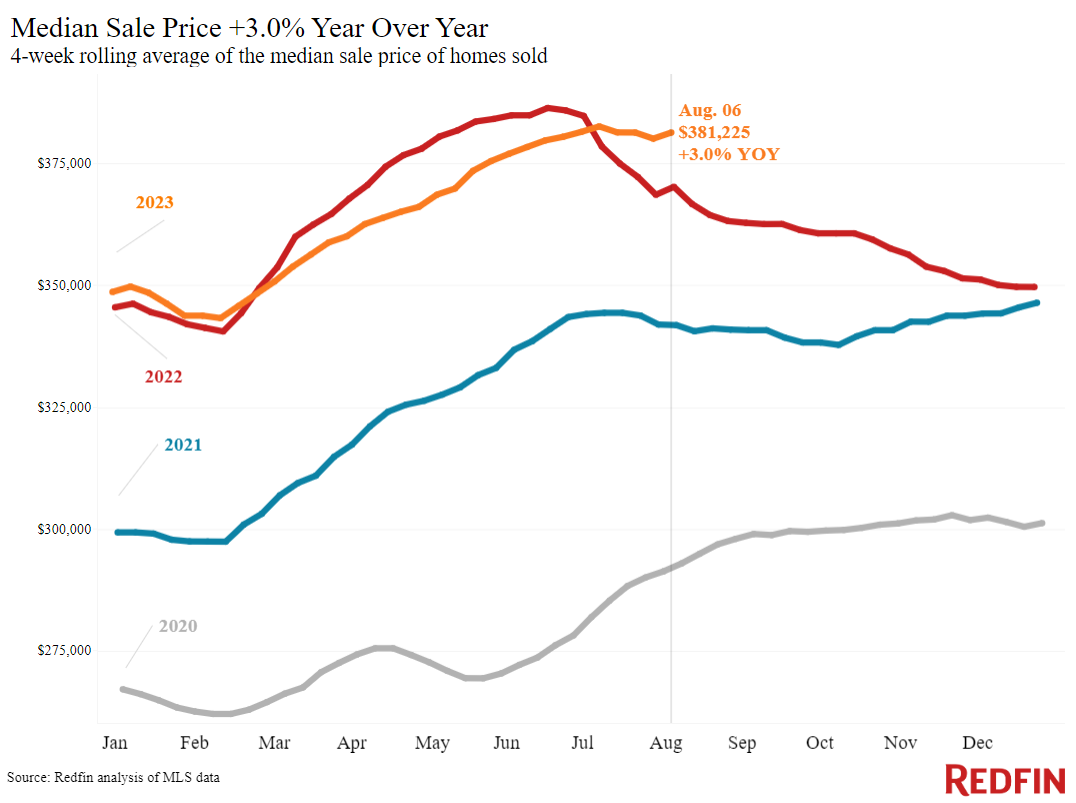
The median U.S. home-sale price rose 3% year over year during the four weeks ending August 6, the biggest increase since November. Prices are rising much more in certain parts of the country, with double-digit increases in Miami and Milwaukee.
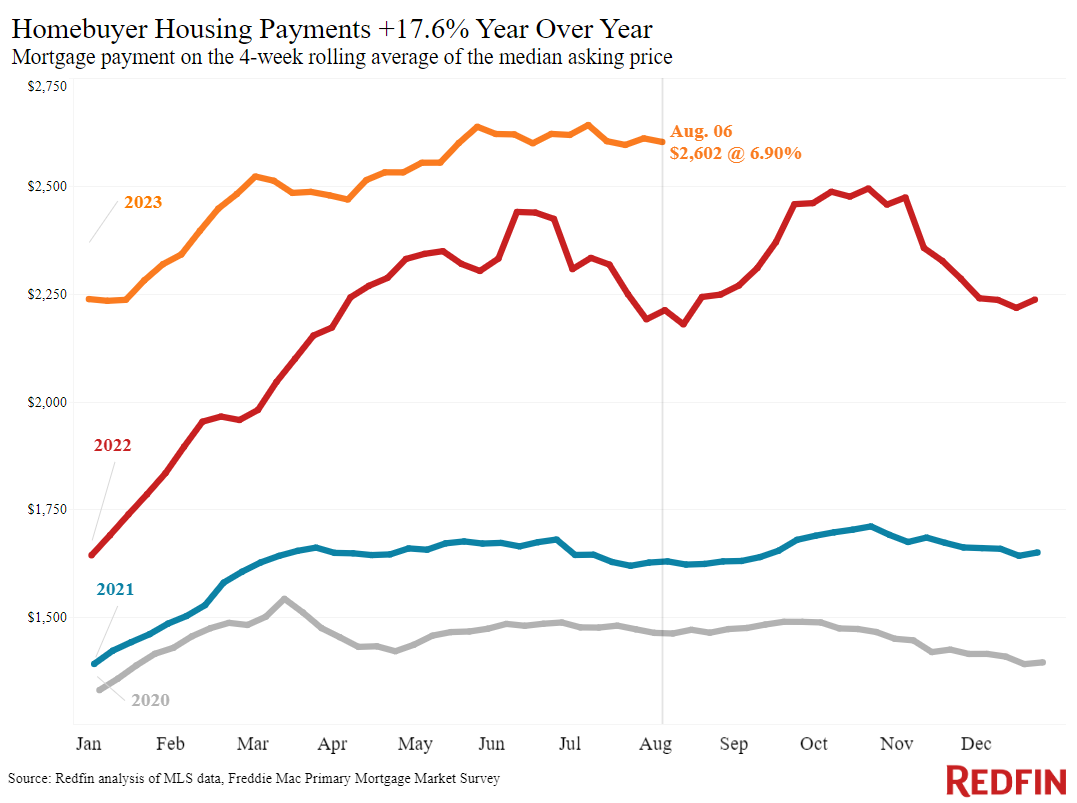
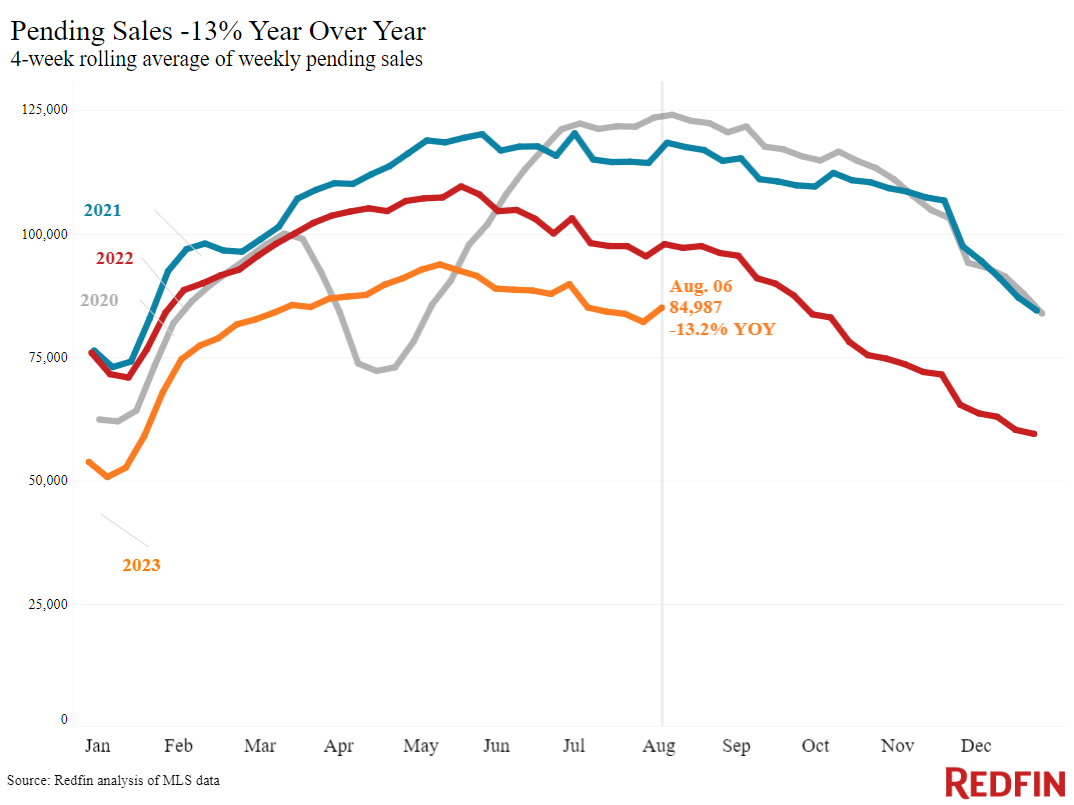
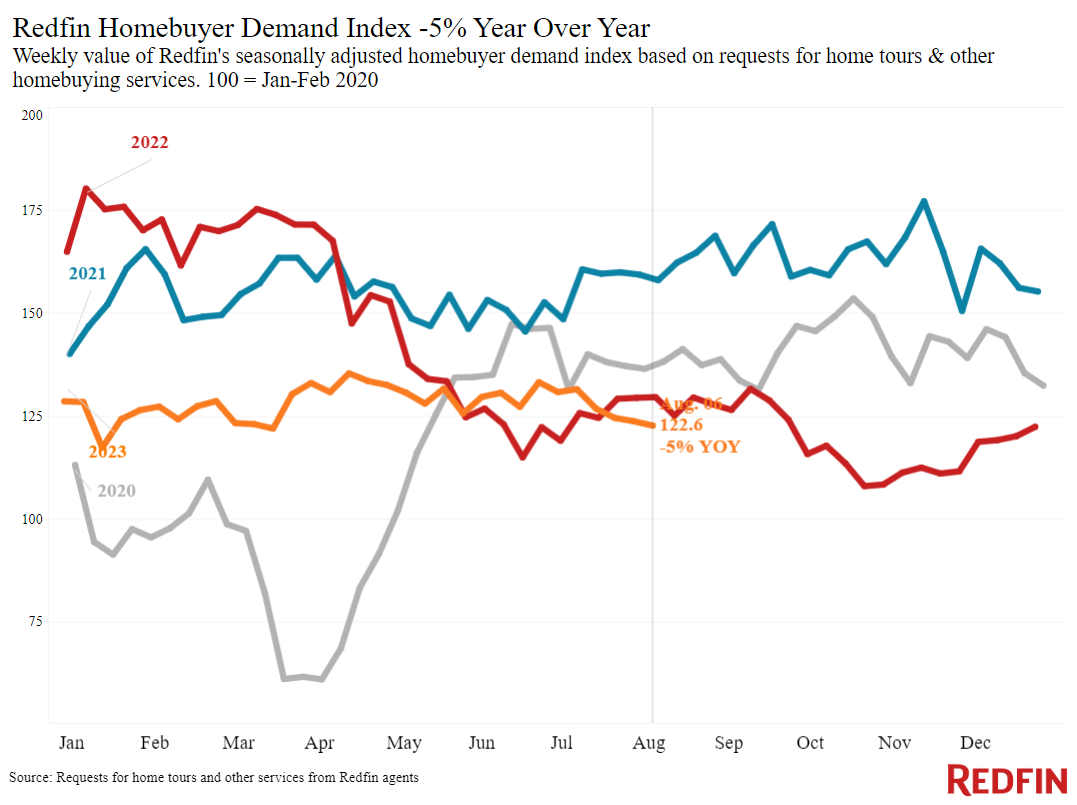
Prices are increasing despite tepid homebuying demand, with some buyers still sidelined by stubbornly high mortgage rates: They’re hovering around 7%, up from a 3% average in 2021 and a 5.3% average in 2022. Redfin’s Homebuyer Demand Index, which measures early-stage demand through requests for tours and other buying services from Redfin agents, is down 5% from a year ago to its lowest level since March. Mortgage-purchase applications are down 27% from a year ago, also reaching their lowest level since March.
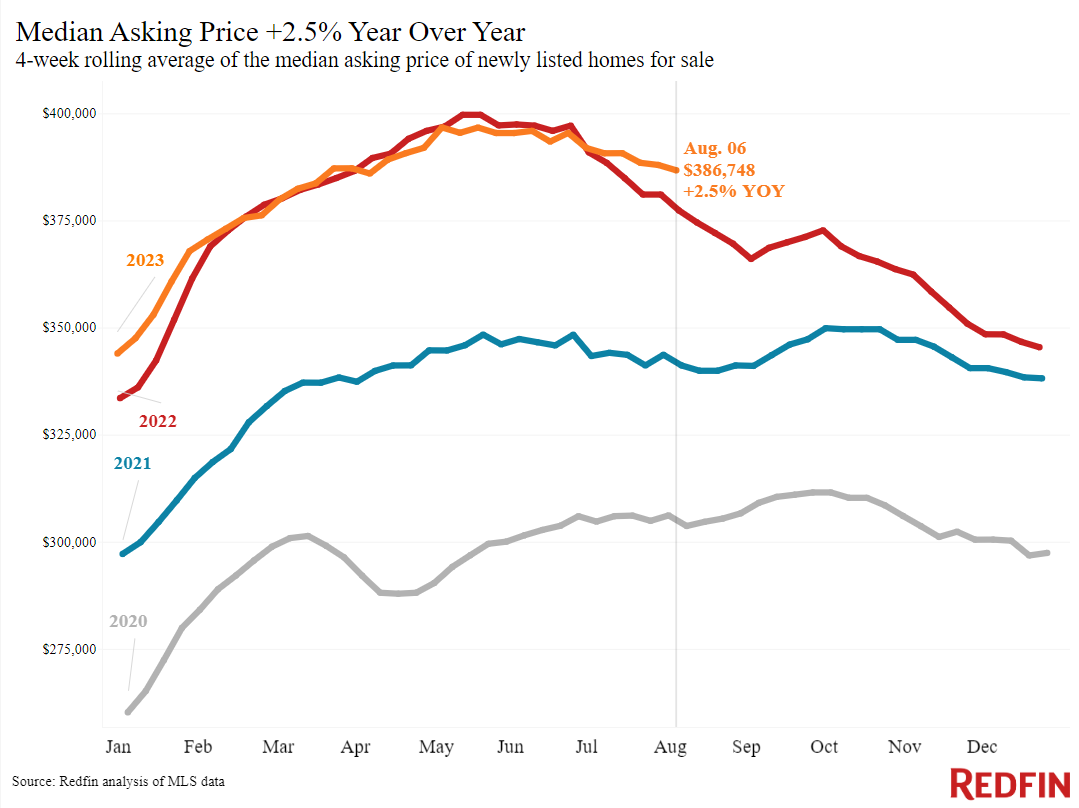
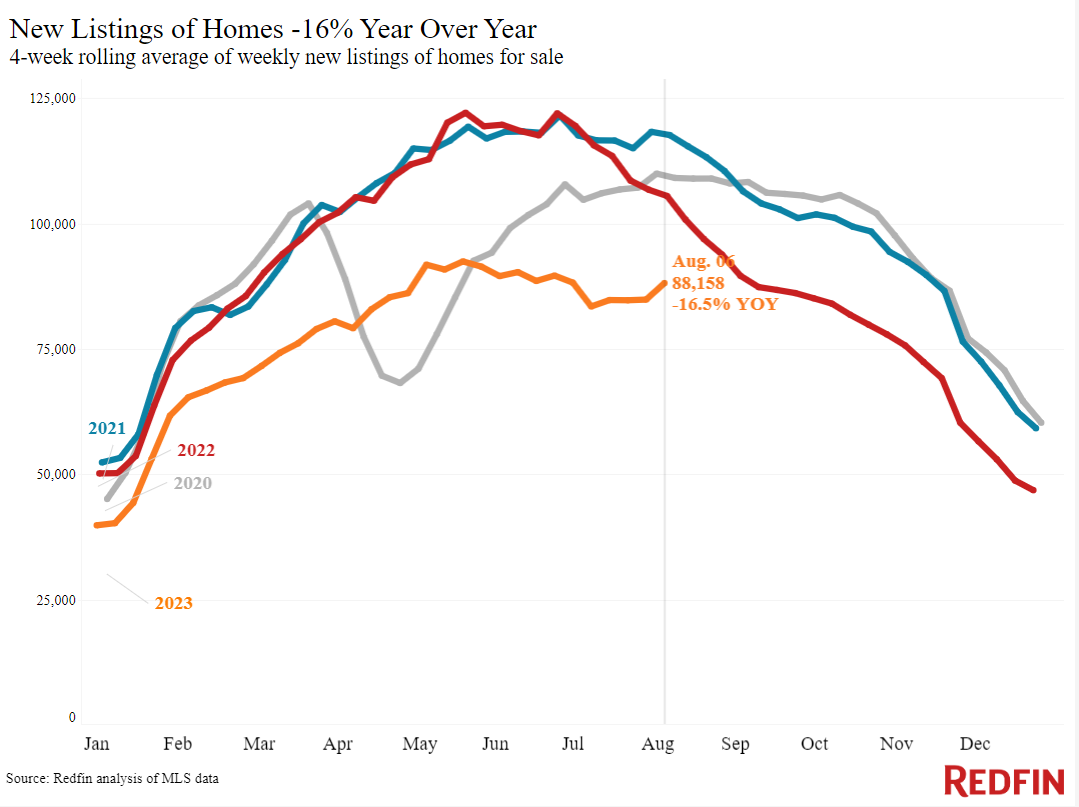
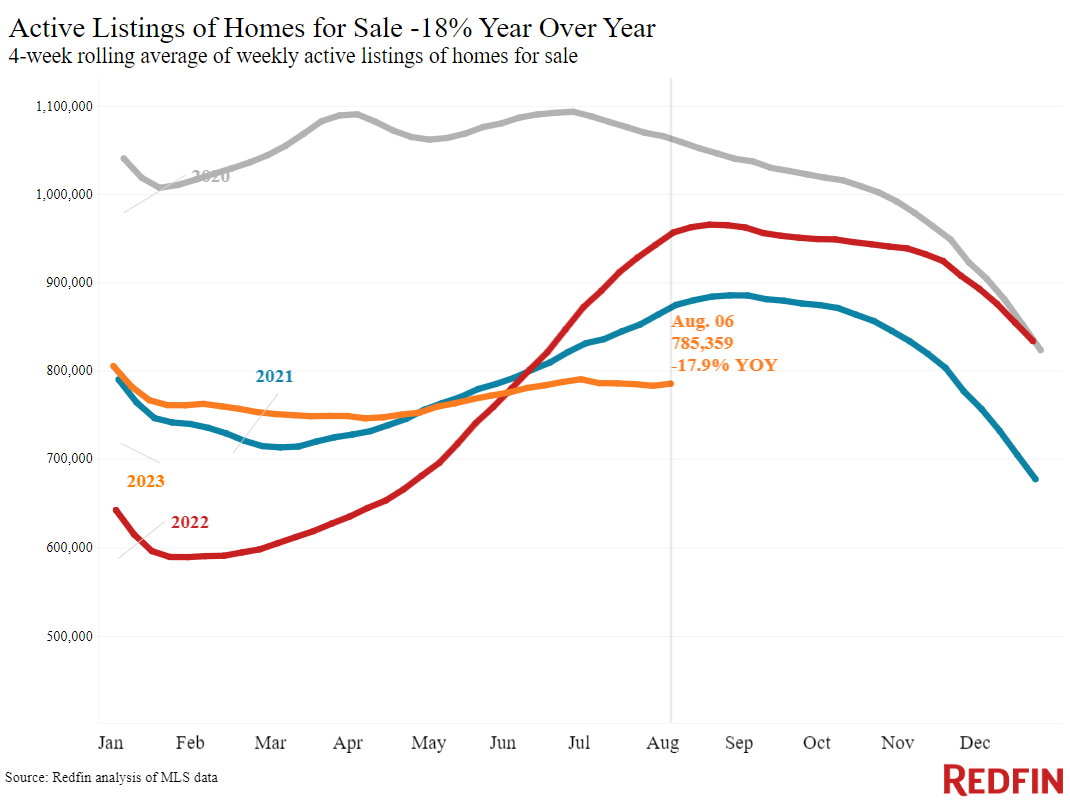
Limited inventory is pushing prices up, with so few homes for sale that there are more house hunters than homes on the market in much of the country. The total number of homes for sale is down 18% year over year, the biggest drop since the start of 2022, and new listings are down 16%, with homeowners staying put to hold onto their relatively low mortgage rate. It’s worth noting that another reason prices are up on an annual basis is that they were coming down from an all-time high at this time last year.
“There’s a fair amount of demand for lower-priced single-family homes, which in this area means around $400,000 and under,” said Spokane, WA Redfin Premier agent Brynn Rea. “Buyers are looking for a deal to make up for high mortgage rates. That means the few move-in ready, relatively affordable homes on the market are selling fast, sometimes with multiple offers. But today’s bidding wars usually involve two or three offers, as opposed to the five to 10 offers we were seeing a year and a half ago–and many higher-priced homes are sitting on the market because it’s hard to afford today’s monthly payments.”
Unless otherwise noted, the data in this report covers the four-week period ending August 6. Redfin’s weekly housing market data goes back through 2015.
For bullets that include metro-level breakdowns, Redfin analyzed the 50 most populous U.S. metros. Select metros may be excluded from time to time to ensure data accuracy.
Refer to our metrics definition page for explanations of all the metrics used in this report.