The typical home is taking longer to sell than any period since April 2020 and pending sales are at a record low, but online home searches and tour requests are ticking up. Those early signs of demand could translate into sales–especially as mortgage rates fall from their peak and inflation cools.
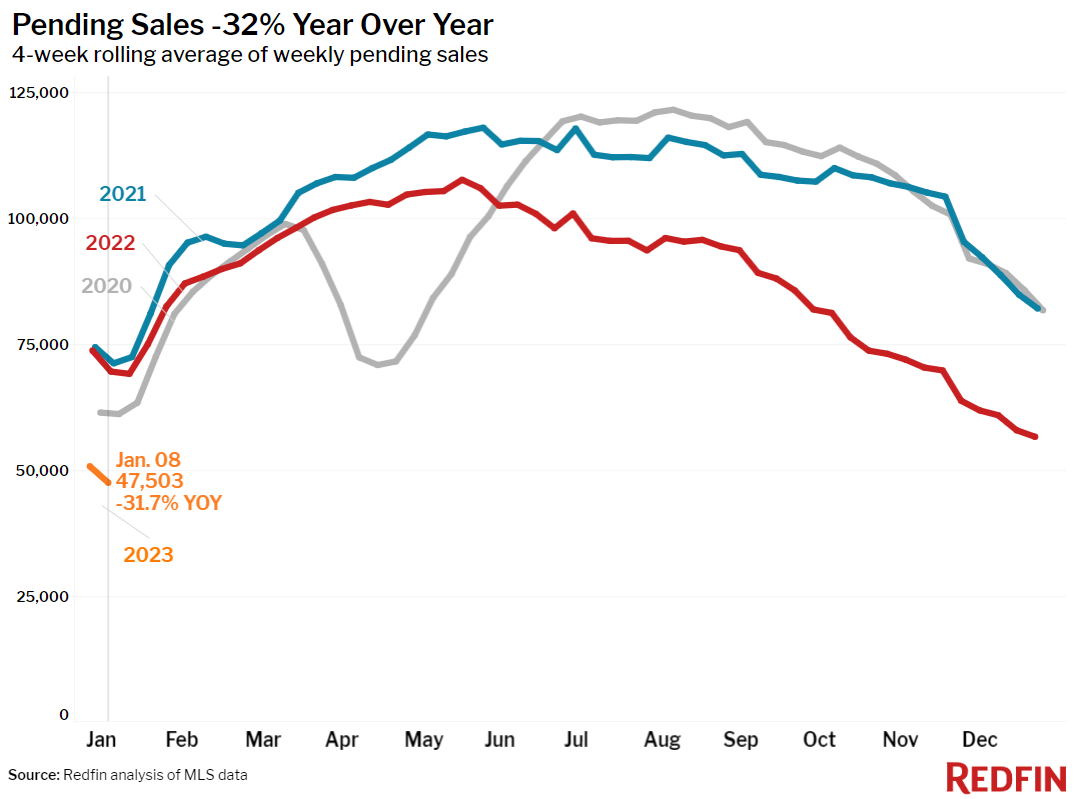
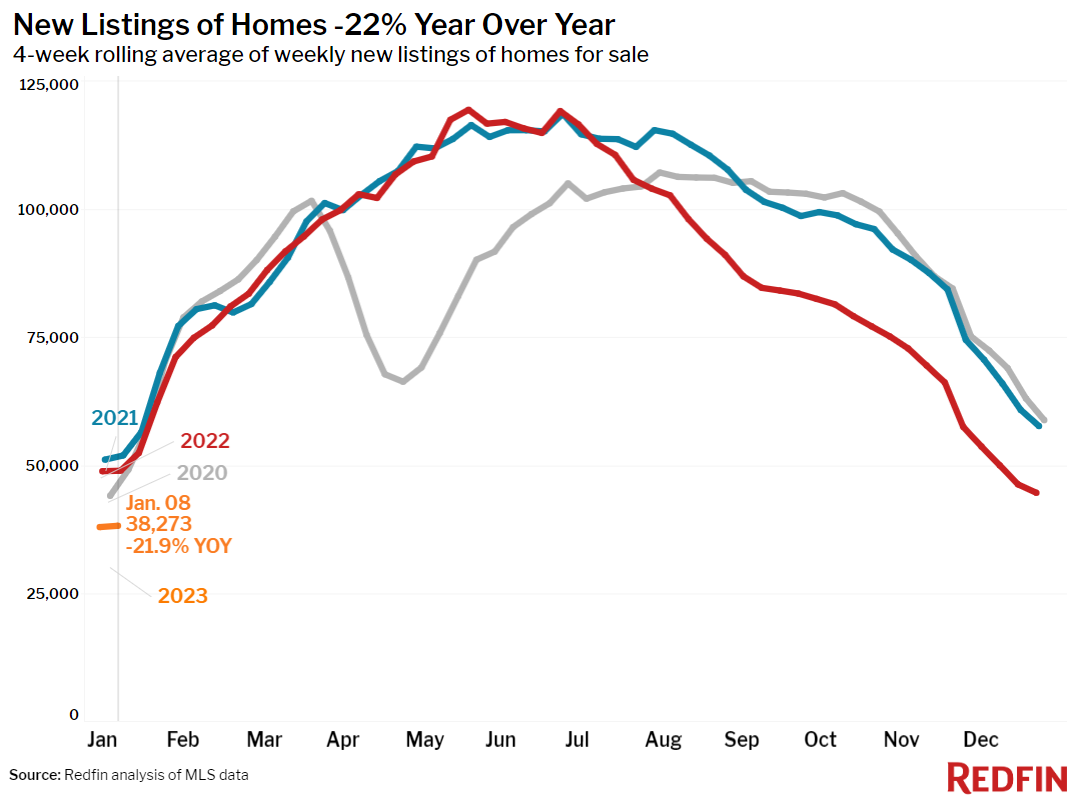
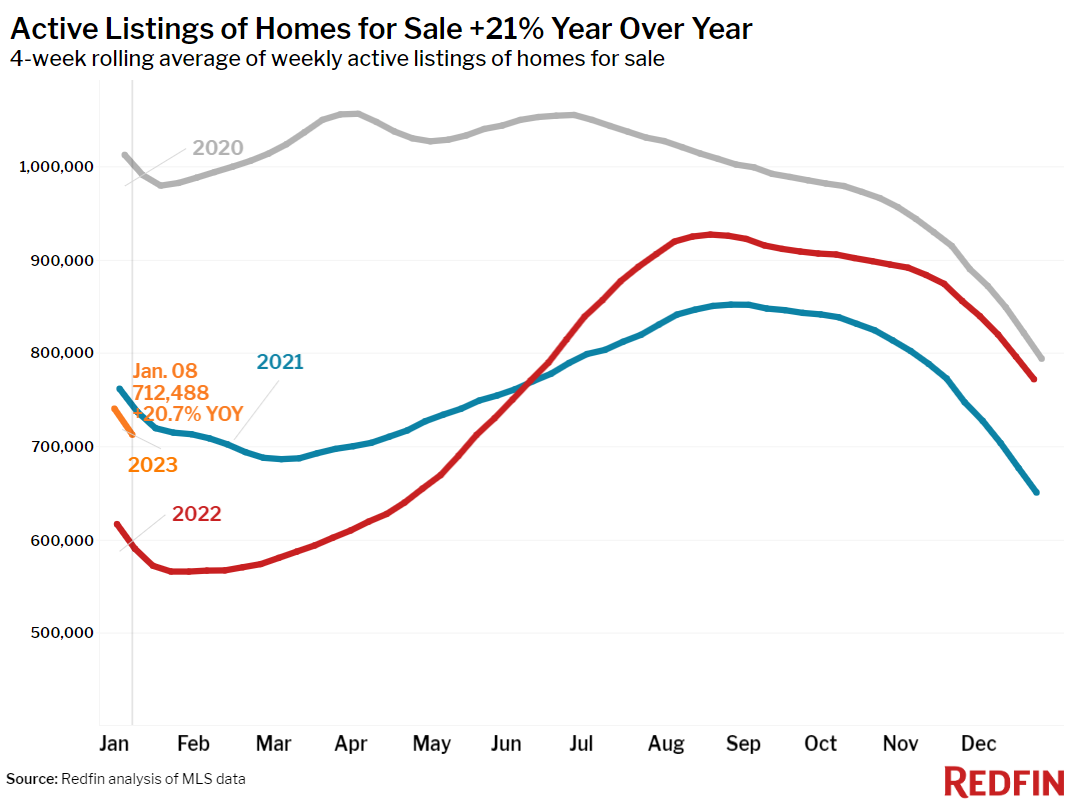
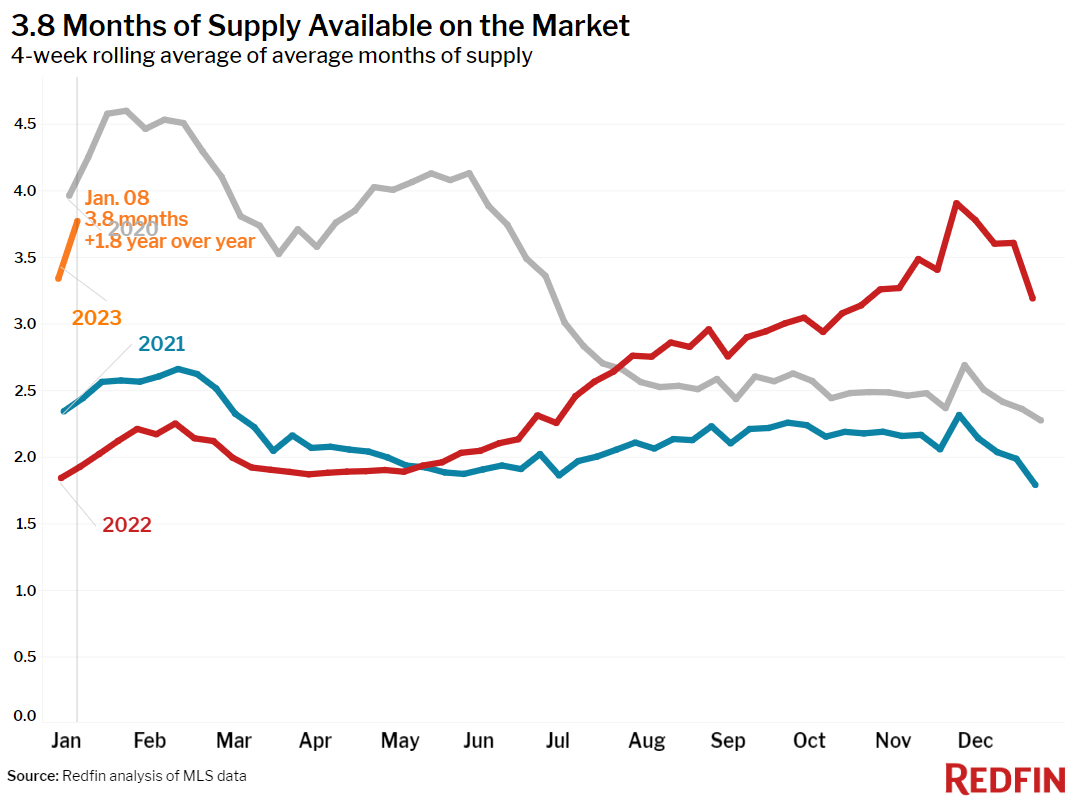
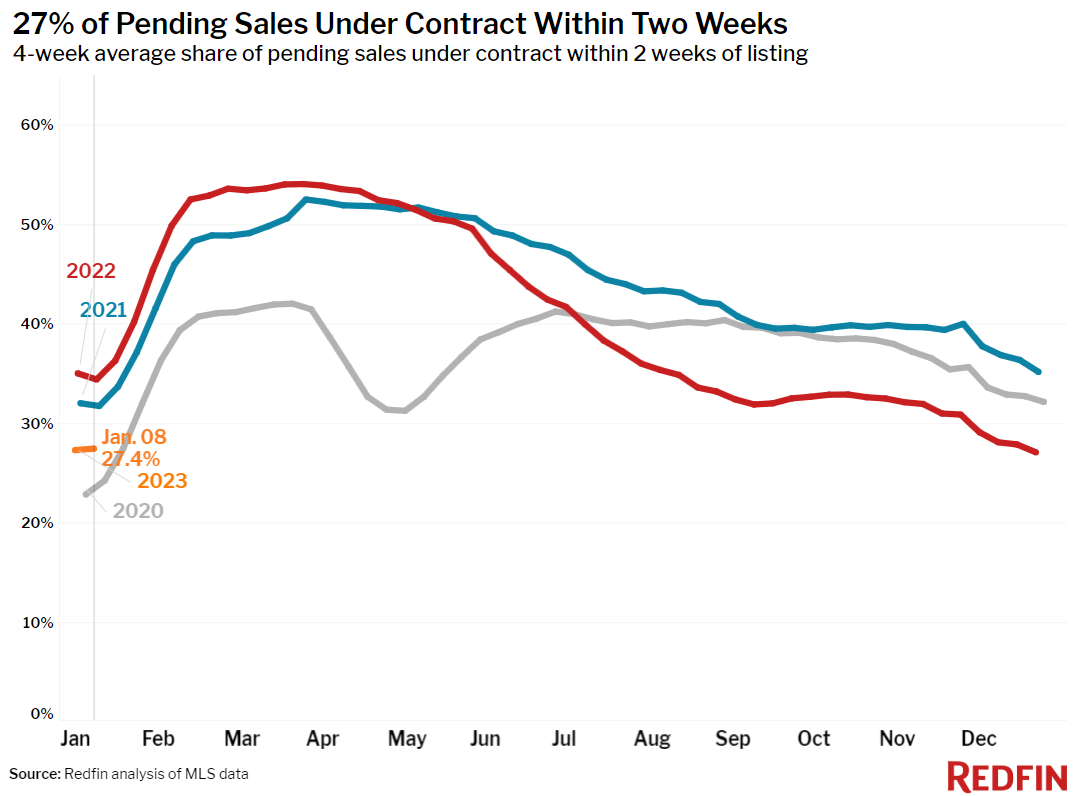
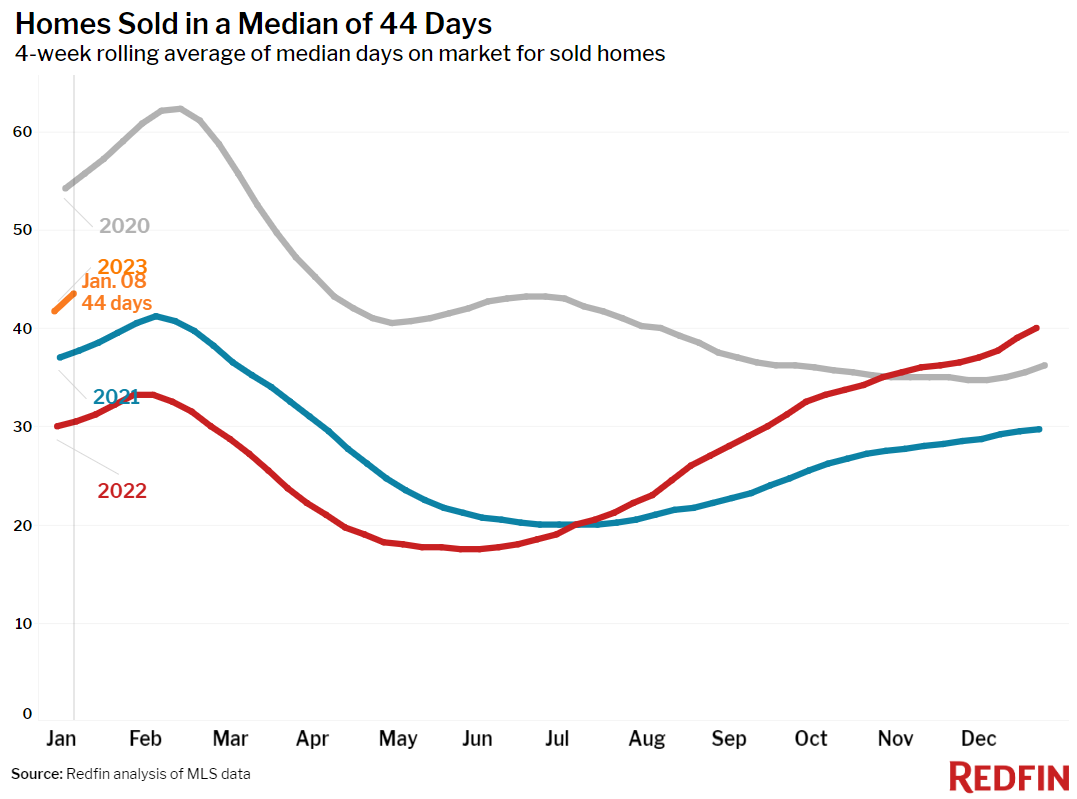
Homes are selling at their slowest pace since the housing market nearly ground to a halt at the beginning of the pandemic. The typical home that sold during the four weeks ending January 8 was on the market for 44 days, the longest timespan since April 2020, contributing to the biggest annual inventory increase on record. Pending home sales dropped 32% year over year to their lowest level on record and mortgage-purchase applications dropped to their lowest level since 2014.
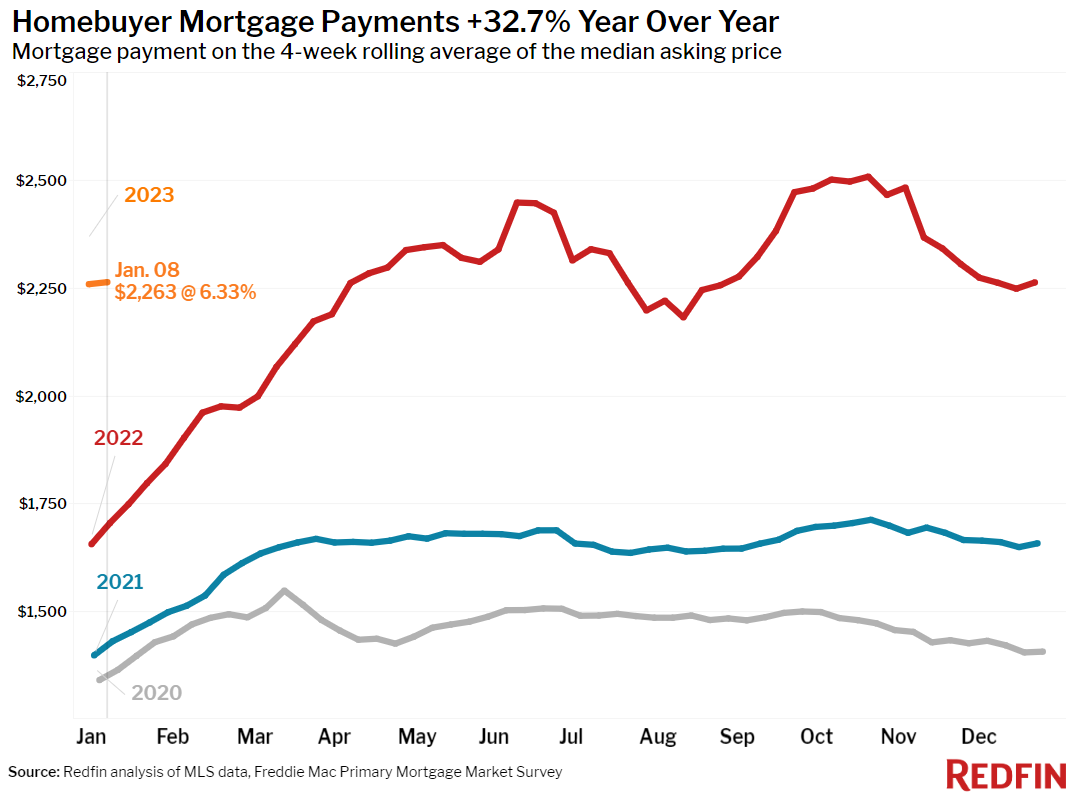
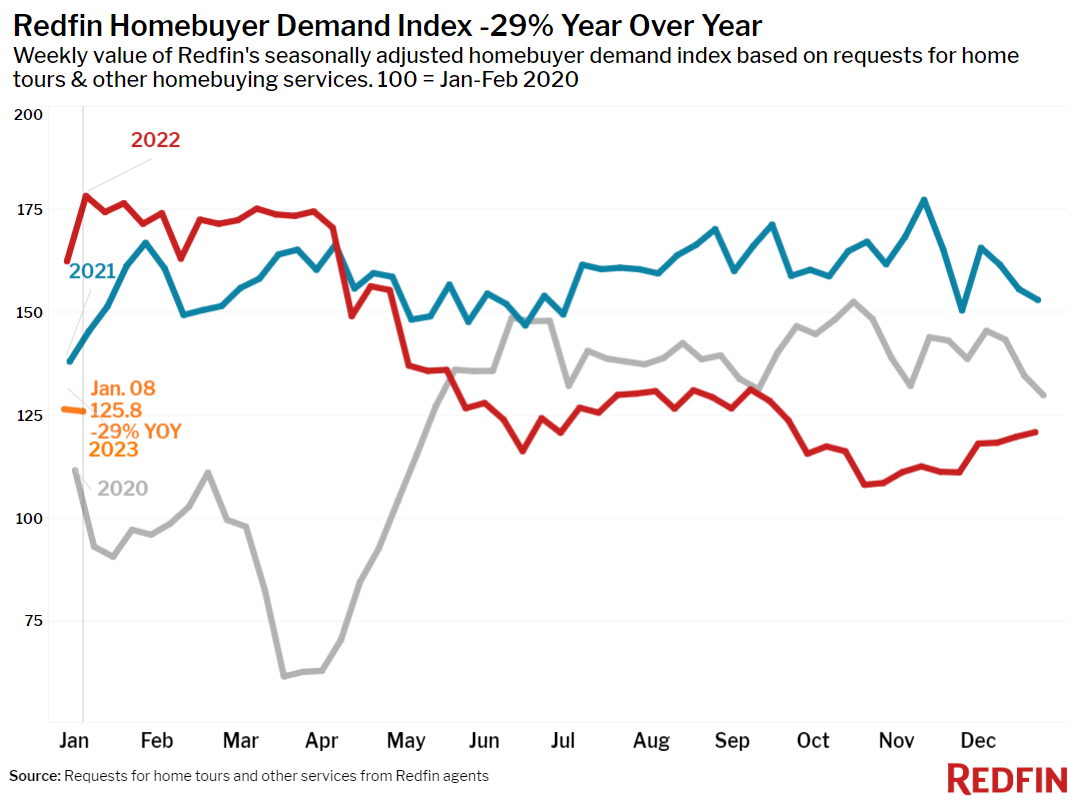
High mortgage rates and extreme winter weather at the start of the year deterred would-be homebuyers, exacerbating the typically holiday slowdown. But there are signs that early-stage demand is up. Redfin’s Homebuyer Demand Index–a measure of tour requests and other buying services from Redfin agents–posted a 6% increase over the last month, and Google searches for “homes for sale” are on the rise. Some buyers are likely coming in from the sidelines because mortgage rates have dropped to 6.33% from their November peak of over 7%, saving the typical U.S. homebuyer roughly $250 on monthly housing payments.
Buyers may also be encouraged by signs of improvement in the economy, with inflation easing in December for the sixth month in a row as wage growth softens.
“We’re entering 2023 with positive economic news: The latest consumer price index report confirms that the worst of inflation is behind us. That means the Fed is likely to continue easing its interest-rate increases, which should cause mortgage rates to continue gradually declining. This could bring back some homebuyers in the coming months,” said Redfin Deputy Chief Economist Taylor Marr. “We’ve already seen an uptick in people initiating home searches. Although those house hunters haven’t yet turned into buyers, they may soon given that monthly mortgage payments are notably down from their peak and the latest inflation and employment data lower the chances of a recession.”
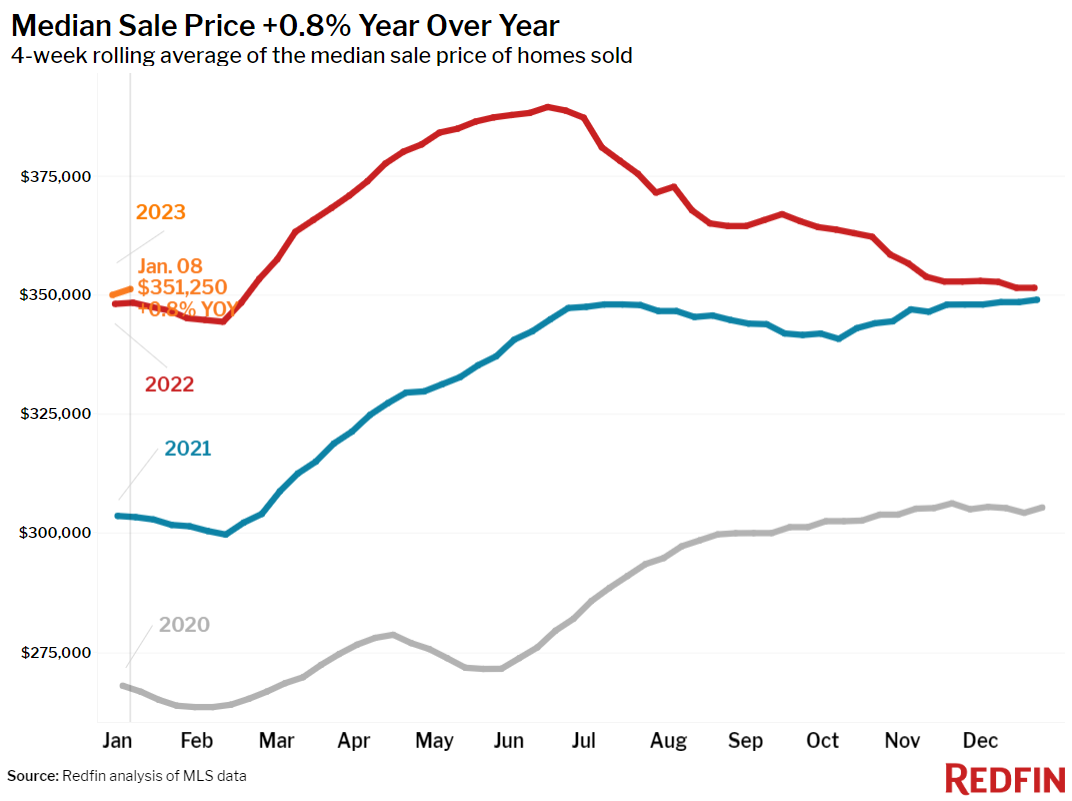
The typical U.S. home sold for $351,250 during the four weeks ending January 8. That’s up 0.8% from a year earlier, but down about 10% from the June peak.
Home-sale prices fell year over year in 20 of the 50 most populous U.S. metros. By comparison, 11 metros saw price declines a month earlier.
Prices fell 10.6% year over year in San Francisco, 5% in Seattle, 4.9% in San Jose, 4% in Austin, 3.8% in Detroit, 3.7% in Phoenix, 3.4% in Oakland, CA, 3% in Boston, 3% in Los Angeles, 3% in Sacramento, 2.6% in San Diego and 2.5% in Chicago. They fell 2% or less in Portland, OR, Anaheim, CA, Portland, OR, Riverside, CA, Newark, NJ, New York, Pittsburgh, Las Vegas and Washington, D.C.
This marks the first time Las Vegas prices have dropped year over year since at least 2015. It’s the biggest year-over-year price drop in San Francisco, Seattle, Phoenix, Chicago, Boston, Portland and San Diego since at least 2015.
Unless otherwise noted, the data in this report covers the four-week period ending January 8. Redfin’s weekly housing market data goes back through 2015.
Refer to our metrics definition page for explanations of all the metrics used in this report.