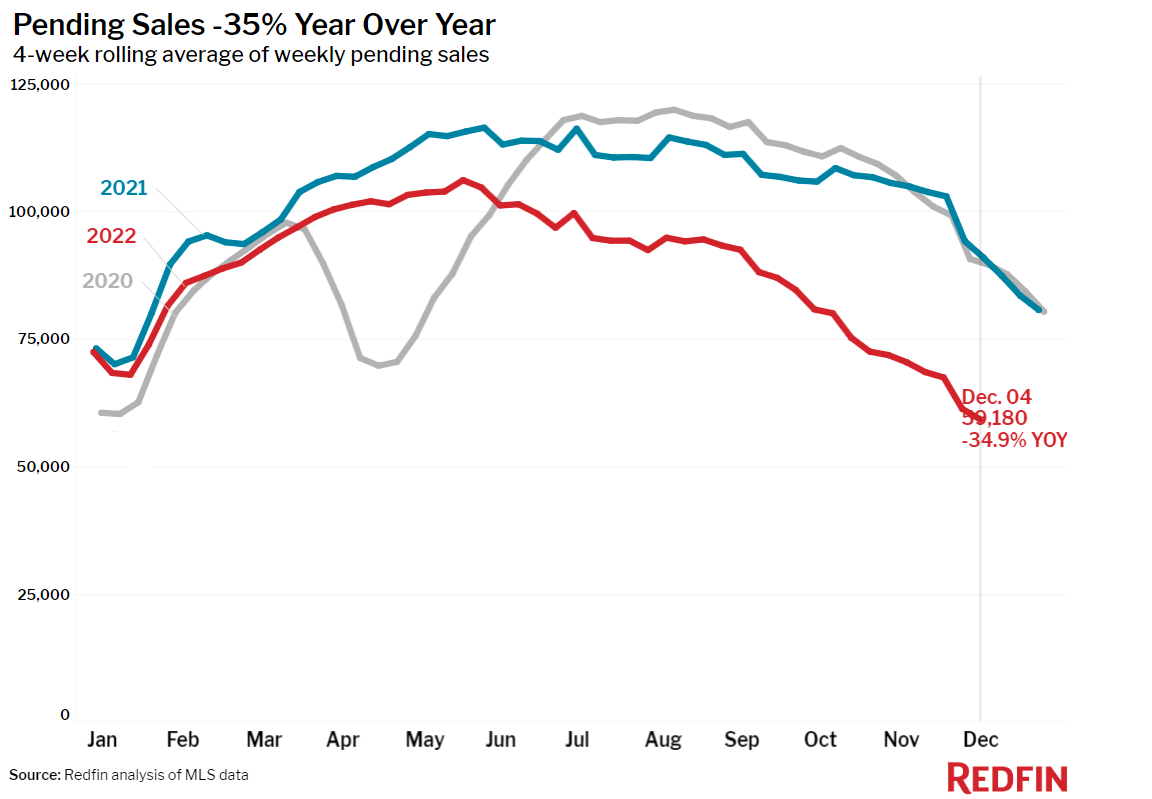
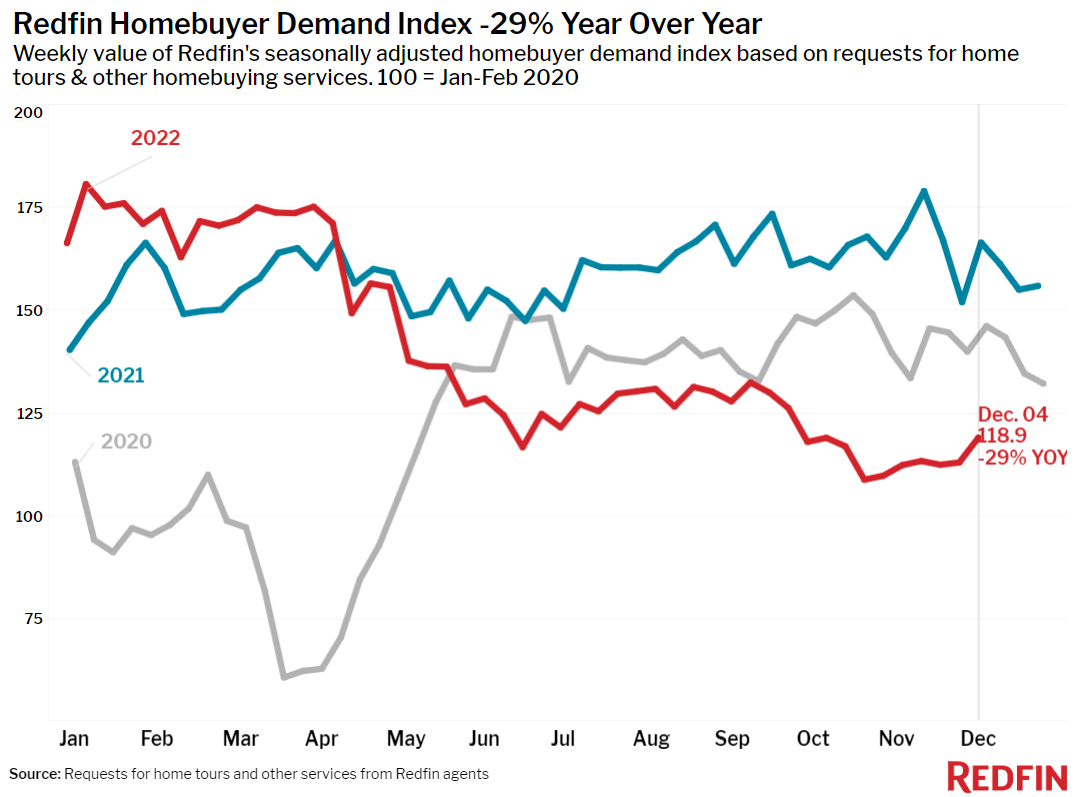
Redfin’s Homebuyer Demand Index ticked up this week as steadily declining rates lured some buyers back in. But many would-be buyers are waiting for lower rates and prices, with the typical home’s time on market rising at its fastest annual pace on record and supply increasing.
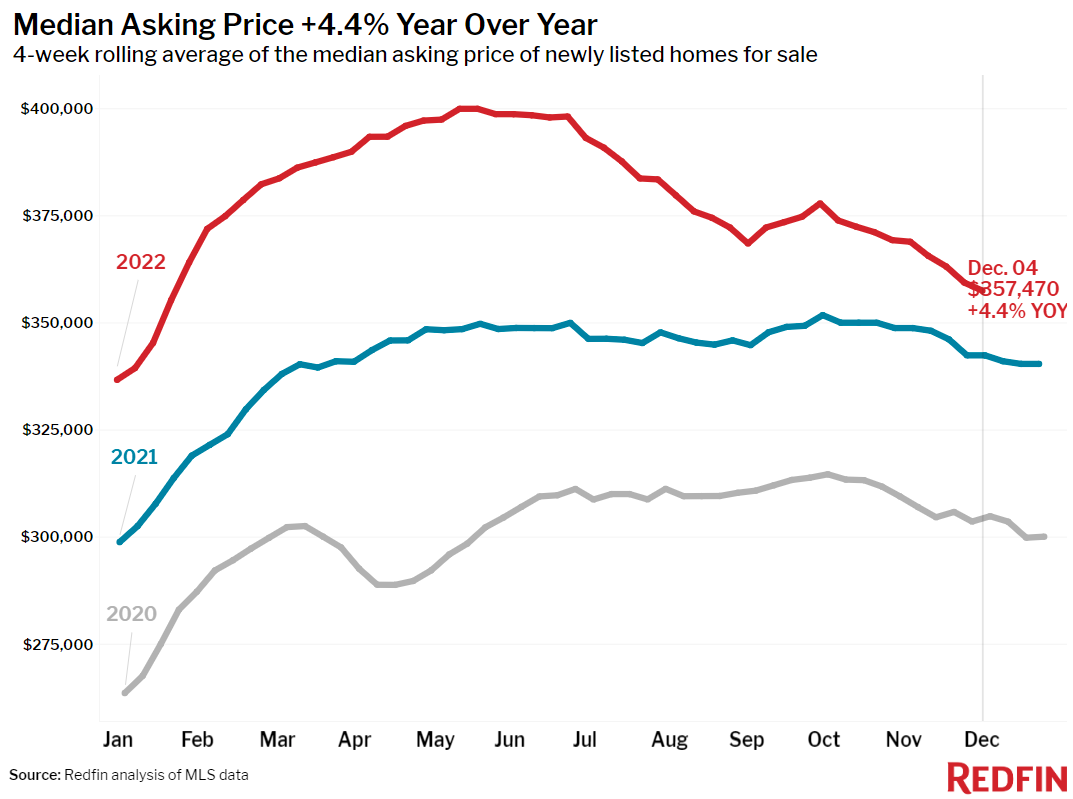
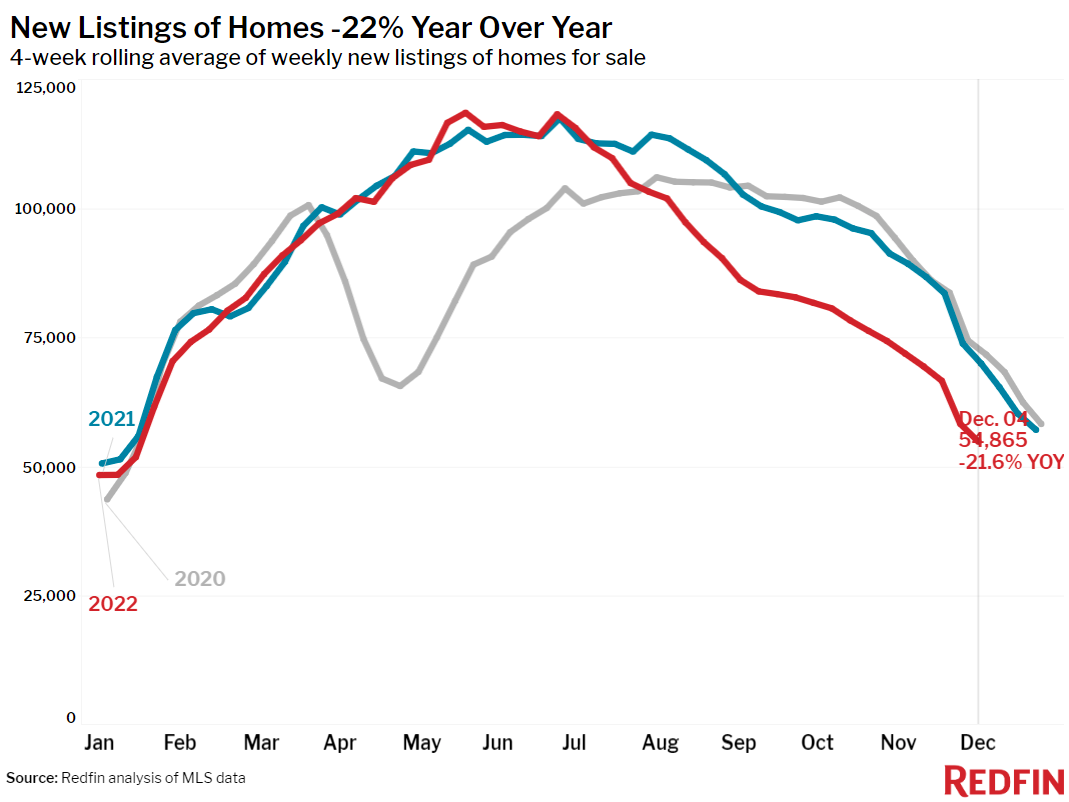
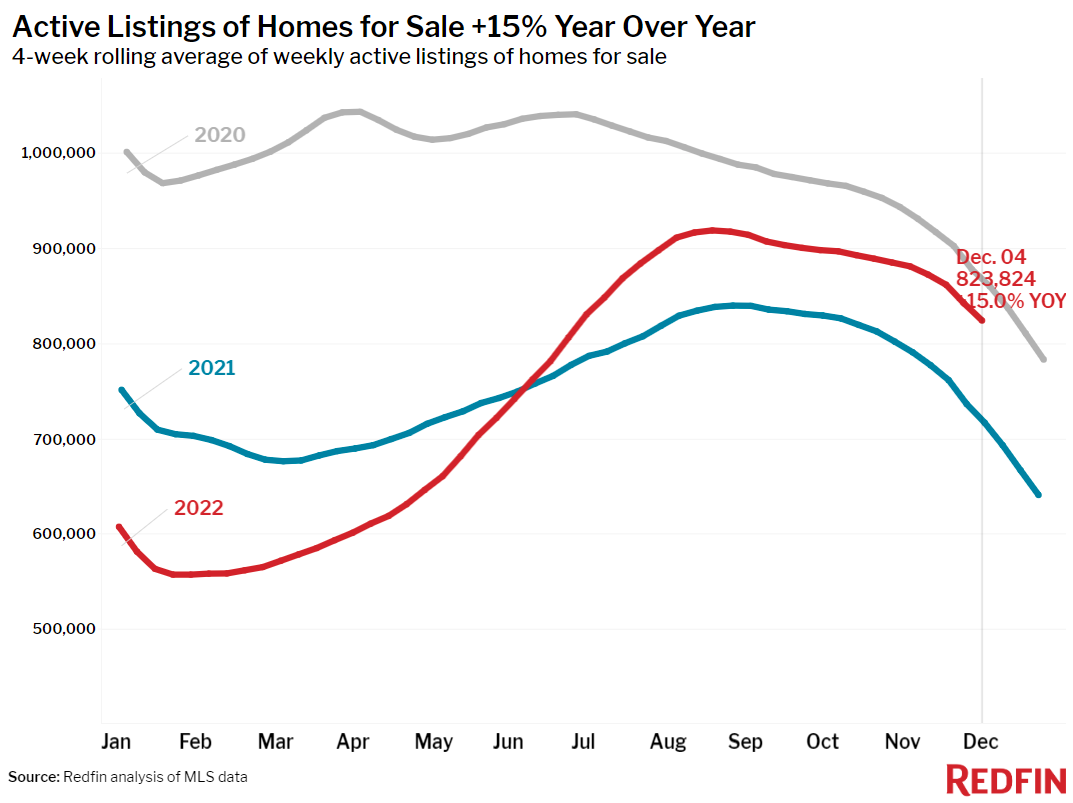
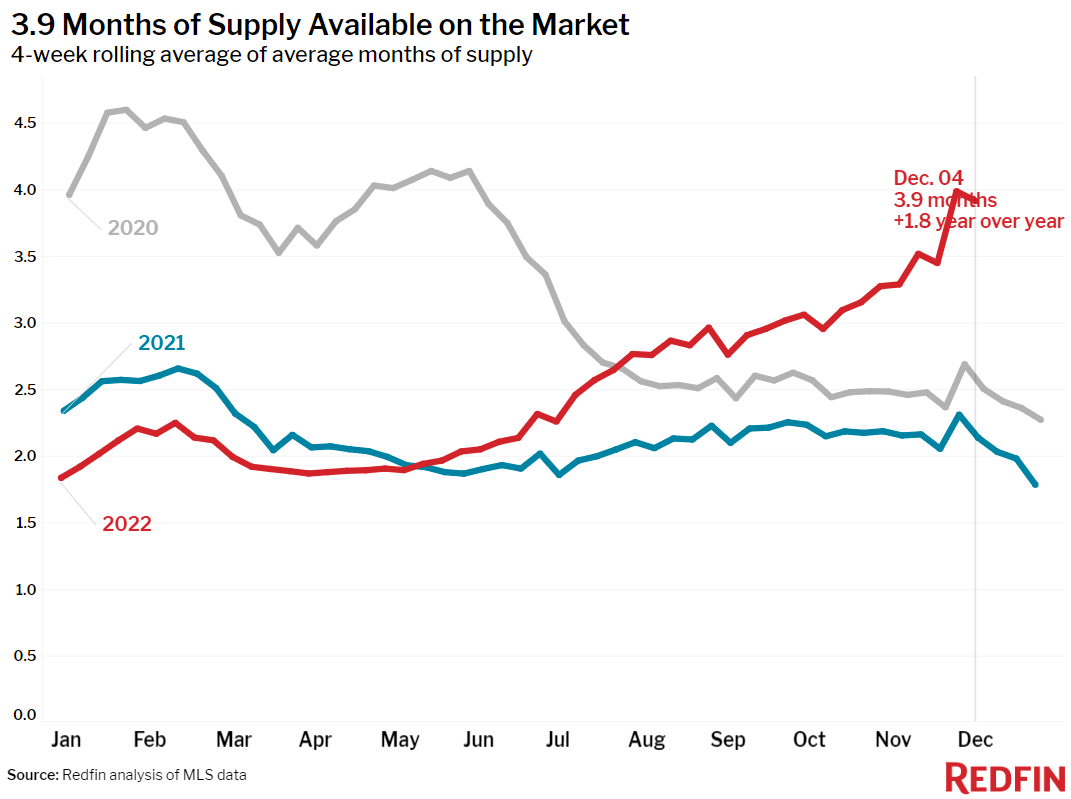
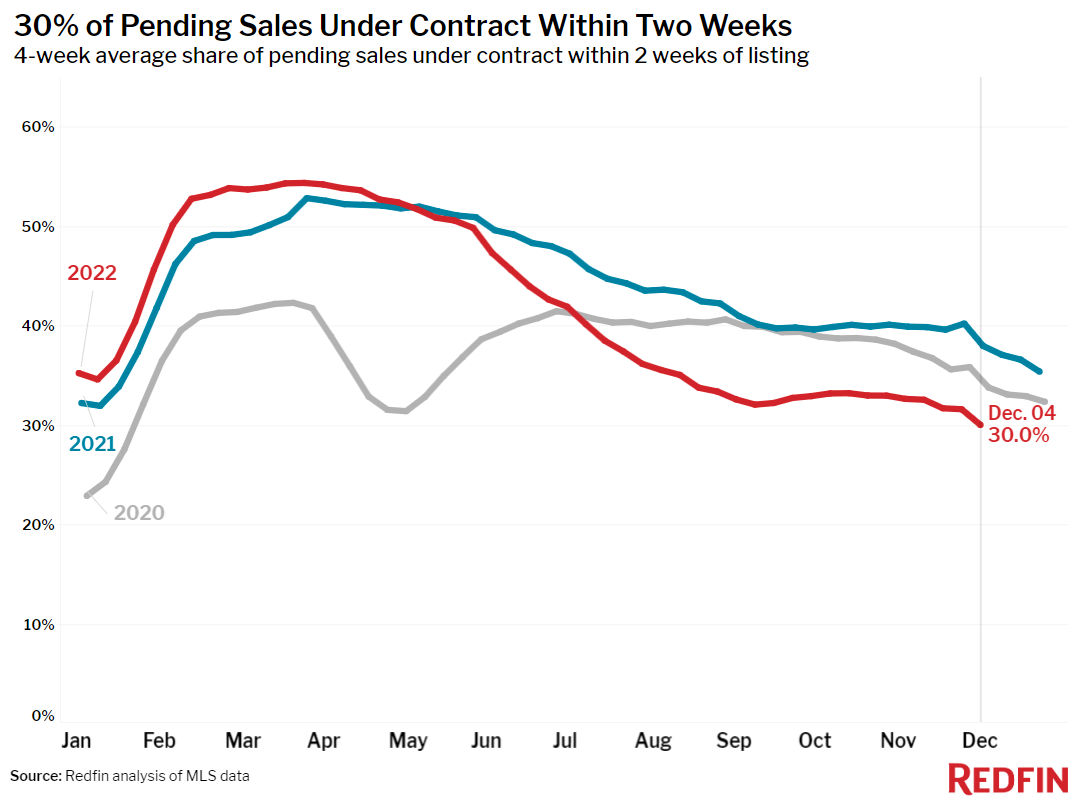
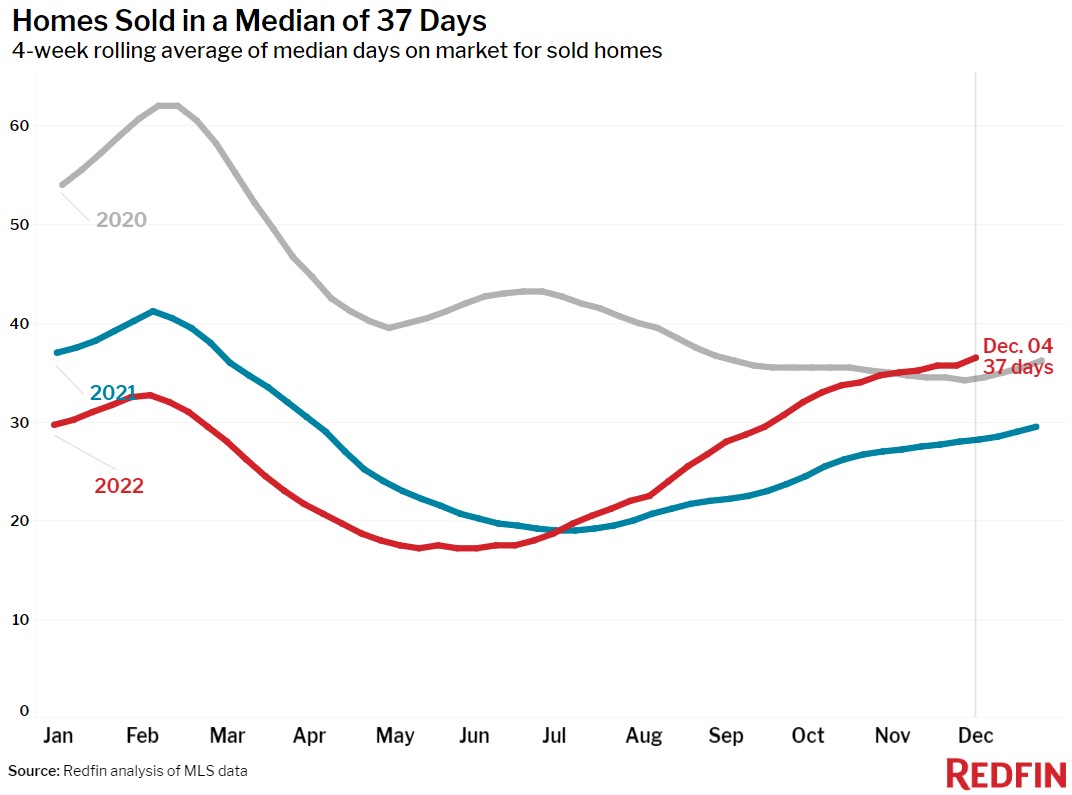
The total number of homes for sale increased 15% year over year during the four weeks ending December 4, the biggest uptick on record. But new listings declined by more than 20%, which means homes are sitting on the market as prospective buyers stay on the sidelines and wait for mortgage rates and home prices to decline further from their peaks. That’s also evidenced by a slowing market: The typical home that sold was on the market for 37 days, up from a record low of 17 days in June and up from 28 days a year earlier, the biggest year-over-year slowdown on record. Just 30% of homes sold within two weeks, the lowest share since January 2020.
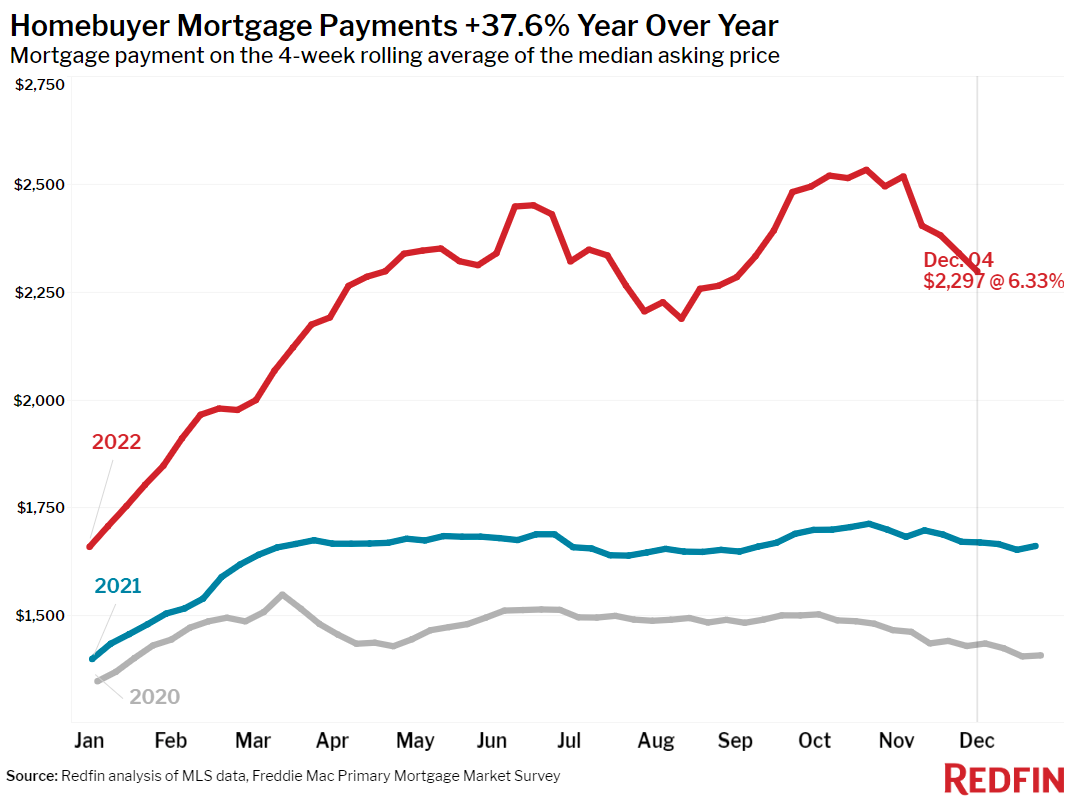
But Redfin’s Homebuyer Demand Index is rebounding from its low point, up 5% from a week earlier, as mortgage rates continue to decline from their early-November peak. Rates dropped to 6.33% from 6.5% a week earlier, cutting the typical U.S. homebuyer’s monthly housing bill by about $50.
“This week has been relatively calm and quiet as we approach the end of one of the most volatile years in housing history,” said Redfin Deputy Chief Economist Taylor Marr. “But it’s not over yet. Next Tuesday’s inflation report is the 500-pound gorilla in the room, and the Fed’s press conference the next day will bring us much more clarity on how soon and how quickly we can expect mortgage rates to come down in the new year. Since we expect only a small decline in prices next year, mortgage rates will dictate housing affordability, and as a result, demand and sales, in 2023. If rates continue declining, more buyers may wade back into the market, as they’ll have lower monthly payments.”
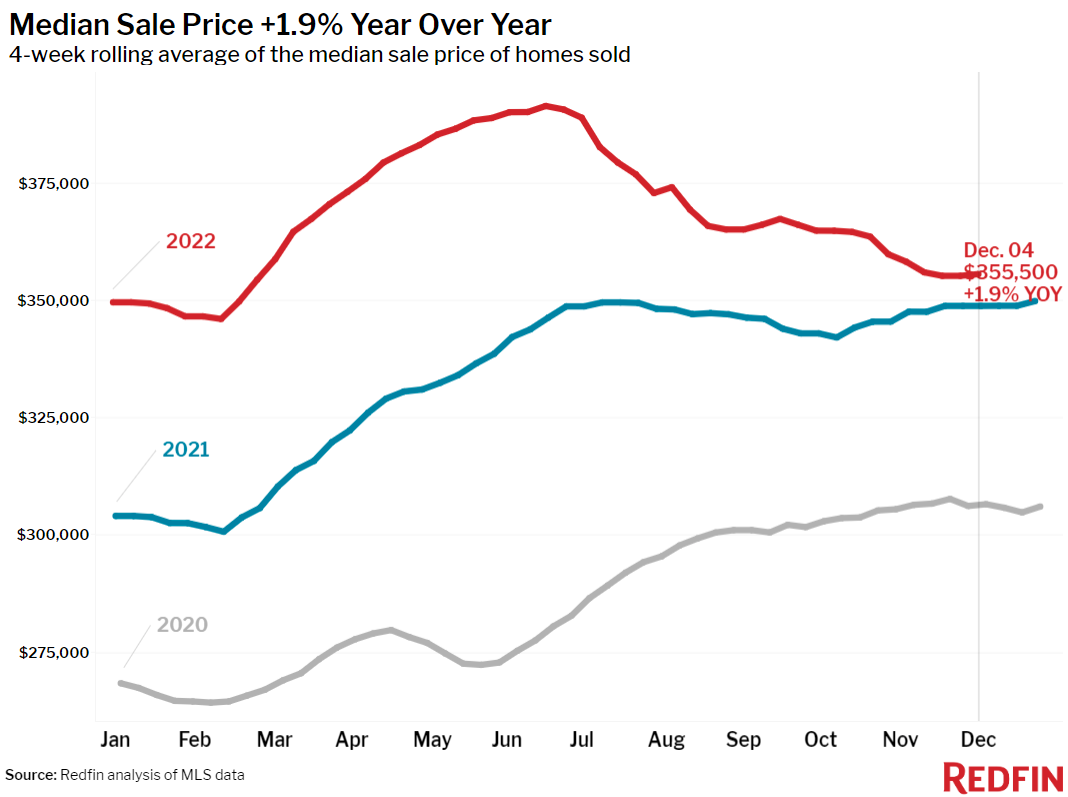
Home-sale prices fell from a year earlier in 11 of the 50 most populous U.S. metros, six of which are in California . Prices fell 7.8% year over year in San Francisco, 3.6% in San Jose, CA, 2.2% in Los Angeles, 1.4% in Detroit, 1.2% in Sacramento and 1.1% in Pittsburgh. They declined less than 1% in Oakland, CA, Anaheim, CA, Austin, Philadelphia and Phoenix.
Although the decline was small, this marks the first time Phoenix home prices have fallen on a year-over-year basis since at least 2015, as far back as this data goes. It’s the first time Anaheim prices have fallen since October 2019.
Unless otherwise noted, the data in this report covers the four-week period ending December 4. Redfin’s weekly housing market data goes back through 2015.
Refer to our metrics definition page for explanations of all the metrics used in this report.