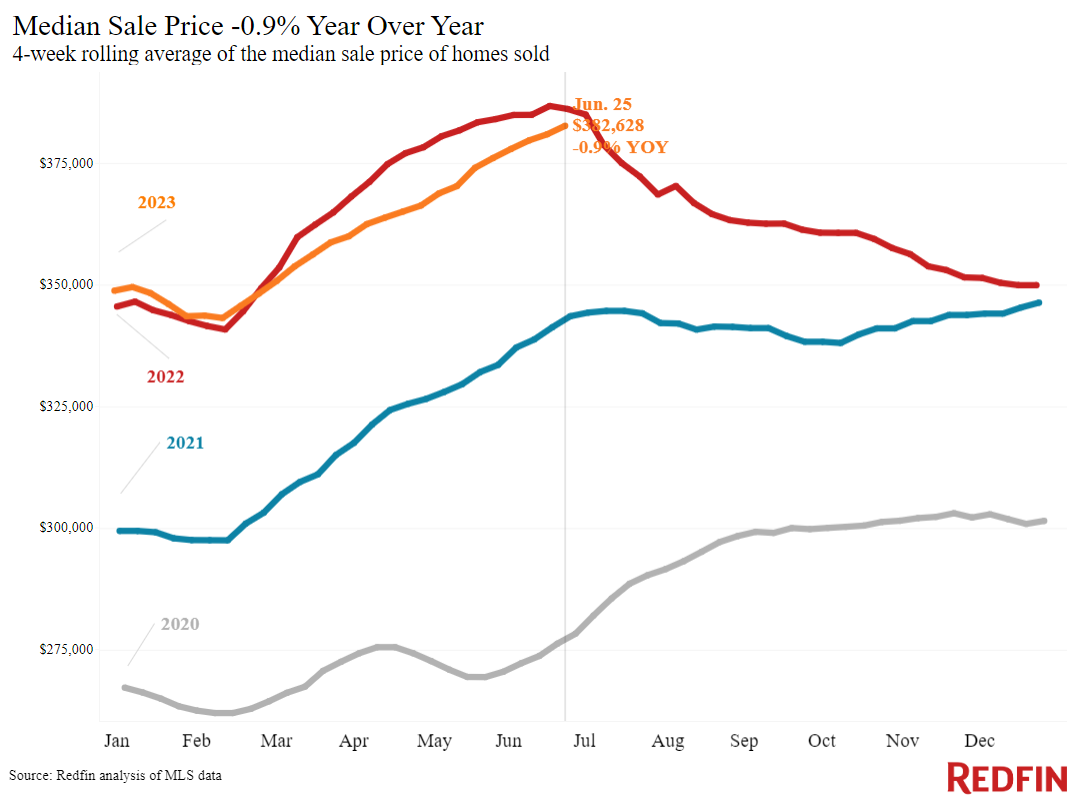
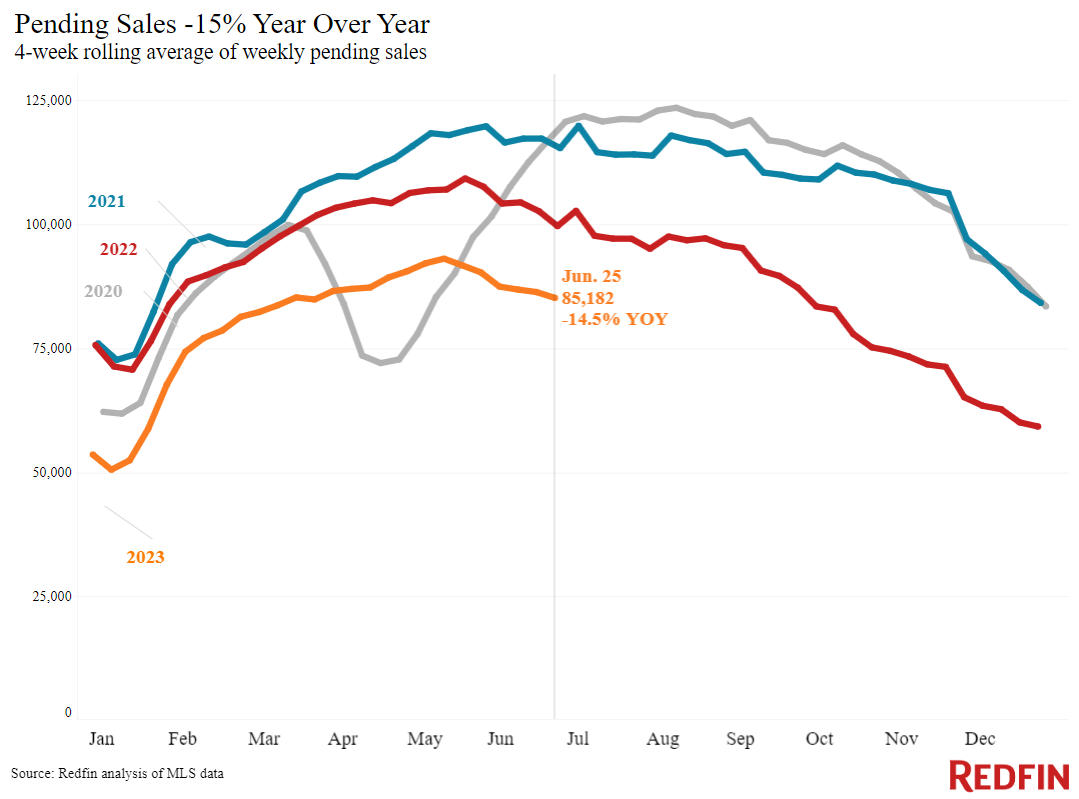
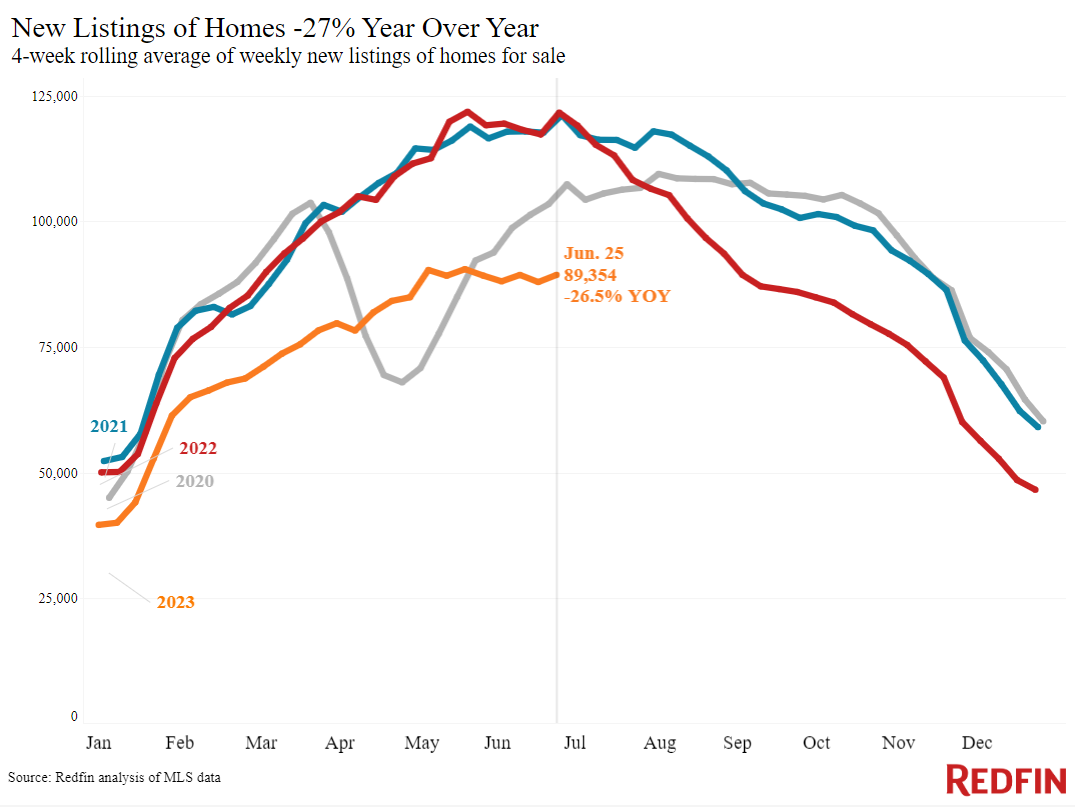
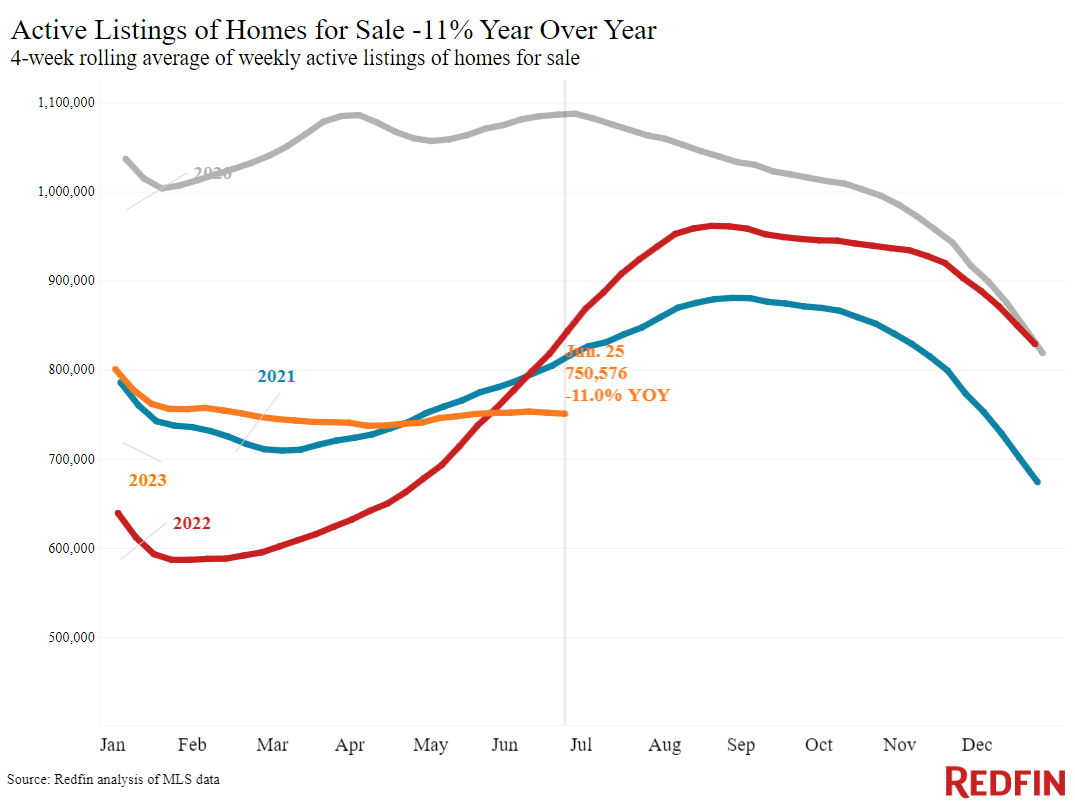
The median U.S. home-sale price is down just 0.9% year over year, the smallest decline in nearly four months. That’s due to a lack of homes for sale, with a mismatch between supply and demand. New listings are down 27% from a year ago and pending sales are down 15%.
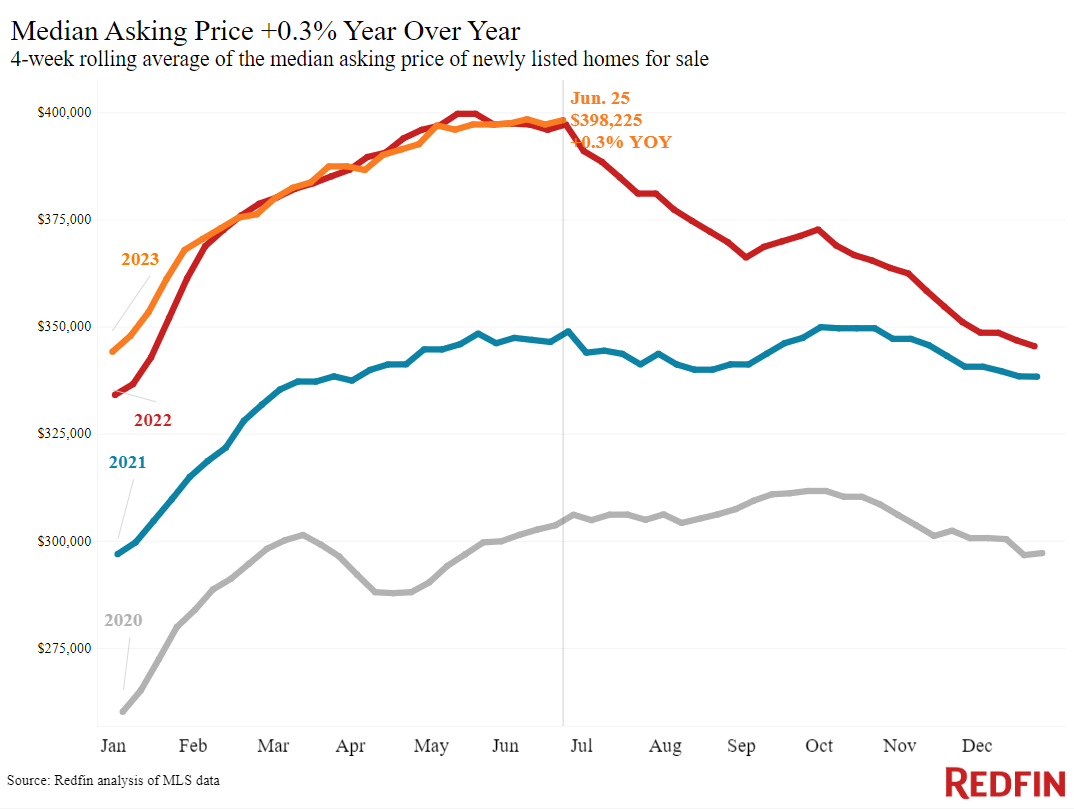
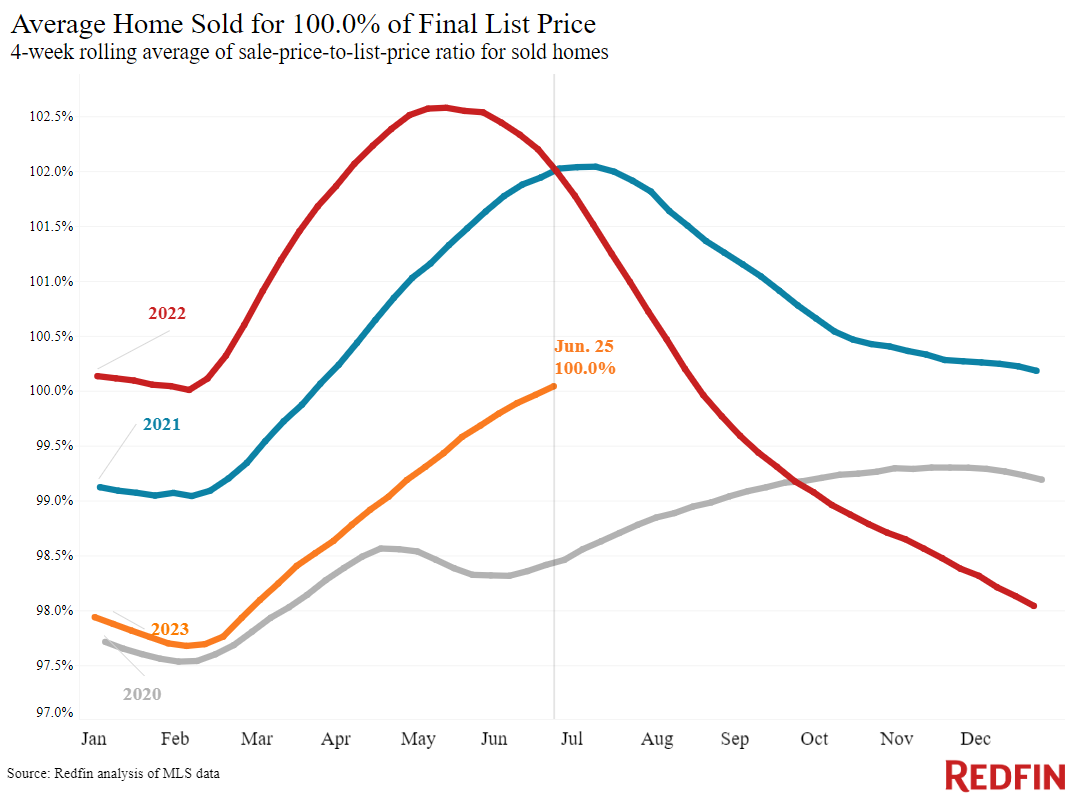
Home-price declines are shrinking. The typical U.S. home is selling for roughly $383,000, only about $4,000 less (-1%) than the all-time high set last June. That’s the smallest year-over-year drop in nearly four months. Additionally, this is just the second time since last August the sale-to-list price ratio has hit 100%; in other words, the average home is now selling for its asking price.
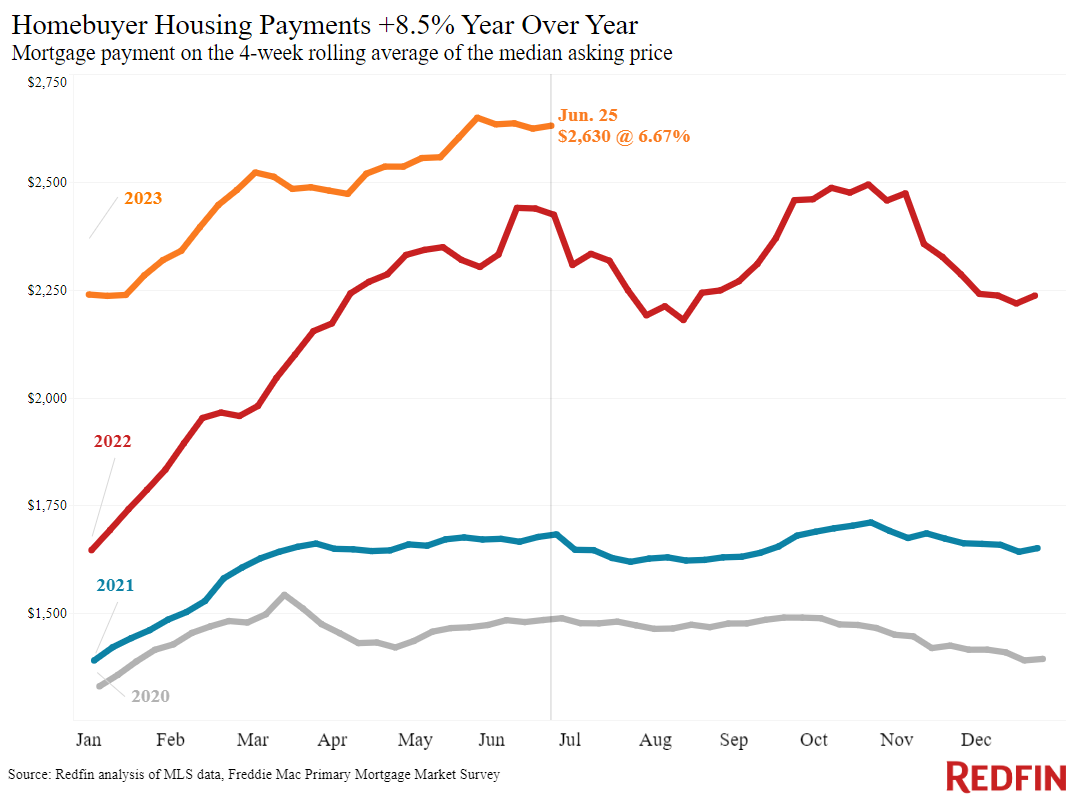
A lack of homes for sale is keeping prices afloat. New listings fell 27% from a year earlier during the four weeks ending June 25, the biggest drop since the start of the pandemic. That has contributed to the total number of homes for sale declining 11%, the first double-digit drop in over a year. Inventory is falling because of high mortgage rates, with many homeowners staying put to hang onto their comparatively low rates. Although the average 30-year mortgage rate has inched down in recent weeks, it’s still near 7%, more than double 2021’s record-low levels.
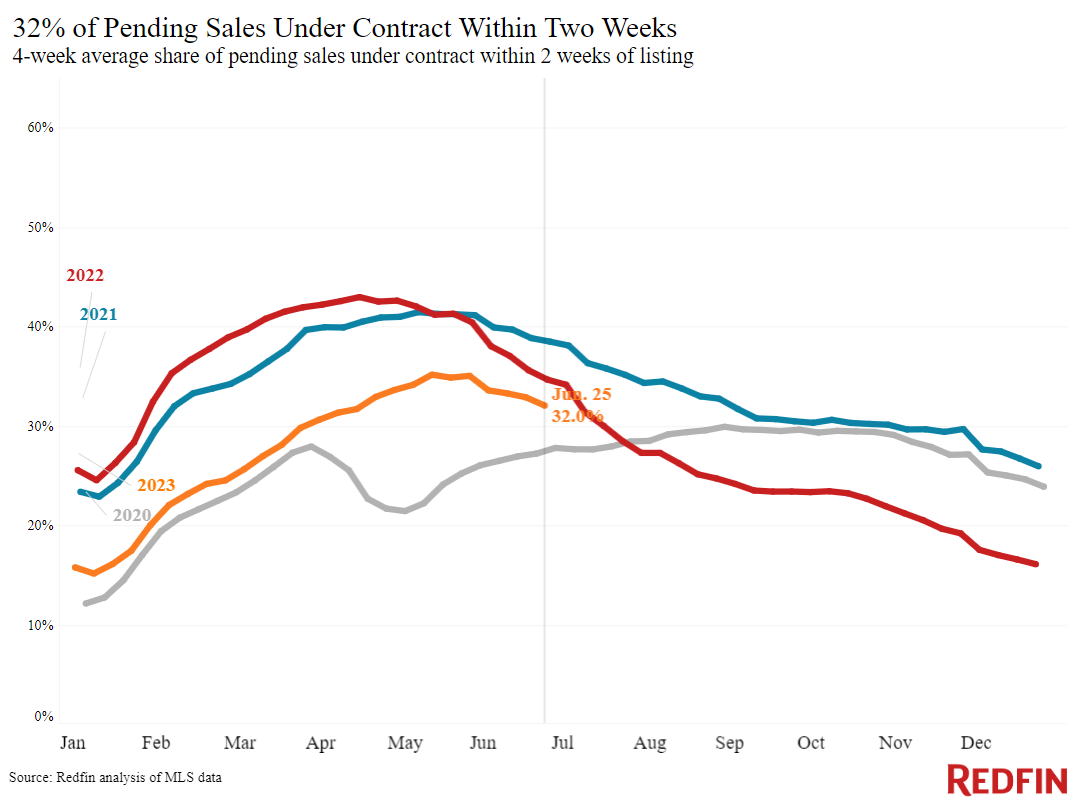
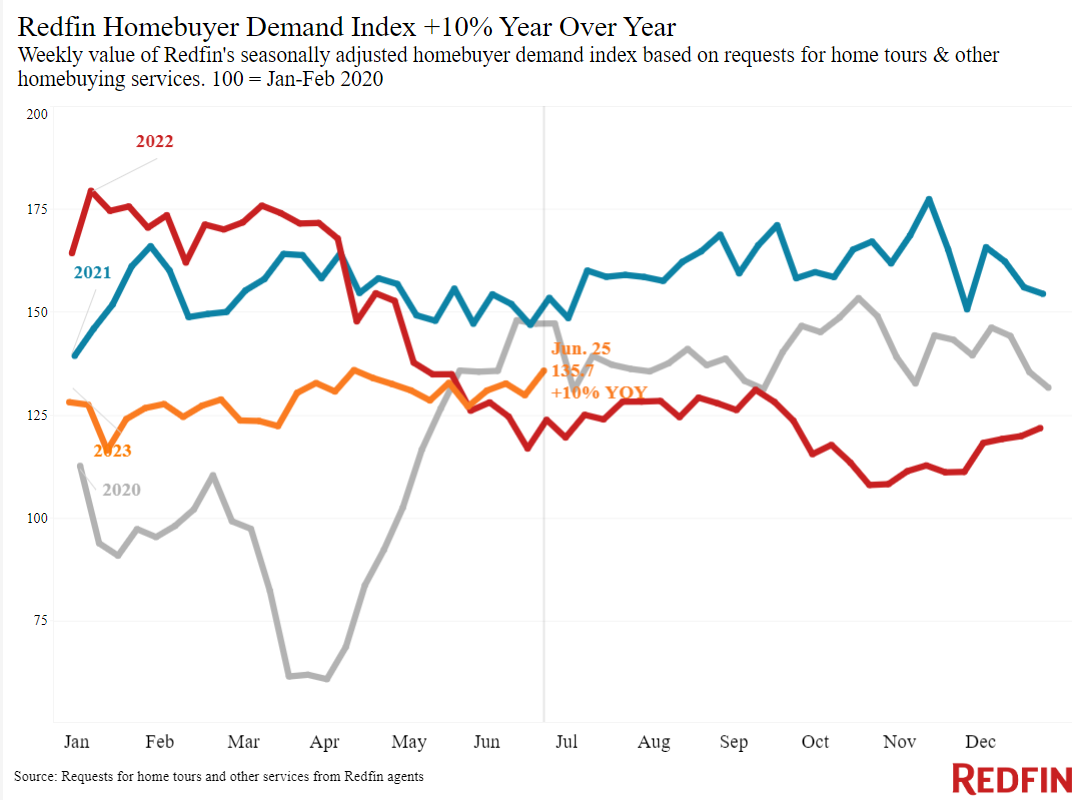
High rates are also deterring homebuyers, but they still outnumber home sellers. Pending home sales are down 15%, significantly smaller than the drop in new listings. That means buyers are snapping up inventory faster than it’s being listed, which is keeping home prices elevated.
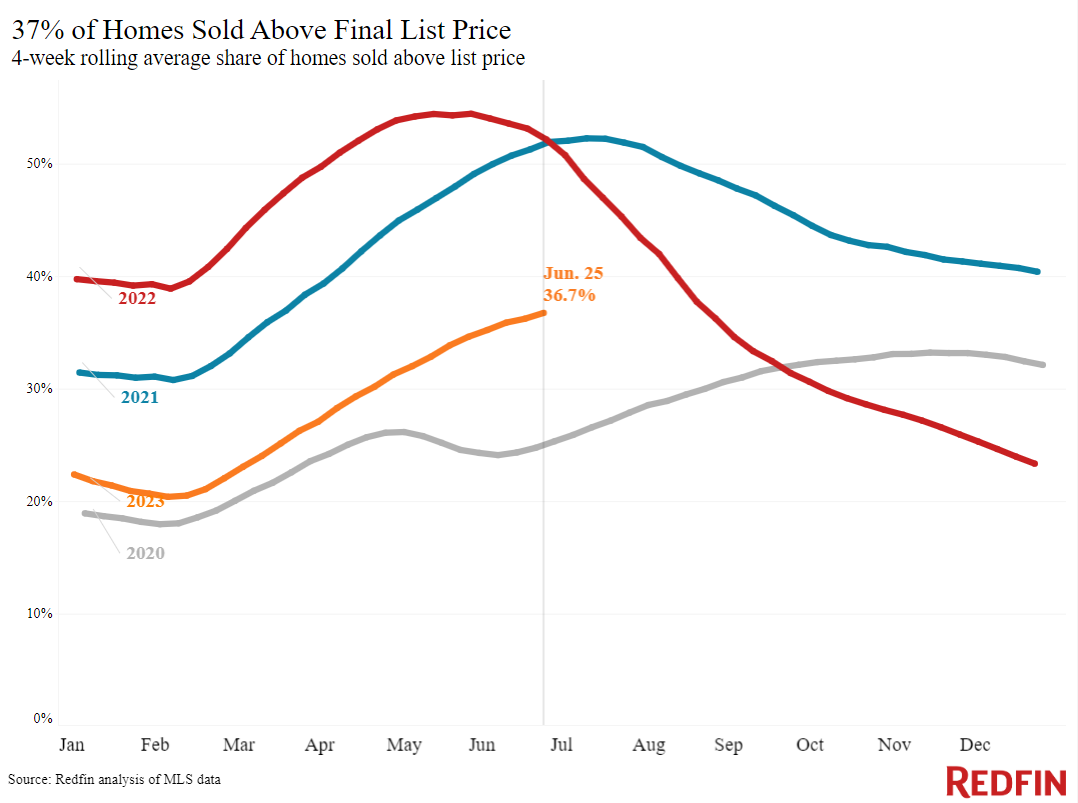
“The market isn’t nearly as fast as it was 18 months ago, when homes were flying off the market for well over asking price, and it’s not as slow as it was six or seven months ago, when mortgage rates first shot up,” said Oakland, CA Redfin Premier agent Andrea Chopp. “Buyers should keep in mind that desirable homes are getting multiple offers and selling above asking price. And sellers should know that their home may not attract as much competition as their neighbor’s home did two years ago, but it will sell if they price it fairly and put effort into marketing. Things like making small repairs and staging are important again.”
Unless otherwise noted, the data in this report covers the four-week period ending June 25. Redfin’s weekly housing market data goes back through 2015.
For bullets that include metro-level breakdowns, Redfin analyzed the 50 most populous U.S. metros. Select metros may be excluded from time to time to ensure data accuracy.
Refer to our metrics definition page for explanations of all the metrics used in this report.