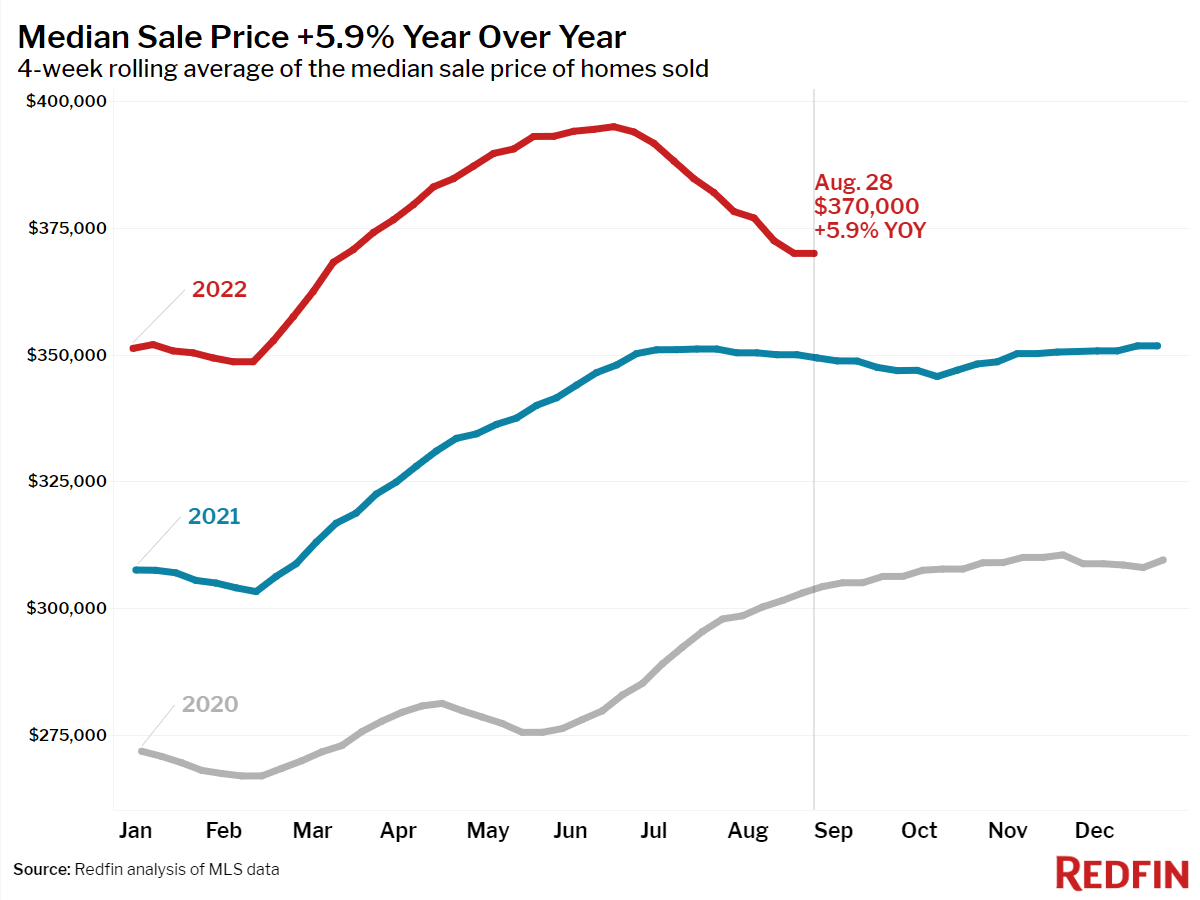
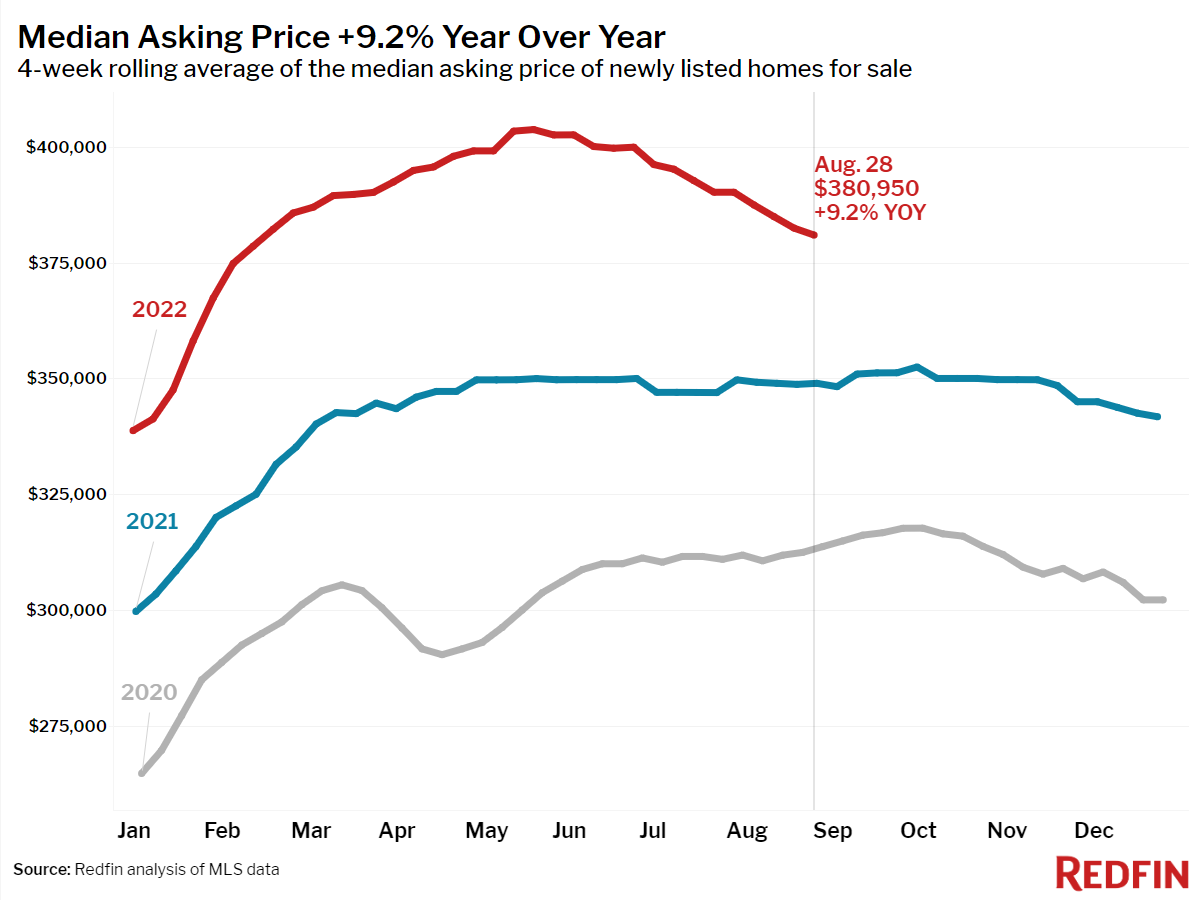
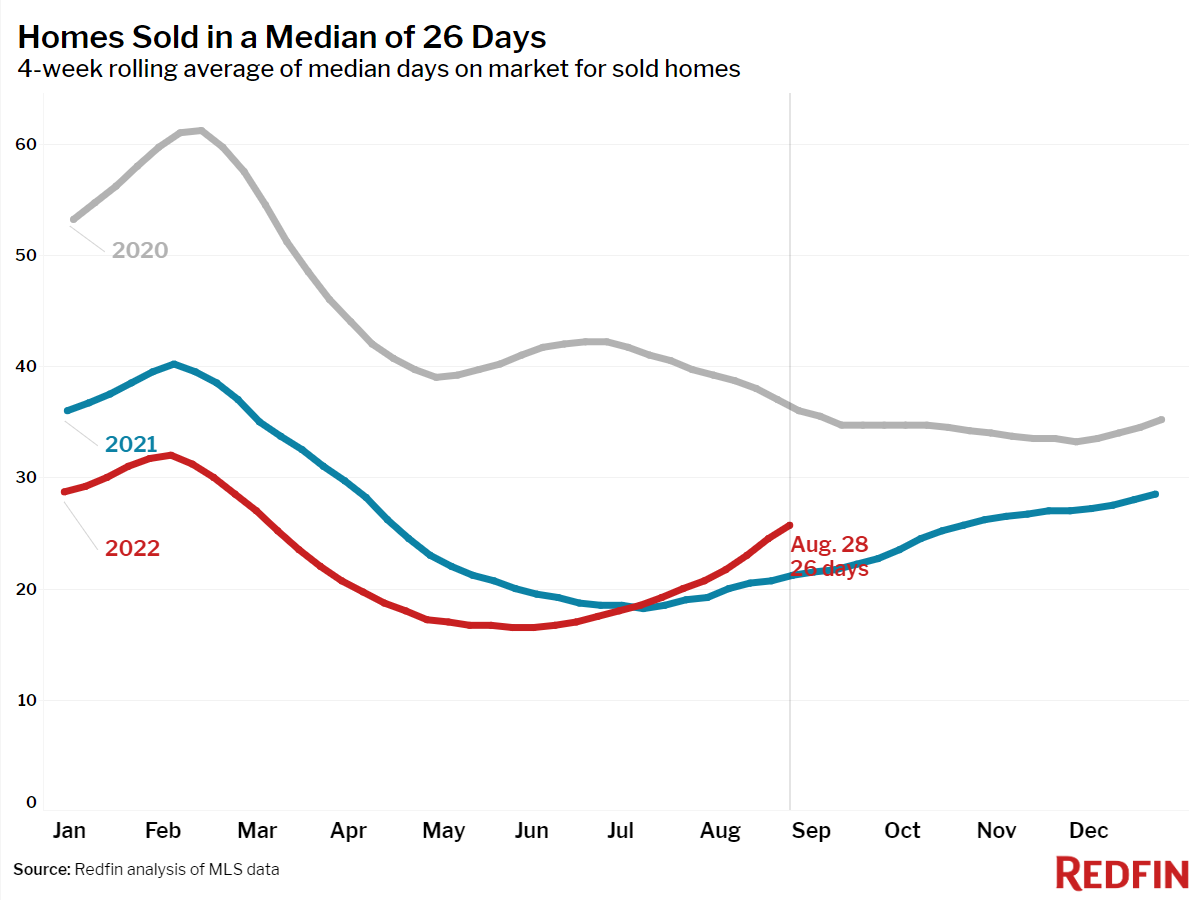
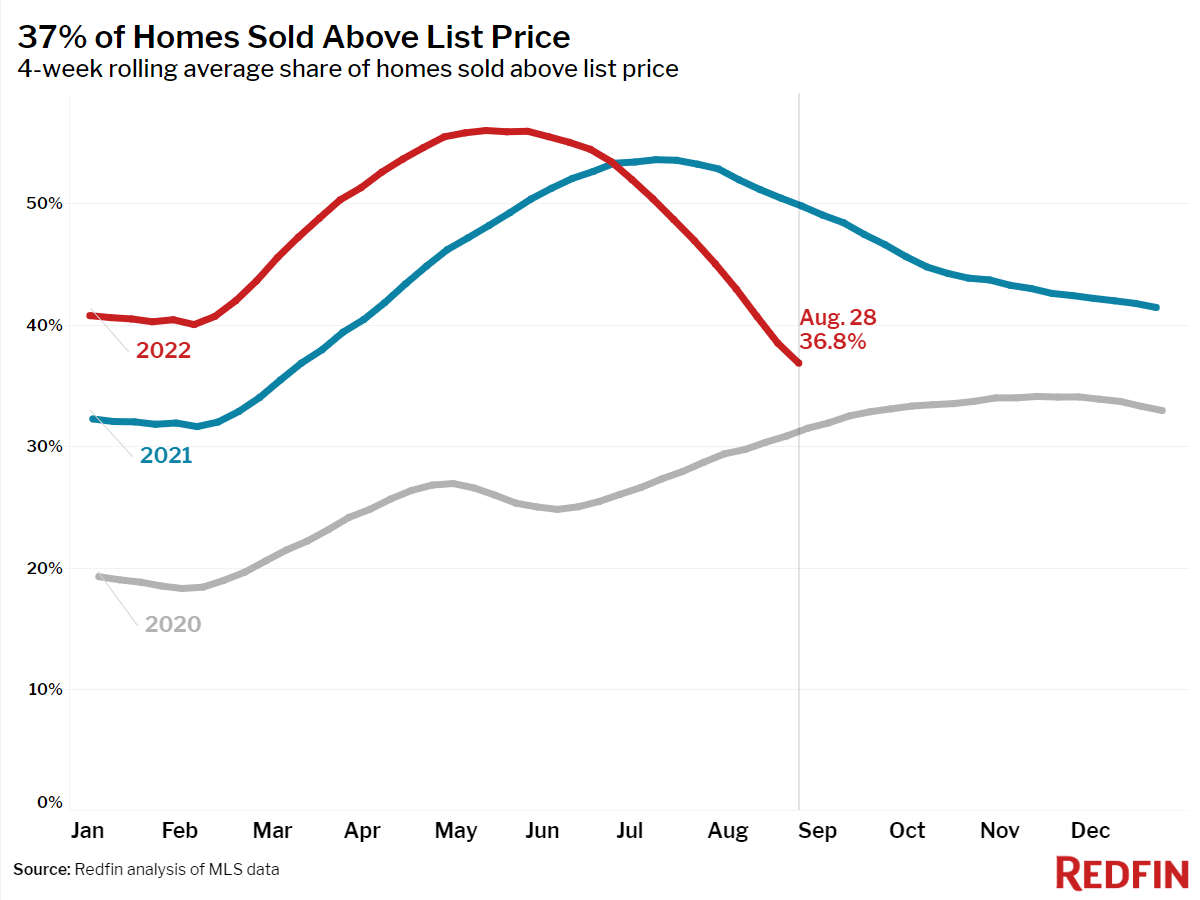
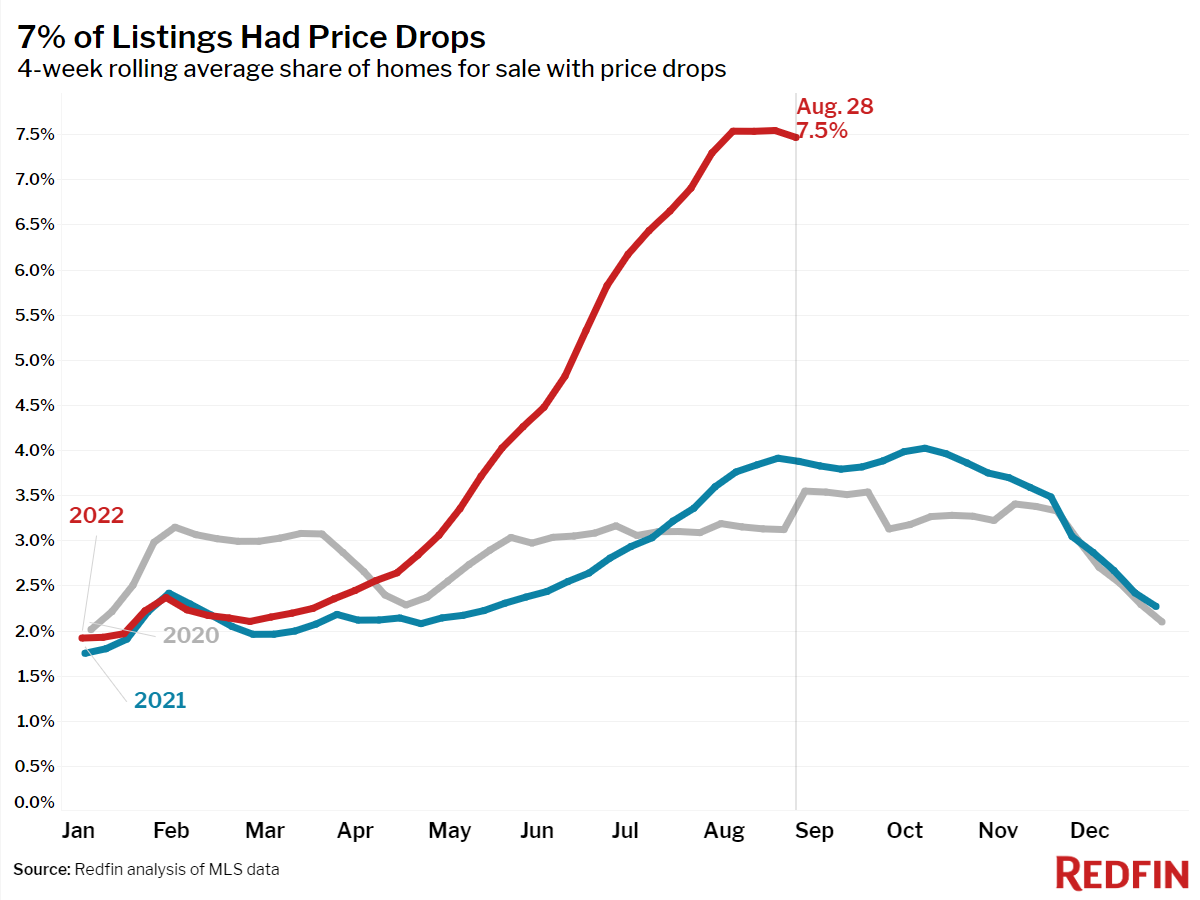
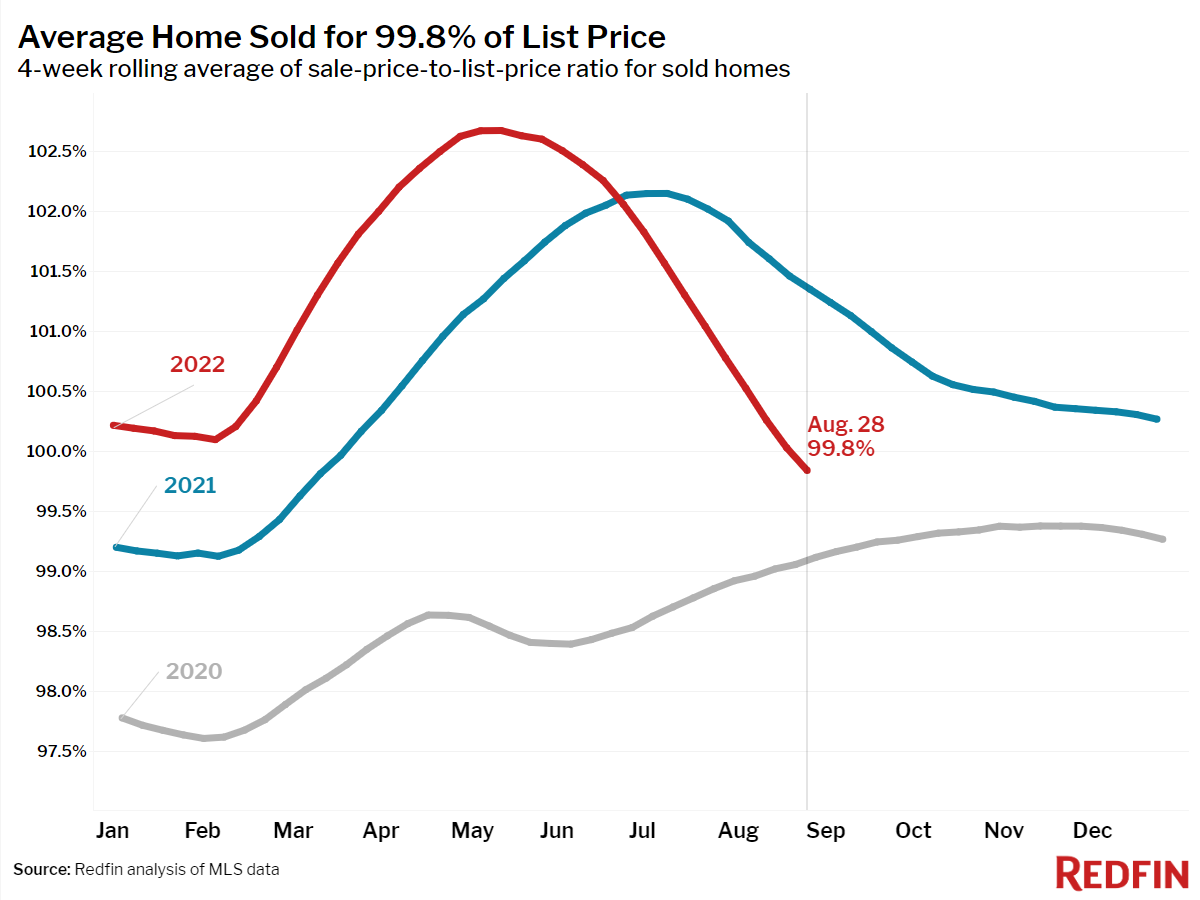
The average home sold for less than its list price for the first time in over 17 months during the four-week period ending August 28, as the housing market cooldown continued. Every month since March of 2021 has seen an average sale-to-list ratio of over 100%, meaning that the average home has sold for more than its final asking price, after all price drops. This comes as the share of listings with a price drop has finally begun to plateau.
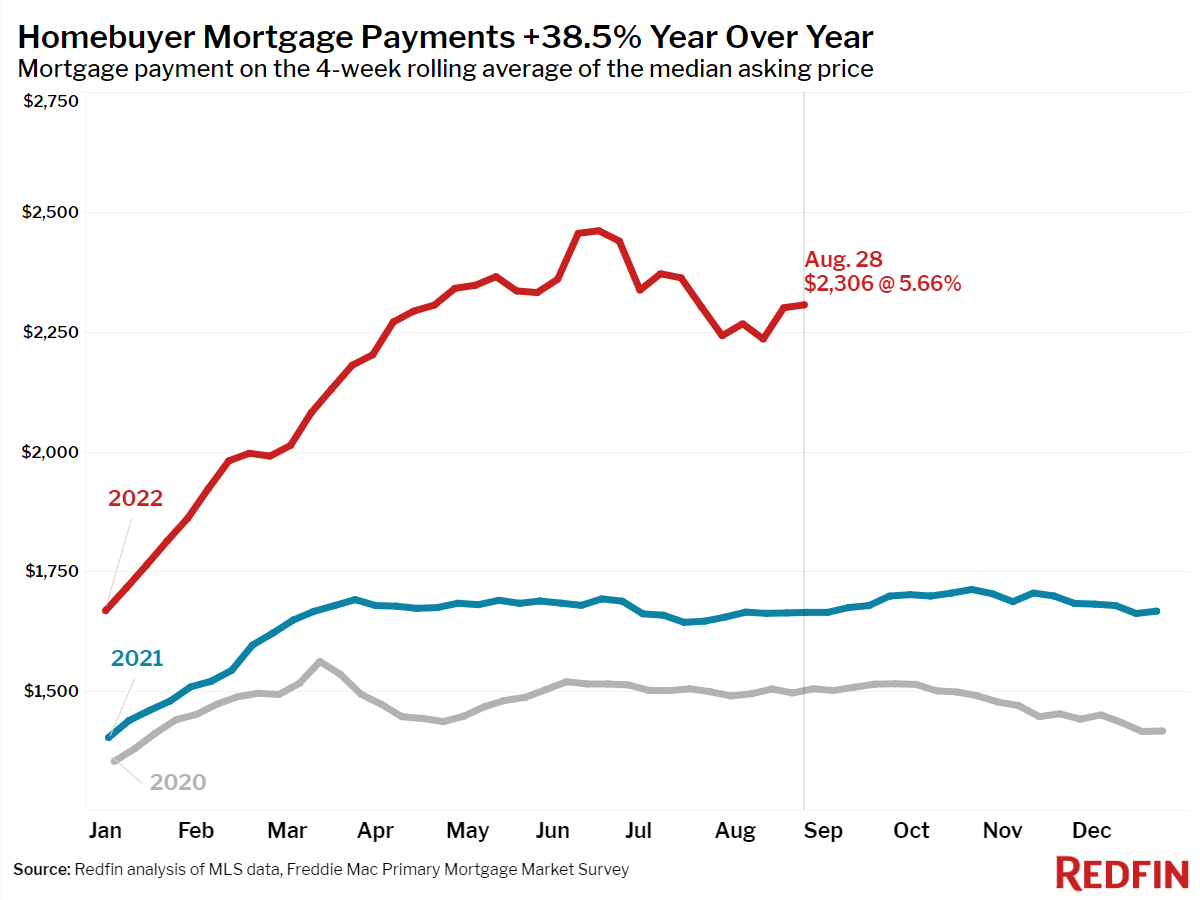
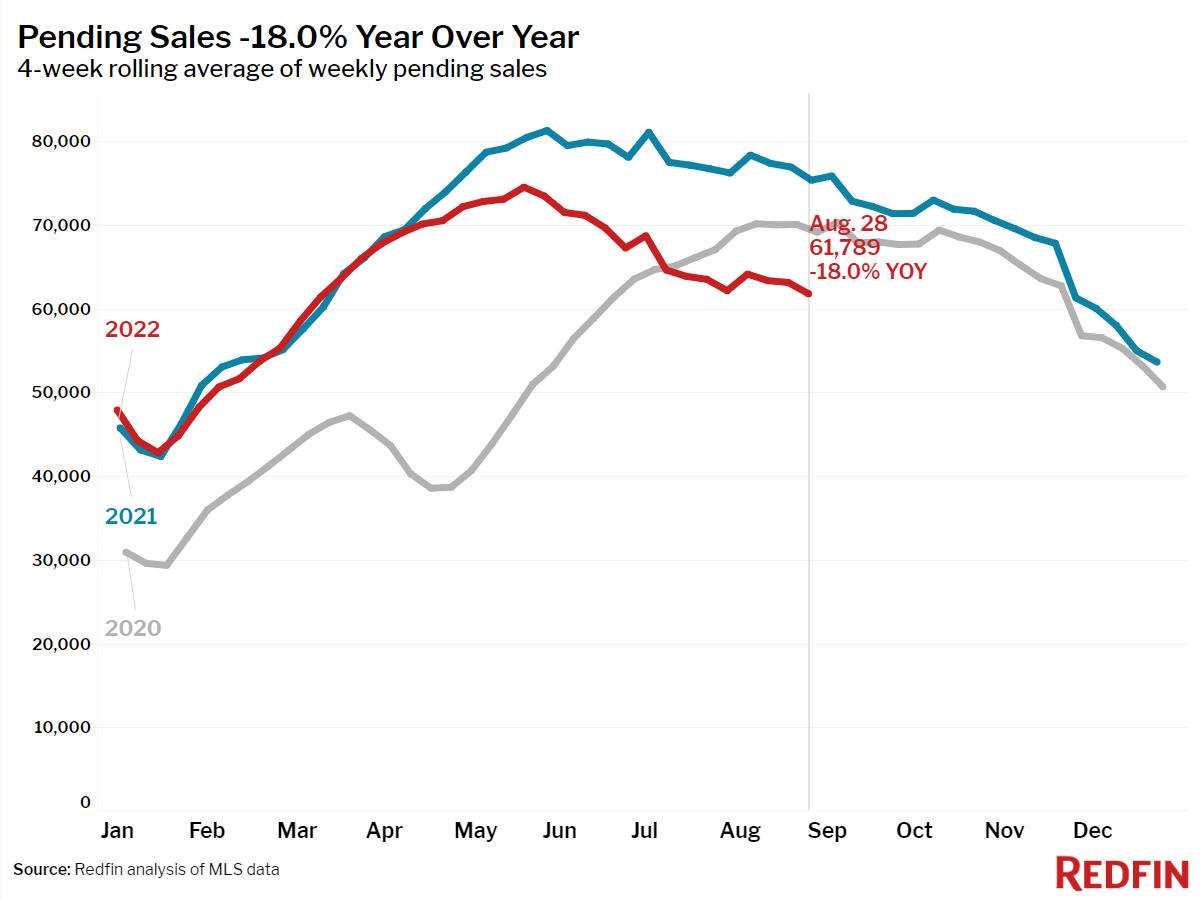
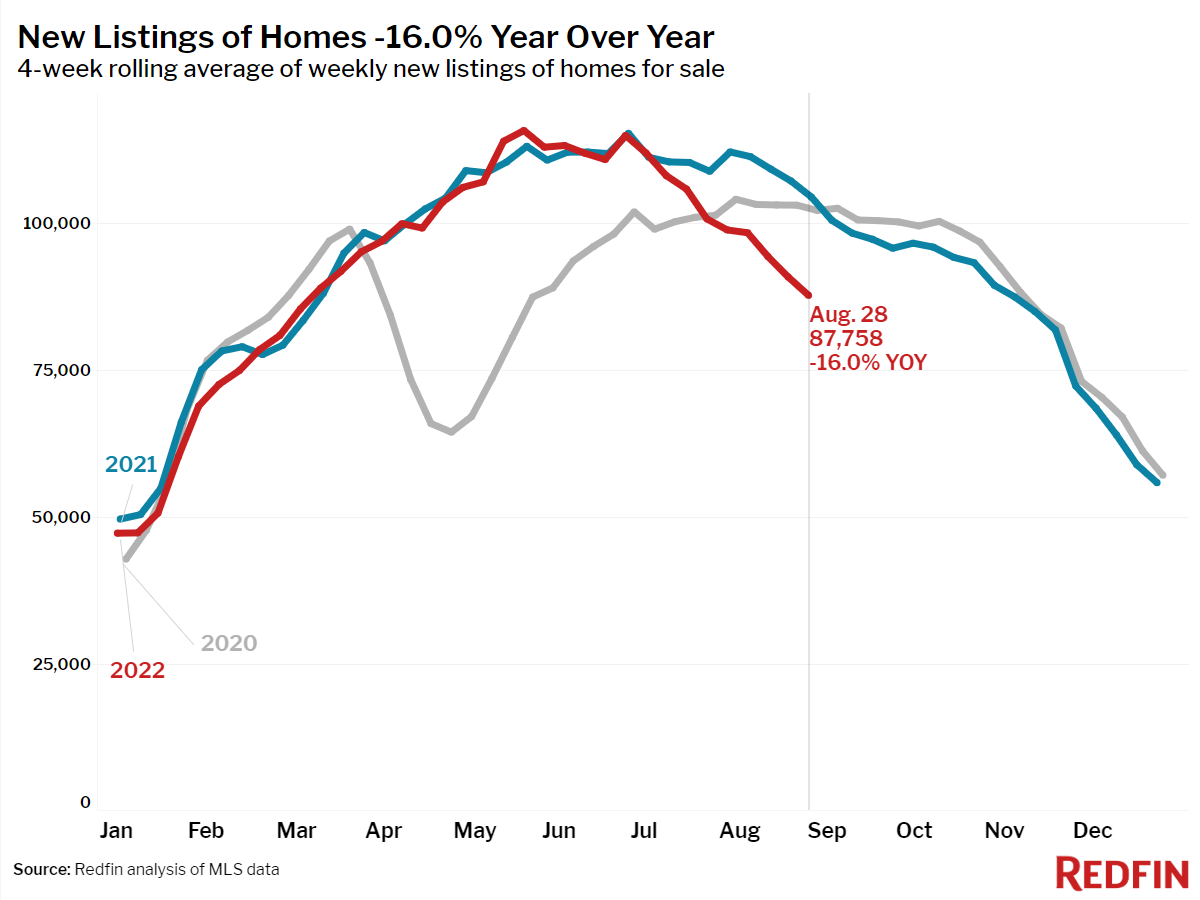
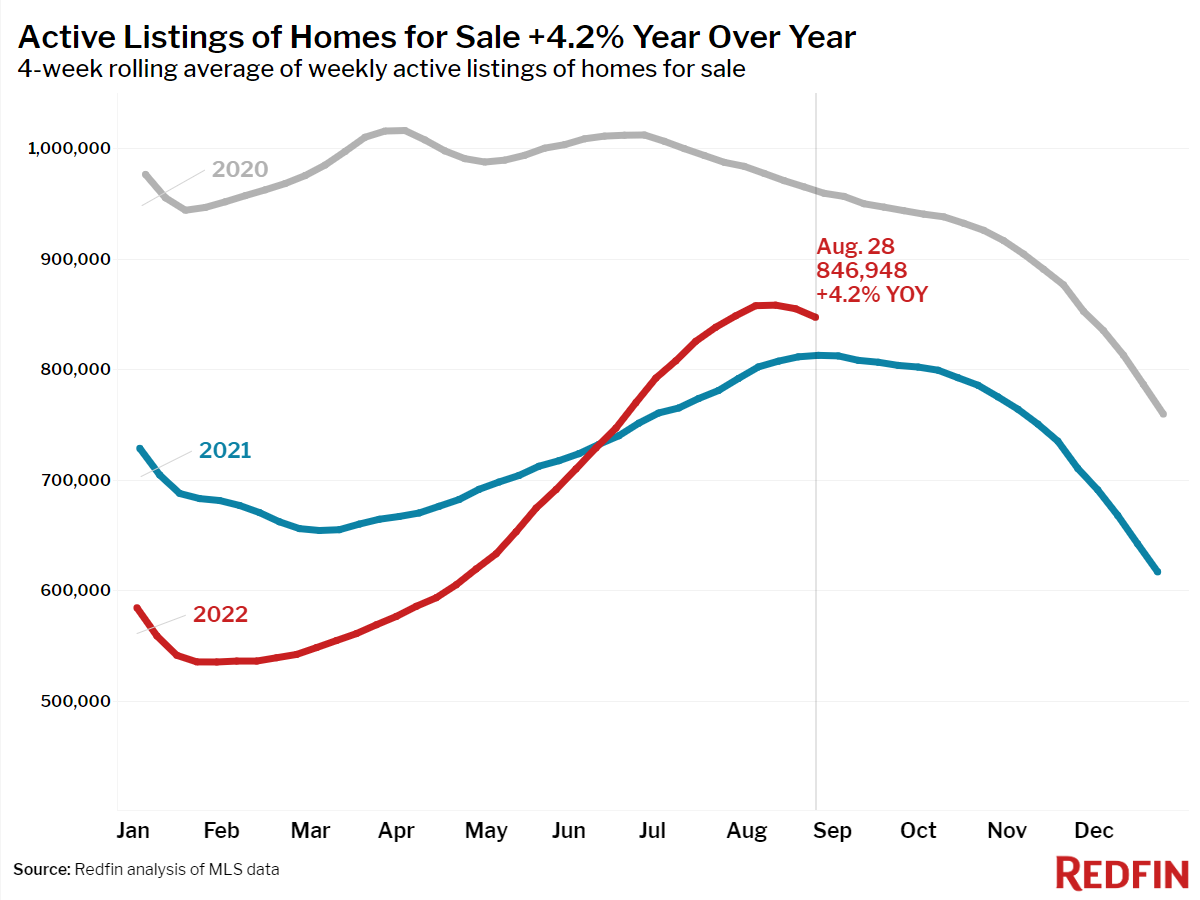
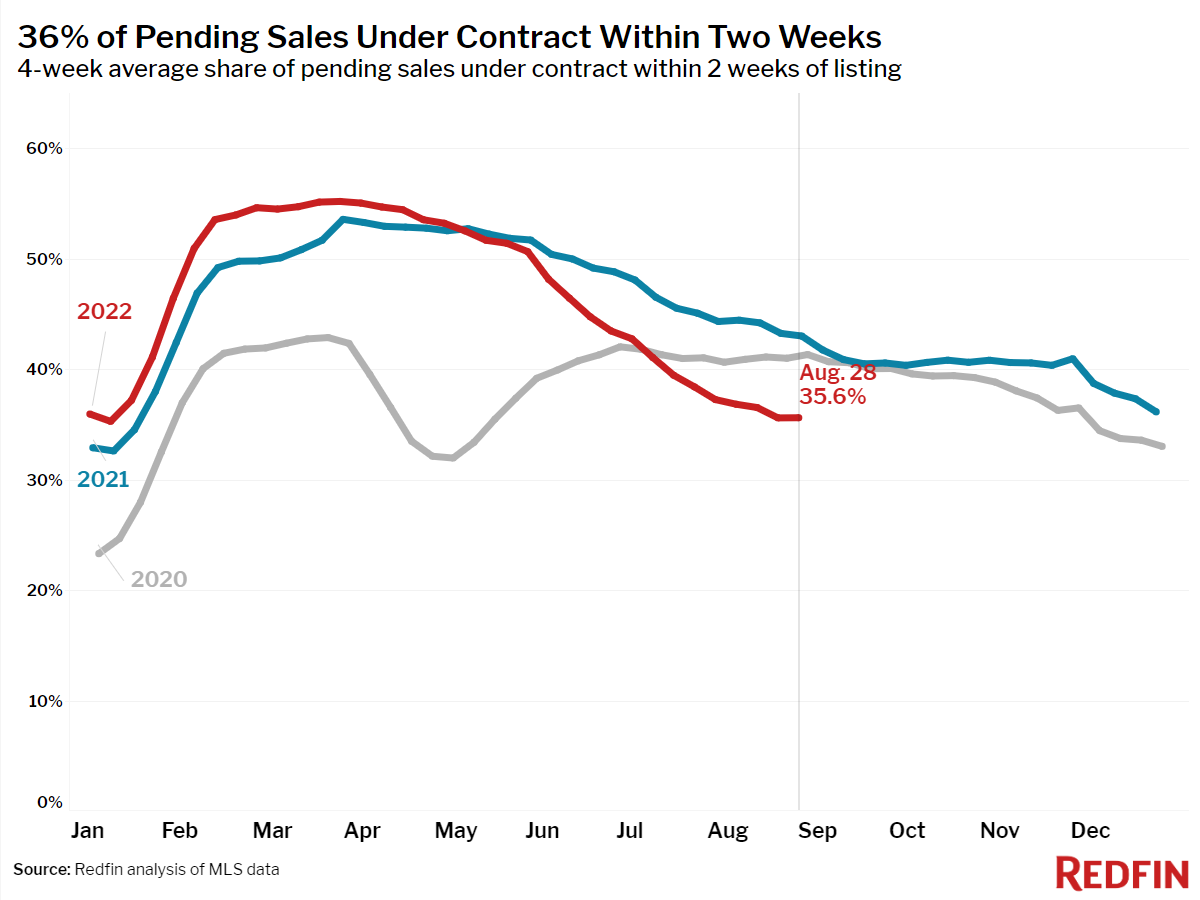
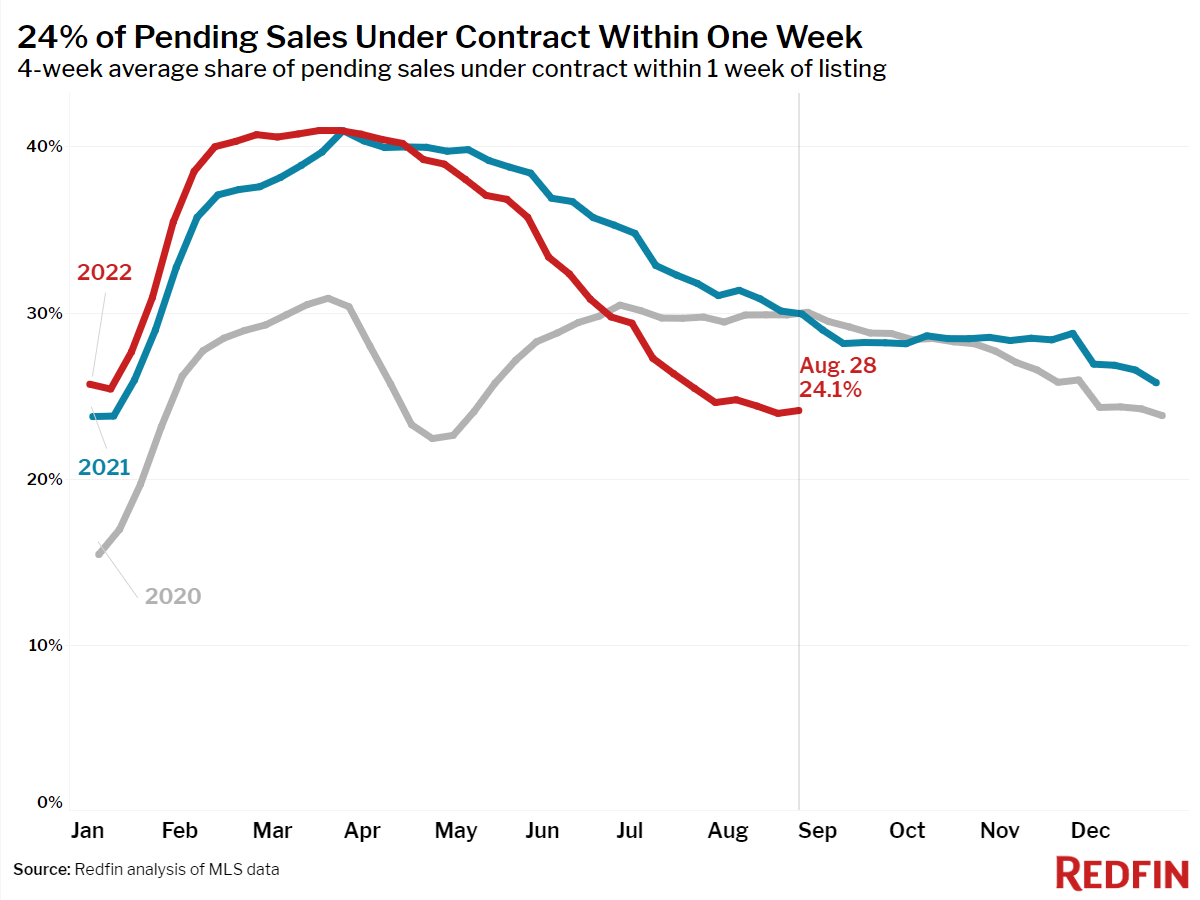
Despite the easing in home prices, demand from homebuyers is still chilled—mortgage purchase applications and pending sales both saw large declines from a year ago—thanks in large part to another spike in mortgage rates, which rose to 5.66%, their highest level since June. Home sellers are also reluctant to step into the market: new listings and total inventory of homes for sale saw large declines as well.
“While the cooldown appears to be tapering off, there are signs that there is more room for the market to ease,” said Redfin Chief Economist Daryl Fairweather. “The post-Labor Day slowdown will likely be a little more intense this year than in previous years when the market was super tight. Expect homes to linger on the market, which may lead to another small uptick in the share of sellers lowering their prices. Homebuyers’ budgets are increasingly stretched thin by rising rates and ongoing inflation, so sellers need to make their homes and their prices attractive to get buyers’ attention during this busy time of year.”
Unless otherwise noted, the data in this report covers the four-week period ending August 28. Redfin’s housing market data goes back through 2012.
Refer to our metrics definition page for explanations of all the metrics used in this report.