

Five years after the crash, the economy may not be back on its feet, but the ultra-rich are sitting pretty. According to new research done by UC Berkeley, the richest one percent of Americans captured 95 percent of the income growth in the United States between 2009 and 2012. With homes always on our mind, this stunning stat made us wonder: How did the top 1% of homes fare in the housing crash?
With big money comes big resilience, apparently. At the end of 2012, the median sale price of the top one percent of homes was only four percent below its 2007 level. Comparatively, the median price of the bottom 99 percent of homes was down 23 percent from 2007.
Don’t fret, the rest of us are catching up quickly. Over the past year, median sale prices in the bottom 99 percent have gained 17 percent; comparatively, prices of the top homes have gained just 1.3 percent.
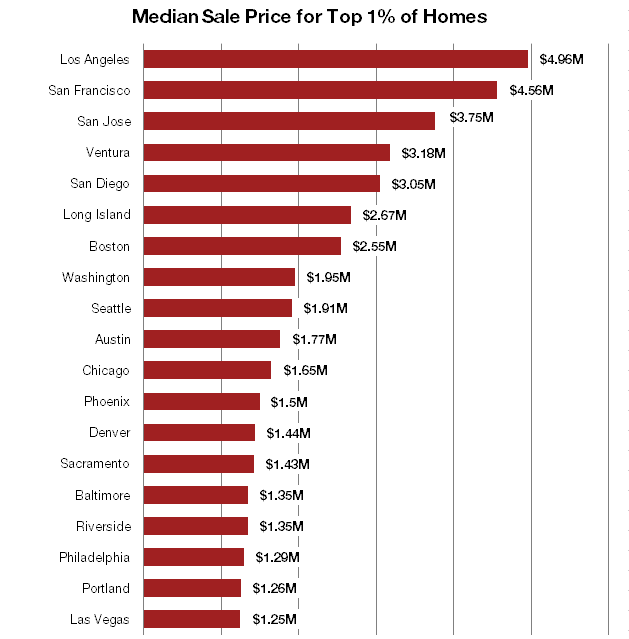
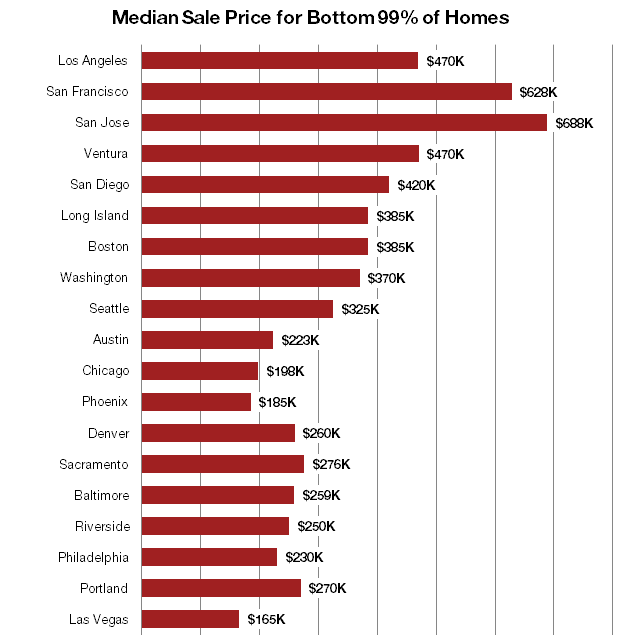
Money may not buy happiness, but it sure can buy real estate. Curious about how much cash you have to cough up to buy a “top one percent” home? Unsurprisingly, it varies widely by location. We dug into the data for 19 markets where Redfin operates and found that:
If you’re wondering how much home you can afford, check out Redfin’s new Home Affordability Calculator.
To get an idea of what this means in the real world, check out the examples below of homes for sale in the top one percent and bottom 99 percent:
