U.S. home purchases by investors rose 2.7% year over year in the first quarter, marking the first period of growth since the coronavirus pandemic began. That follows three consecutive quarters of declines, during which investor purchases slumped by as much as 45.5%.
We define an investor as any institution or business that purchases residential real estate. Scroll to the bottom of this report to read more about our methodology.

Investors bought about 1 of every 7 U.S. homes (14.9%) in the first quarter—a rebound from the prior three quarters, during which they bought closer to 1 in 10 homes. Investor market share is now just shy of the 16.1% level it hit in the first quarter of 2020, when the pandemic had barely begun.

“Investors are likely starting to feel more comfortable because the economy is in recovery mode,” Redfin Senior Economist Sheharyar Bokhari said. “They also may be jumping back in because they see the intensifying shortage of homes for sale as an opportunity. With so few houses on the market, many families are resorting to rentals. Flush with cash, investors are able to snap up the homes that are available, and then turn around and rent them out to folks who can’t find a home or are priced out of homeownership. This is likely making the housing shortage even worse, and also means that individual homeowners sometimes end up competing with investors in bidding wars.”
A frothy stock market is another factor that could attract more investors to real estate, according to Redfin Chief Economist Daryl Fairweather.
“Investors may shift away from stocks and toward housing because housing is a relatively safe bet,” Fairweather said. “There aren’t a lot of safe bets out there right now.”
Investors initially pumped the brakes at the beginning of the pandemic because the housing market had ground to a halt. The market then came roaring back, but investors were slower to rejoin the party, likely due to lingering economic uncertainty. Many investors purchase homes with the intention of renting them out, so when rents plunged, unemployment skyrocketed and evictions were halted due to the pandemic, some opted for a cautious approach.
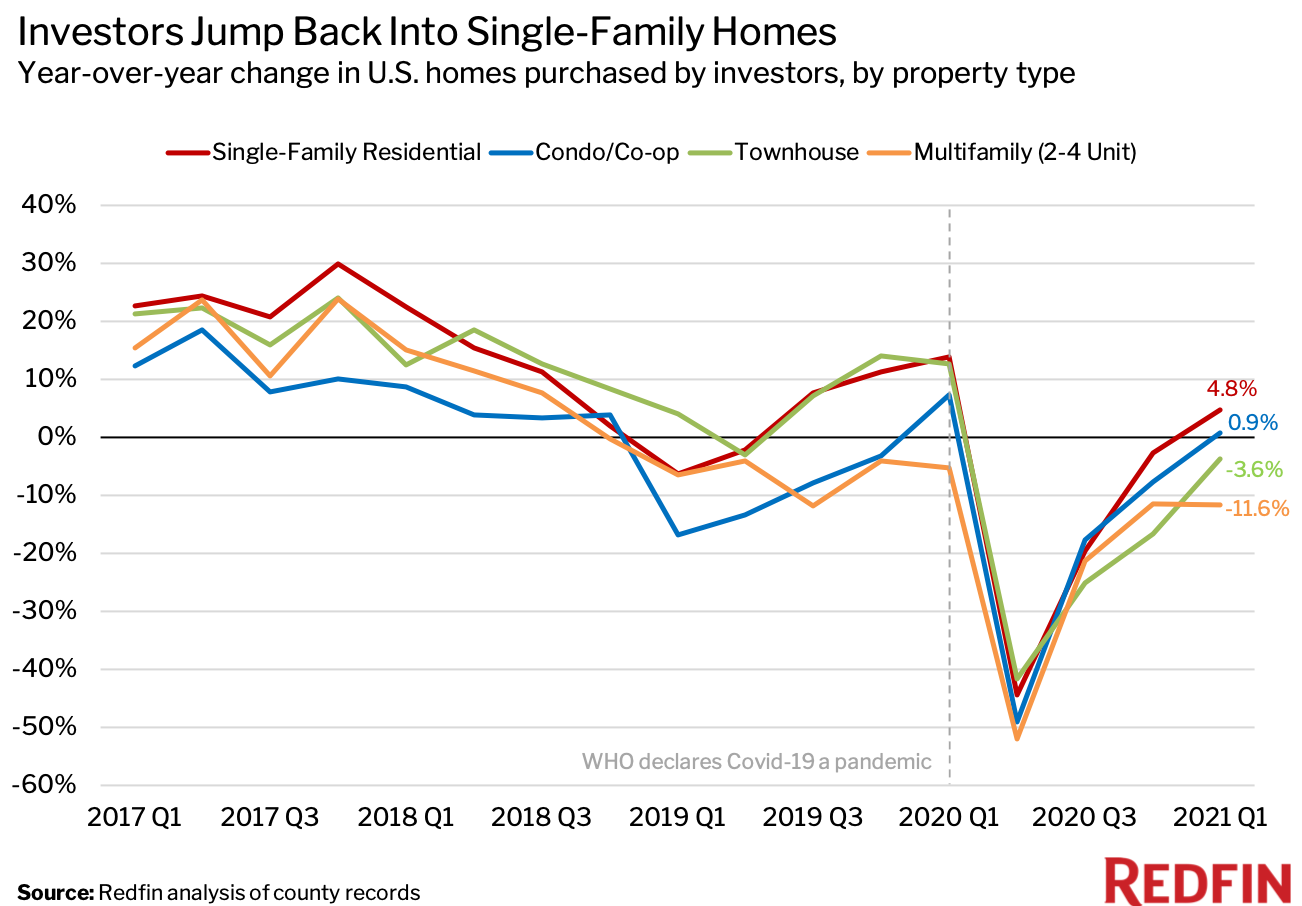
Investor purchases of single-family homes rose 4.8% year over year in the first quarter, outpacing growth in every other property type. By comparison, investor purchases rose just 0.9% for condos, and fell a respective 3.6% and 11.6% for townhomes and multifamily properties.
This is likely because Americans have been prioritizing space and privacy during the pandemic, turning single-family homes into a hotter commodity than crowded apartment buildings in the city.

Real estate giant Blackstone Group Inc. is one example of an investor that has jumped back into the single-family-home business. The Wall Street firm recently agreed to lead a $300 million minority investment in Tricon Residential Inc., an owner of single-family rental homes. That marks a reversal from 2019, when Blackstone cut back its bet on the single-family-rental market.
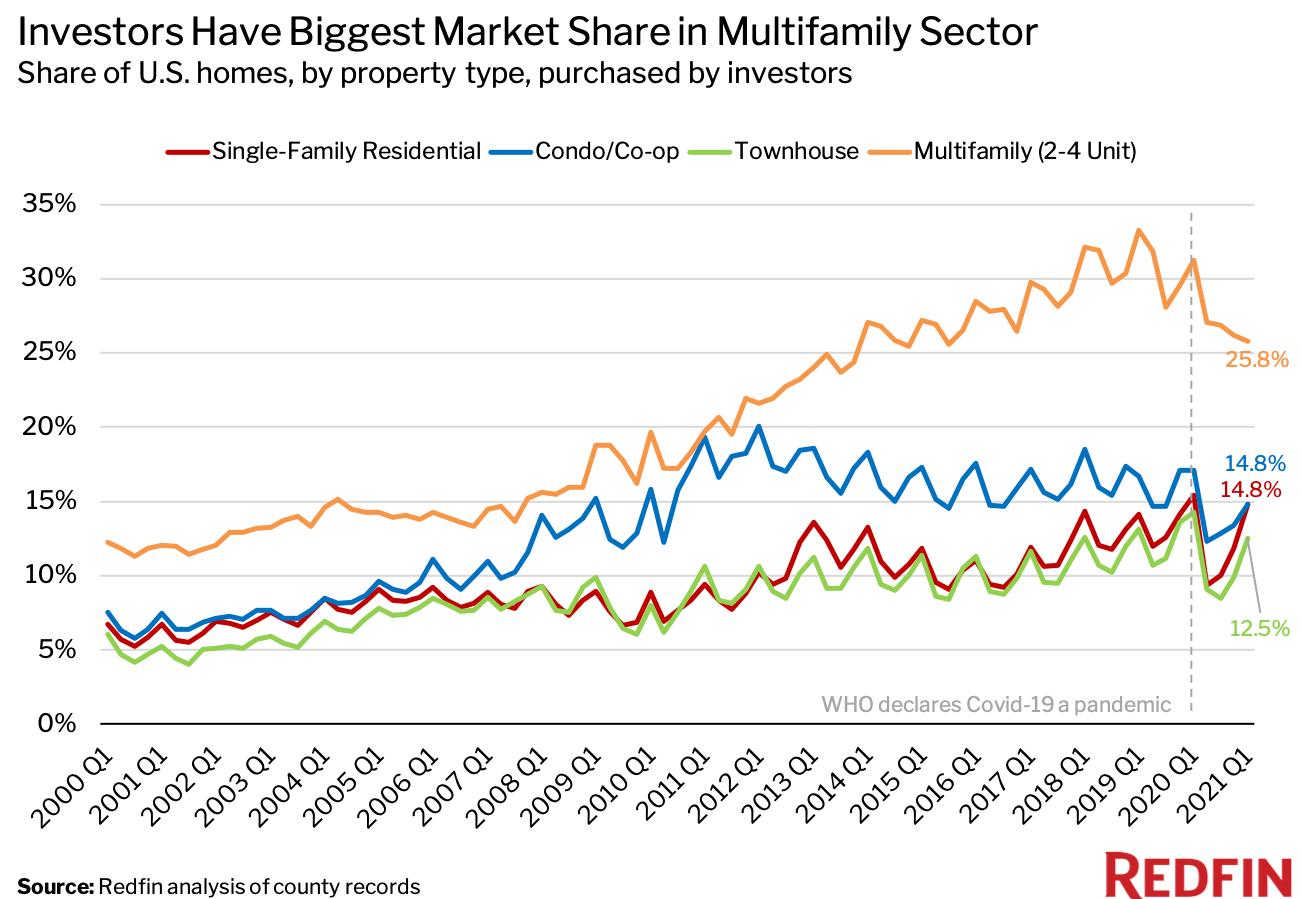
While investors have been buying more single-family homes during the pandemic, they still have the biggest market share in the multifamily sector. They bought a quarter (25.8%) of multifamily properties that sold in the U.S. during the first quarter. By comparison, they purchased 14.8% of both single-family homes and condos, and 12.5% of townhomes.

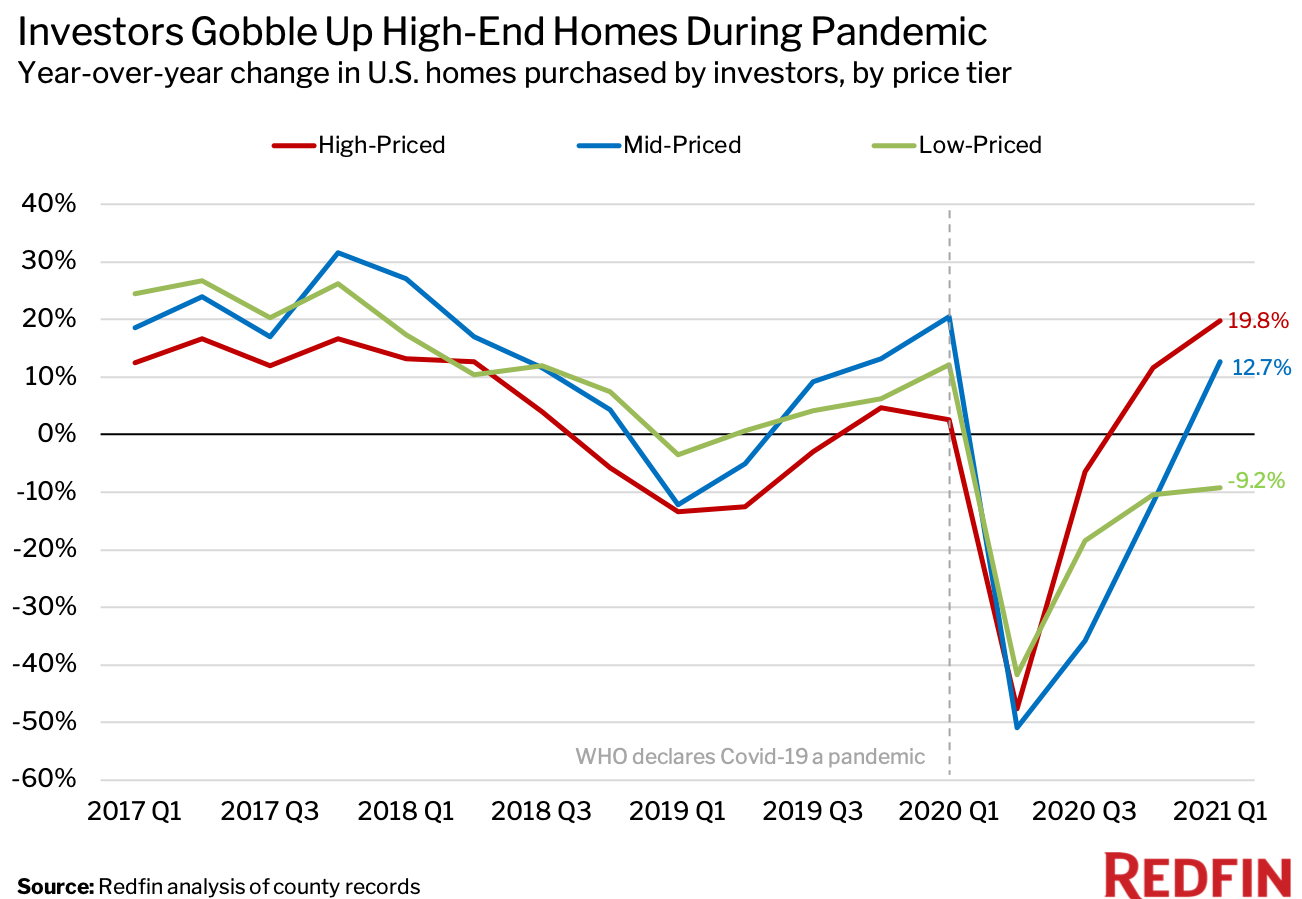
Investor purchases of high-priced homes jumped 19.8% year over year in the first quarter. By comparison, investor purchases of mid-priced homes rose 12.7% and investor purchases of low-priced homes declined 9.2%.

The market for high-end homes has flourished during the pandemic, in part because affluent Americans—with extra cash from a strong stock market and a year of being stuck at home—have been relocating to vacation destinations to enjoy the sun and work remotely. Demand for second homes, which are often high-priced properties, has more than doubled.
The housing shortage also isn’t as severe in the high-priced segment of the market, which may be another factor allowing investor purchases in that tier to outperform, Bokhari said.
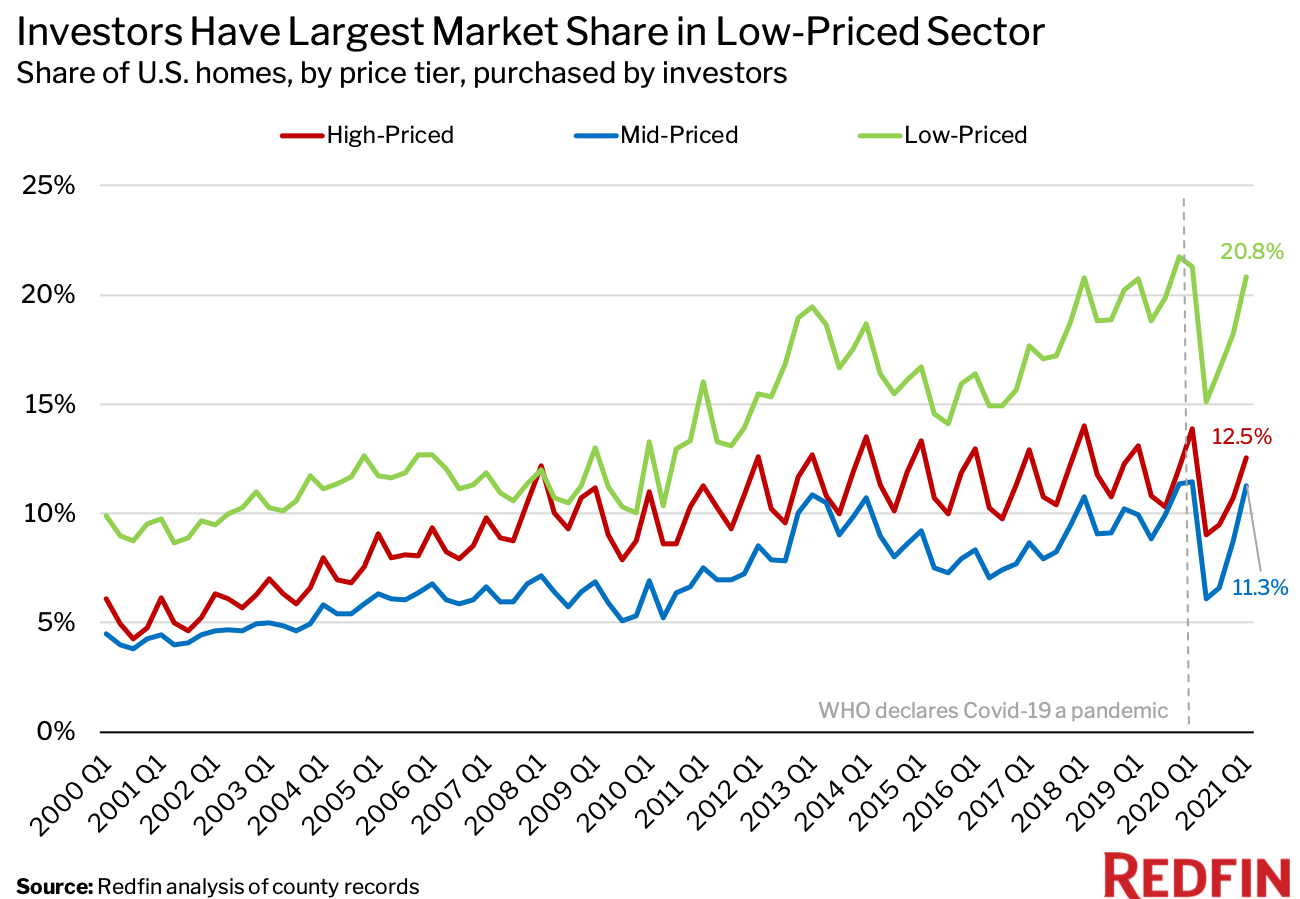
While investors have been snapping up high-priced homes during the pandemic, they still have the largest market share in the low-priced-home segment—a trend that has held constant for decades. In the first quarter, 1 of every 5 low-priced homes that sold in the U.S. (20.8%) was purchased by an investor. That compares with 12.5% of high-priced homes and 11.3% of mid-priced homes.

In Miami, nearly a quarter (23.8%) of homes that sold in the first quarter were purchased by investors—the highest share of the 41 U.S. metropolitan areas we analyzed. Next came Atlanta (22.2%), Jacksonville, FL (22.1%), Charlotte, NC (21.5%), Las Vegas (19.7%) and Phoenix (19.7%).
In recent years, investors and individual homebuyers alike have crowded into mid-sized cities that are more affordable than major hubs like San Francisco and New York. This trend has been accelerated by the pandemic, with so many Americans suddenly able to work from anywhere. These markets have become increasingly competitive for buyers.
In Charlotte, for example, 53.5% of homes sell for more than their list prices, up from just 16.2% in 2015. Over that same time span, investor market share (the portion of all homes being bought by investors) increased to 21.5% from 12.9%. Investors likely started growing their footprints in mid-sized cities because they noticed those areas were heating up, which then made those markets even more competitive. Homebuyers in places like Charlotte may find themselves going head to head with investors in bidding wars, and it can be tough to compete. After all, nearly three-quarters (74.2%) of investor home purchases were paid for with all cash in the first quarter, up from 69.7% a year earlier and the highest level since 2018.
While investors can be formidable competitors, individual homebuyers in Atlanta are still finding ways to win, according to local Redfin real estate agent Ronisha Carson.
“The buyers in today’s market understand what they need to do to close the deal,” Carson said. “They know that they will most likely compete in a bidding war, so they’re offering over the asking price, waiving the appraisal contingency and paying in cash if they can in order to compete with cash investors.”
In Providence, RI, just 5.6% of homes that sold in the first quarter were bought by investors—a lower share than any other metro in this analysis. It was followed by Montgomery County, PA (7.7%), Warren, MI (8%), New Brunswick, NJ (8.1%), Pittsburgh (8.2%) and Washington, D.C. (8.3%).
In San Jose, CA, investor home purchases rose 44% year over year in the first quarter—a bigger jump than any other metro we analyzed. Next came Detroit (up 33.8%), Chicago (up 27.2%), Riverside, CA (up 24.5%), Oakland, CA (up 24.4%) and Seattle (up 23.3%).
Investor purchases fell the most in Pittsburgh, sinking 75.7% year over year. The second-biggest drop was in Cleveland (down 44%), followed by Philadelphia (down 29.9%), New York (down 28.7%), West Palm Beach, FL (down 24.6%) and Nassau County, NY (down 22.1%).
For this analysis, we looked at county sale records for homes purchased from January 2000 through March 2021. We define an investor as any buyer whose name includes at least one of the following keywords: LLC, Inc, Trust, Corp, Homes. We also define an investor as any buyer whose ownership code on a purchasing deed includes at least one of the following keywords: association, corporate trustee, company, joint venture, corporate trust. This data may include purchases made through family trusts for personal use.
We analyzed home sales in the 50 most populous metro areas, but only included 41 metros in this report due to non-disclosure of sale prices in several counties.
For the price-tier analysis, we looked at all home sales in a given year and sorted each sale into one of three buckets: low-priced, mid-priced or high-priced. Low-priced means a home’s sale price was in the bottom tercile of local sale prices, while mid-priced means it was in the middle tercile and high-priced means it was in the top tercile.


