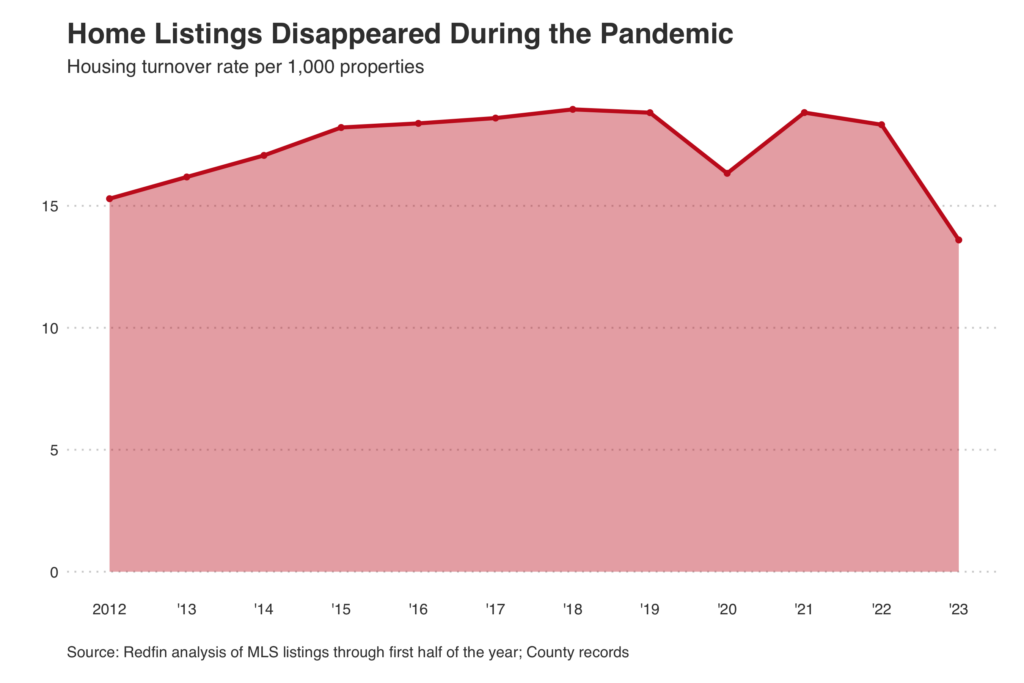
Roughly 14 of every 1,000 U.S. homes changed hands during the first six months of 2023, down from 19 of every 1,000 during the same period of 2019 and the lowest turnover rate in at least a decade. That means prospective homebuyers have 28% fewer homes to choose from than they did before the pandemic upended the U.S. housing market.

That’s according to a Redfin analysis of housing turnover comparing the first six months of 2023 with the first six months of 2019 across different home and neighborhood types. We’re using turnover as a measure of housing availability; it indicates how often homes change hands in a given area. This analysis includes overall for-sale housing turnover and breakdowns based on neighborhood type and home type. See the end of this report for more details on methodology.
The pre-pandemic turnover rate noted above (roughly 20 of every 1,000 sellable homes change hands in the first half of a year) is fairly typical for the modern housing market, but a more active market would have a rate closer to 40 or 50 of every 1,000.
The wild pandemic-era housing market has intensified an existing shortage of homes for sale and led to this year’s low turnover rate. In 2018, Freddie Mac estimated that about 2.5 million more homes needed to be built to meet demand, with the shortfall mainly due to a lack of construction of single-family homes. The homebuying boom of late 2020 and 2021, driven by record-low mortgage rates, remote work and a surge in investor purchases, depleted already low inventory levels. Finally, 2022’s soaring mortgage rates–average rates nearly doubled from January to June–exacerbated the shortage by handcuffing homeowners to their comparatively low rates. Some homeowners have opted to renovate their current home, and some are buying another home but hanging onto their first one and renting it out to either a longterm tenant or short-term vacationers. Now, the supply of homes for sale is at a record low.
“The quick increase in mortgage rates created an uphill battle for many Americans who want to buy a home by locking up inventory and making the homes that do hit the market too expensive. The typical home is selling for about 40% more than before the pandemic,” said Redfin Deputy Chief Economist Taylor Marr. “Mortgage rates dropping closer to 5% would make the biggest dent in the affordability crisis by freeing up some inventory and bringing monthly payments down. But there are a few other things that would boost turnover and help make homes more affordable. Building more housing is imperative, and federal and local governments can help by reforming zoning and making the building process easier. Financial incentives, like reducing transfer taxes for home sellers and subsidizing major moves with tax breaks, would also add to supply.”
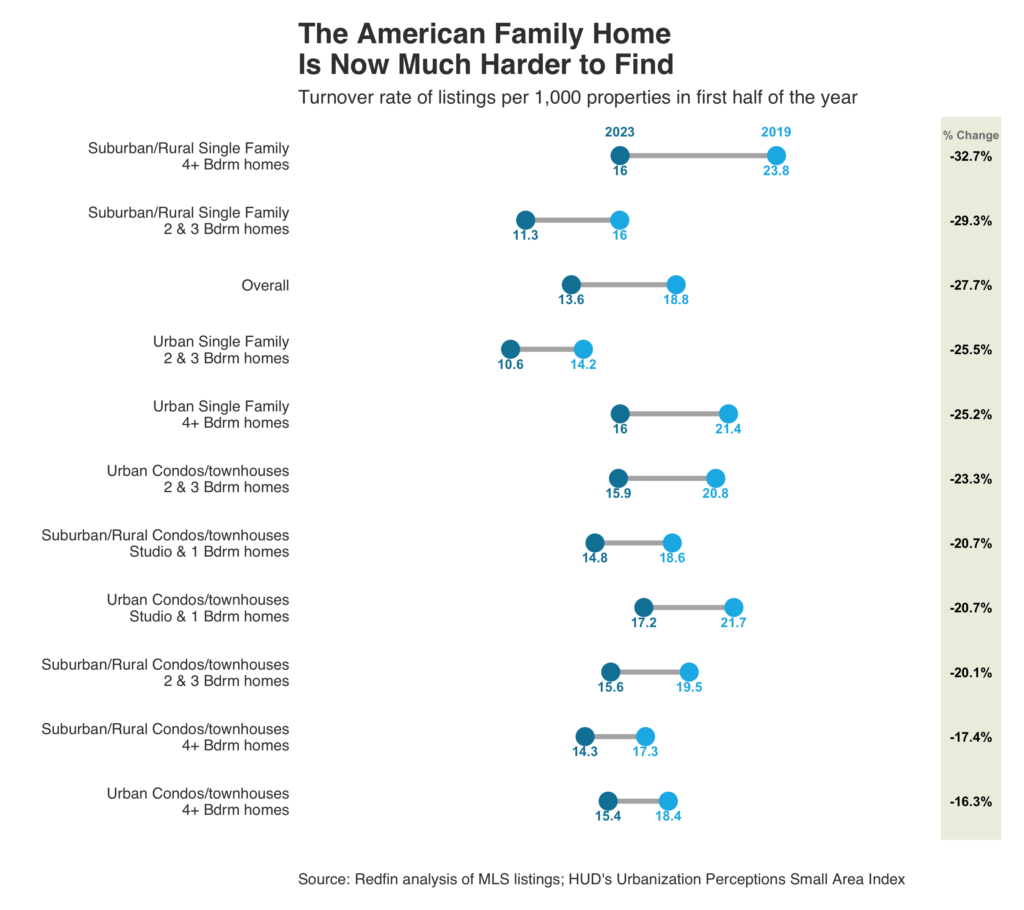
House hunters searching for large homes in the suburbs have seen the biggest drop in their options. Just about 16 of every 1,000 four-bedroom-plus suburban single-family homes sold in the first half of this year, down from 24 of every 1,000 that sold in the same period in 2019. That means buyers of that home type have 33% fewer houses to choose from.

The turnover rate has dropped for every size home in every type of neighborhood over the last four years (though buyers will have an easier time finding something for sale in certain metro areas, as outlined below). That trend can be seen in the chart above, which displays the national post-pandemic housing turnover rate on the left and the pre-pandemic rate on the right. The length of the line between the two dots indicates how much turnover declined from 2019 to 2023, with the biggest declines at the top.
The turnover rate of large single-family suburban homes has shrunk most because that type of home exploded in popularity during the pandemic. Remote workers flocked to the suburbs, untethered from the office, and purchased large properties with space for adults to work from home and children to attend school from home.
“New listings normally hit the market on Thursdays, and I have buyers who are excitedly checking their Redfin app Thursday mornings, only to find nothing new,” said Phoenix Redfin Premier agent Heather Mahmood-Corley. “That goes for buyers in every price range in every type of neighborhood, but what people want most are those move-in ready, mid-sized homes in neighborhoods with highly rated schools. Those are hardest to find because for people to buy one, someone needs to sell one. That’s not happening, because so many of those homeowners have low mortgage rates.”
The turnover rate of condos and townhomes didn’t shrink as much as that of single-family homes during the pandemic, though condo and townhouse buyers are still about 20% less likely to find that type of home than they were in 2019.
Supply of that home type wasn’t depleted as much because there wasn’t as much demand for them during the pandemic. In fact, many remote workers were selling condos and townhouses in favor of single-family homes with more space.
Smaller houses in the city have the lowest turnover rate of all the home types in this analysis. Roughly 11 of every 1,000 two- and three-bedroom single-family homes in urban neighborhoods sold in the first six months of 2023, compared to 14 of every 1,000 during the same period in 2019.
Two- to three-bedroom homes in suburban neighborhoods are essentially tied with their urban counterparts for the lowest turnover rate, with 11 of every 1,000 changing hands this year. That’s down from 16 of every 1,000 in 2019.
Modestly sized single-family homes in all kinds of neighborhoods have long been hard for buyers to find. That’s because builders don’t make many of them anymore, and homeowners tend to hold onto the ones that exist.
Today’s homebuilders tend to focus on the kind of home that’s in demand and profitable: Larger single-family homes, which don’t cost much more to build than smaller ones but sell for more money, and condos and townhouses, which cost less to build. And people who own those starter-type homes often turn them into rental properties rather than selling when they move up to bigger houses. Homeowners can often cover their mortgage and then some when renting out this type of home, especially in desirable neighborhoods; that income paired with the home’s value increasing over time incentivizes keeping rather than selling.
Northern California has the lowest turnover rate in the U.S. Just six of every 1,000 homes in San Jose changed hands in the first half of 2023, the lowest rate of the 50 most populous U.S. metros. It’s followed closely by Oakland, San Diego, Los Angeles, Sacramento and Anaheim, all places where about eight of every 1,000 homes turned over to a new owner.
The pandemic exacerbated the supply shortage throughout California, with the turnover rate dropping by at least 30% in each of those metros from 2019 to 2023.
Zooming in on large, suburban single-family homes, California still has the lowest turnover rate. Six of every 1,000 homes of that type have sold this year in San Jose (-40% since 2019), the lowest rate in the nation. Next come Oakland (7 of every 1,000; -43%), San Diego (8 of every 1,000; -51%), Sacramento (9 of every 1,000; -41%) and Anaheim (9 of every 1,000; -41%).
California historically has the lowest housing turnover because the state’s tax laws–namely proposition 13–incentivizes homeowners to stay put by limiting property-tax increases. Today’s elevated mortgage rates intensify that by giving homeowners two financial incentives to stay put: Low property taxes and comparatively low mortgage rates.
Newark, NJ has the highest turnover rate in the U.S., with 24 of every 1,000 homes changing hands during the first six months this year. It’s followed closely by Nashville, TN (23 of every 1,000) and Austin, TX (22 of every 1,000). Nashville and Austin are also two of the three metros (along with Fort Worth, TX) with the highest turnover for large suburban, single-family homes.
Newark buyers still have far fewer homes to choose from than they did before the pandemic, with a 42% drop in turnover since 2019. Only New Brunswick, NJ (-49%) and San Diego (-46%) had bigger declines. Zooming in on large suburban houses, New Brunswick (-55%), Chicago (-54%) and New York (-52%) had the biggest drops in turnover.
But Nashville and Austin are both among the five metros with the smallest declines in turnover since 2019, posting drops of just 10% and 14%, respectively. When it comes to large suburban houses, Nashville and Austin have the second and third smallest declines. That’s partly due to robust new construction in Nashville and Austin: Inventory of single-family homes for sale in both metros is made up of more than 30% newly built homes, compared to 22% nationwide.
Only Milwaukee and Columbus, OH, which both saw overall turnover drop by about 8% from 2019 to 2023, had smaller declines in turnover than Nashville. Indianapolis, IN comes in fourth, with a 14% decline. Milwaukee, Columbus and Indianapolis have relatively stable turnover because they didn’t experience huge homebuying demand swings throughout the pandemic.
This is according to a Redfin analysis of turnover rates, based on MLS data, county records, and the HUD’s urbanization perceptions small area index. The turnover rate is defined as the number of homes that are listed to sell divided by the total number of sellable properties (single-family, condos/co-ops, townhomes, and multi-family 2-4 unit properties only) that exist in a certain place. The analysis compares turnover rates during the first six months (January-June) of 2019 with the first six months of 2023. This analysis was limited to the 50 most populous metropolitan divisions in the U.S.


