

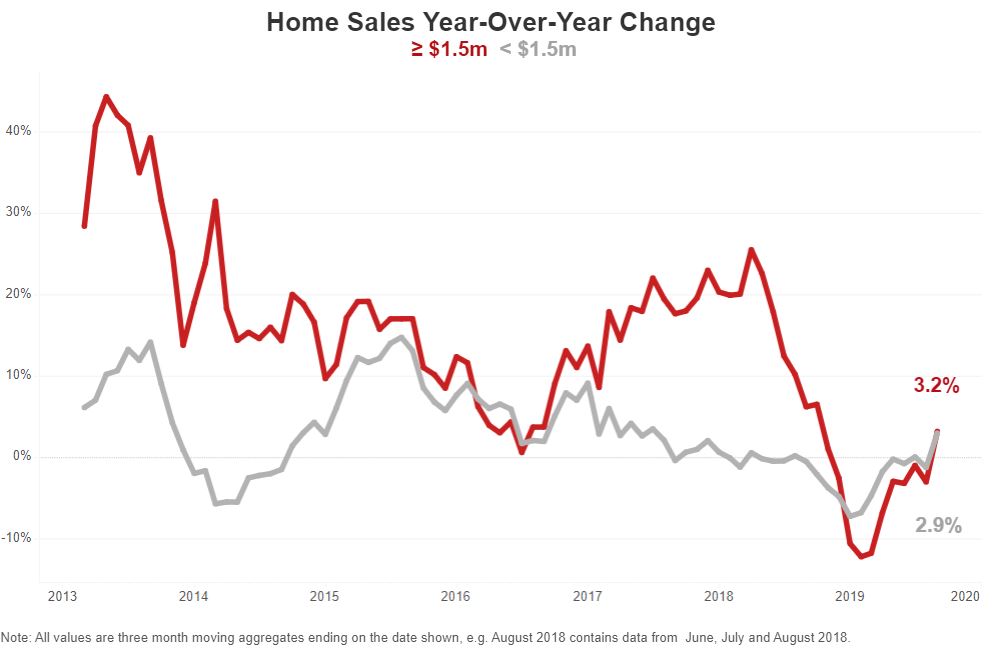
Sales of homes priced at or above $1.5 million increased 3.2% annually, a sign that the high-end market is moderating after recession fears marred the first two quarters.
The average sale price for luxury homes nationwide rose 0.3 percent year over year to $1.6 million in the third quarter of 2019. Though that’s essentially flat, it marks the first time luxury prices did not drop after three straight quarters of declines.
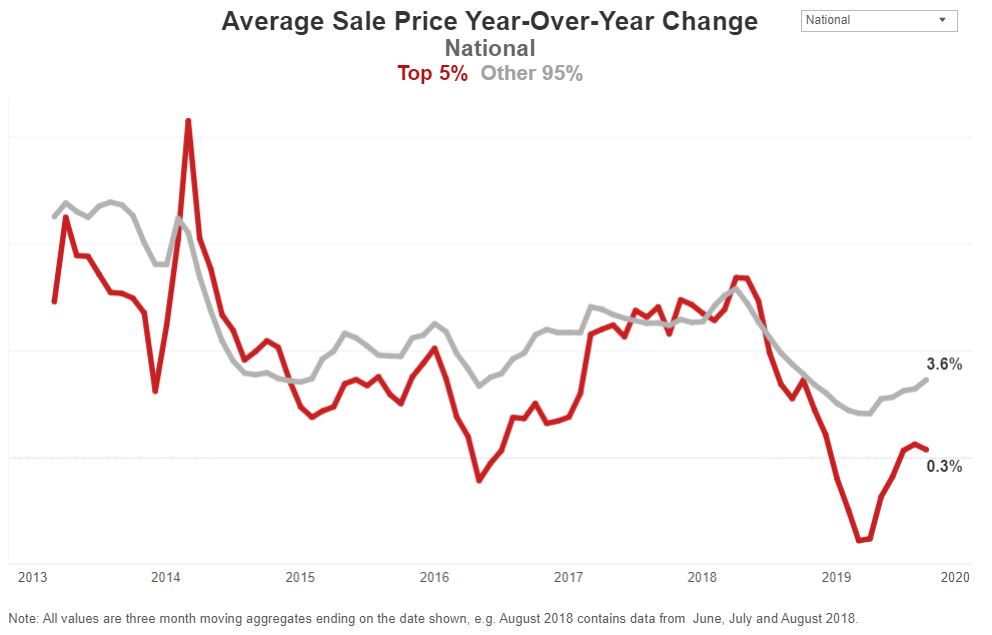
For this analysis, Redfin tracks home sales in more than 1,000 cities across the U.S. (not including New York City) and defines a home as luxury if it’s among the 5 percent most expensive homes sold in the quarter. In the other 95 percent of the market, home prices increased 3.6 percent annually to an average of $319,000 in the third quarter.
Sales of homes priced at or above $1.5 million rose 3.2 percent in the third quarter. The increase comes after three straight quarters of dipping sales in the luxury sector, including a 12 percent annual drop in the first quarter of 2019. Sales of homes priced below $1.5 million experienced a similar annual increase, with a 2.9 percent rise.
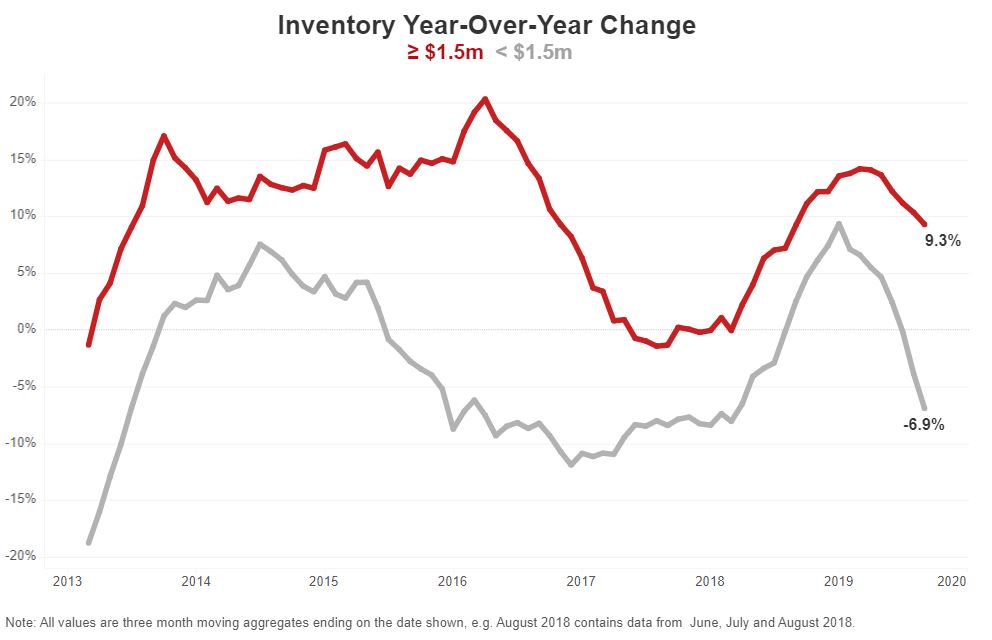
Supply of homes priced at or above $1.5 million rose 9.3 percent year over year in the third quarter, the sixth consecutive quarter of growth, albeit the smallest annual increase in a year. Supply of homes priced under $1.5 million dropped 6.9 percent year over year during the third quarter.
The big increase in luxury supply was largely driven by a boost in the number of high-priced homes hitting the market. New listings priced at or above $1.5 million rose 6 percent year over year in the third quarter, while new listings of homes priced below $1.5 million dropped 4 percent.
Although the luxury housing market is still relatively tepid, it’s stronger than it was during the first half of the year.
“Because recession fears peaked over the summer, I expected luxury home prices and sales to dip. But it appears that nerves alone weren’t enough to scare off wealthy homebuyers,” said Redfin chief economist Daryl Fairweather. “The U.S. economy grew faster than expected in the third quarter, partly as a result of healthy consumer spending. Those results, along with flat luxury home prices and rising sales, go to show that Americans are basing their spending habits on their own personal financial situation rather than concerns about global economic tensions. For many, that means strong incomes and good employment prospects.”
Although Redfin doesn’t track New York City housing data, it appears that Manhattan was an exception to the stabilizing luxury market last quarter as sales plummeted due to an increase in the city’s mansion tax.
Luxury housing market summary
Twenty-two percent of luxury homes sold above their list price in the third quarter, down from more than 27 percent a year ago. In the non-luxury market, 24.6 percent of homes sold above list price, a small decline from 25.9 percent the year before.
The typical luxury home sold in the third quarter took 53 days to go under contract, 12 days slower than last year. Inventory growth peaked in the first quarter but sales only started to increase in the third quarter, which means some of the luxury homes listed in the beginning of the year were on the market for several months.
Biggest price gains
Luxury prices increased in more than two-thirds of the markets tracked by Redfin. West Palm Beach tops the list, with a 128.3 percent year-over-year increase to an average price of more than $3.7 million. It’s followed by two other cities in Florida: Clearwater (up 49.3% to $1.6 million) and Delray Beach (up 47.3% to $2.6 million).
West Palm Beach Redfin agent Elena Glatko said one driving force in the particularly large year-over-year price increase in West Palm Beach in the third quarter was dozens of sales in a new luxury condo building, with sale prices for individual units spanning from roughly $4 million to more than $12 million. Glatko also noted a few other factors that contribute to the area’s strong luxury market.
“Homebuyers can get a lot more for their money in West Palm Beach than in more expensive places like Miami and Palm Beach Island,” Glatko said. “And I’ve noticed that both luxury buyers and sellers feel that real estate is one of the assets least susceptible to economic changes. They believe that over time, luxury real estate is a better investment than the stock market.”
Here’s a look at the top 10 cities where luxury home prices rose most in the third quarter of 2019:
Biggest price declines
Luxury home prices in Charleston, South Carolina declined 17.6 percent to an average of $1.6 million in the third quarter, a bigger drop than any other city. Next come Virginia Beach (down 7.6% to $1 million) and Reno (down 6.9% to about $1.5 million).
Luxury prices also declined in San Diego (down 4% to about $2.6 million), Miami (down 3.8% to about $2 million), San Jose (down 3.2% to about $2.3 million) and Scottsdale (down 1.5% to about $2 million).
“There’s been less activity in the luxury market in Miami over the last few years, and now it’s definitely shifting toward buyer’s favor,” said local Redfin agent Jessica Johnson. “ Sellers in the area can’t get away with overpricing their home because buyers are less willing to overpay when they know luxury prices aren’t increasing in Miami—if they can’t get a good deal on one particular luxury home, they can probably go down the street or to another neighborhood and find a seller who is willing to negotiate with them.”
Here are the top 10 cities where luxury home prices declined most in the third quarter of 2019:
Most expensive sales
Not everyone can afford a brand-new Beverly Hills estate with eight bedrooms or a luxurious 2,000-acre ranch in Utah, but we can all look at pictures. Here are the 10 most expensive home sales of the third quarter:
Methodology
Redfin tracks the most expensive five percent of homes sold in more than 1,000 U.S. cities (not including New York City) and compares price changes to the bottom 95 percent of homes in those cities. Analysis is based on multiple-listing and county recorder sales data in markets served by Redfin. To determine cities with the biggest year-over-year price increases and decreases, we looked at cities with at least 45 luxury sales in the quarter and an average luxury sale price of $1 million or higher. For the national average home price, we included the top 5 percent of home sales by price nationwide, and for city-level average sale prices, we included the top 5 percent of sales by price for each individual market. For inventory and sales, Redfin looked at homes priced at or above $1.5 million that were sold in the third quarter of 2019.
