

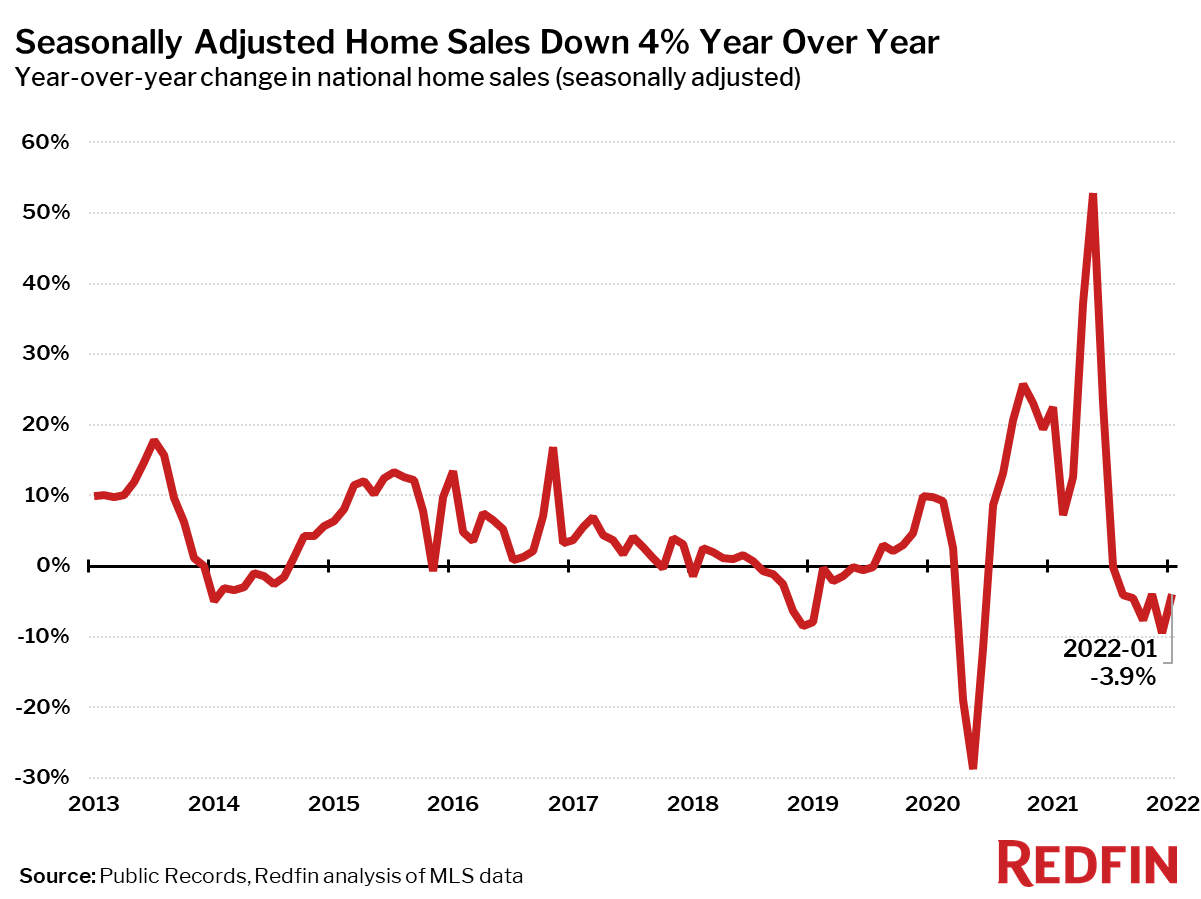
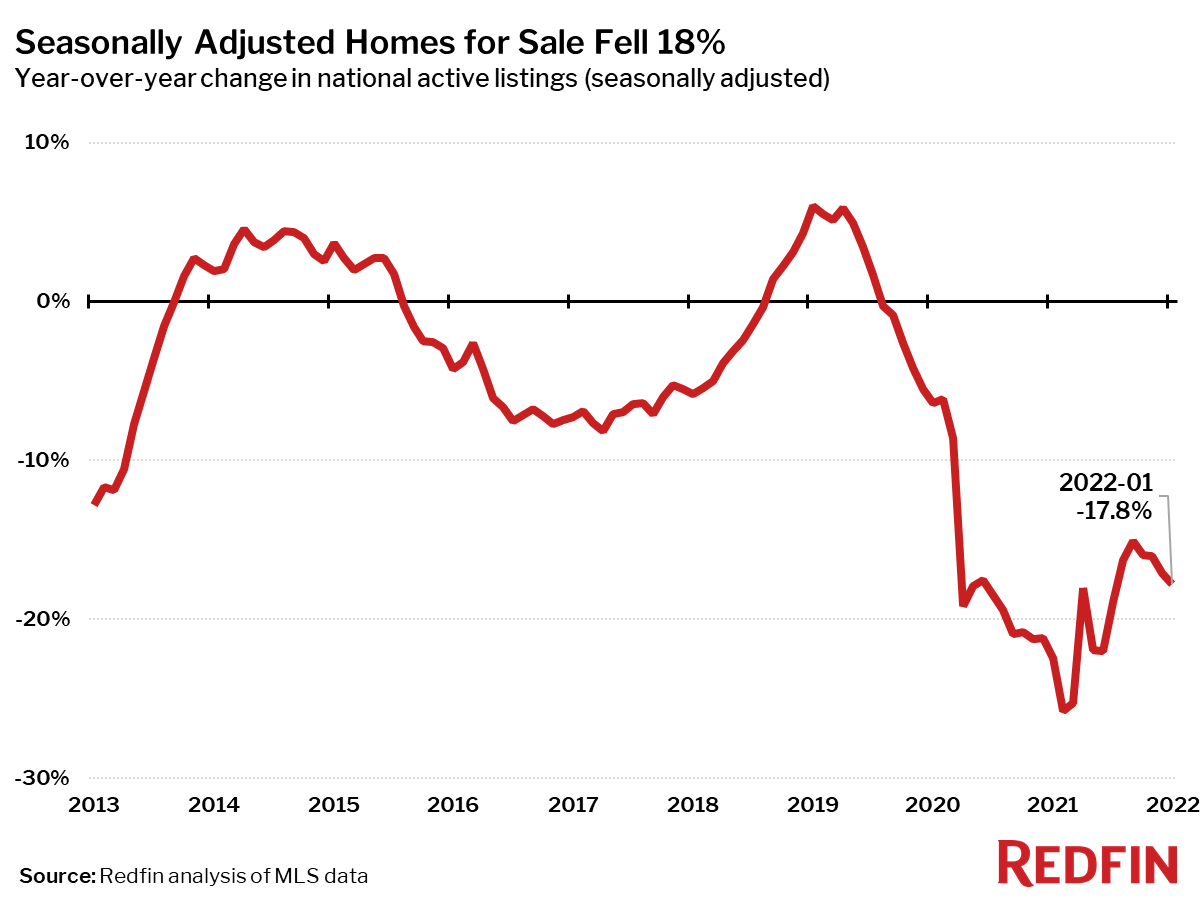
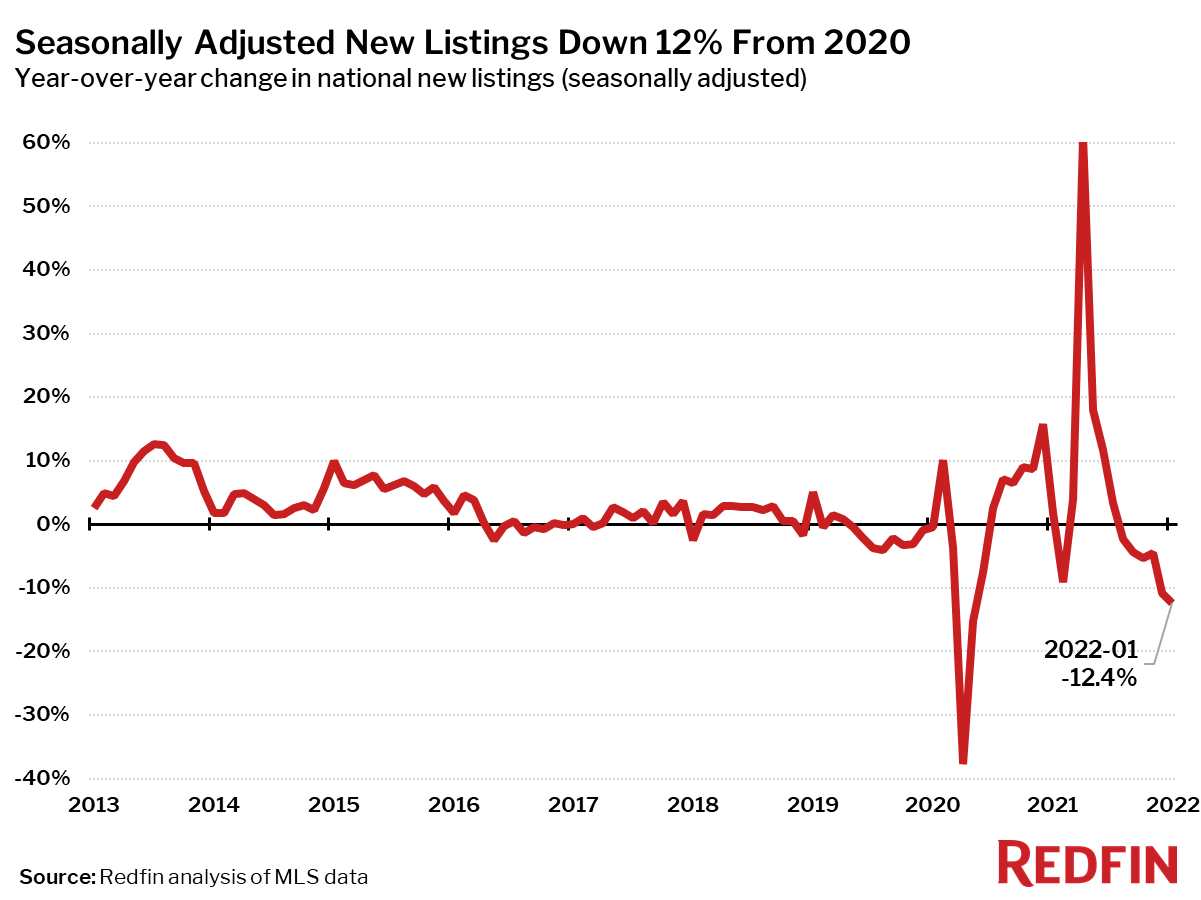
Fewer homes than ever were for sale in January, but homebuyers snapped up what they could before mortgage rates rose further. Seasonally adjusted new listings fell 12.4% month over month, bringing the number of homes for sale down 2.6% to a record low. But demand persisted, and sales rose 7.5%.
“We believe that the inventory crunch will ease in the summer as rates rise, but may not go away in 2022,” said Redfin CEO Glenn Kelman on Redfin’s Q4 earnings call. “We’re well aware of the economic pressures on homebuyers, but so many people are still so desperate to move that sales for now are still mostly constrained by inventory, not prices or even mortgage rates.”
“Homebuyers have zero leverage to negotiate right now,” said Dallas Redfin real estate agent Barbara Tidwell-Vincent. “Even the homes that need work are hyper competitive thanks to all the investors in the market. Most of the homes hitting the market are listed by people who need to sell—estate sales, major life changes, that sort of thing. With so few homes for sale, everything is getting multiple offers. I had a client offer $70,000 over asking price and we never even got a phone call back. It used to be that if you had good credit, a down payment, and all your financial ducks in a row, you could get a house. Not anymore. Just to compete you practically need a duffel bag full of cash.”
The housing market is changing rapidly in the opening months of 2022 with mortgage rates up 0.81 points between December 30 and February 17. Rising rates are likely to slow competition somewhat by summer.
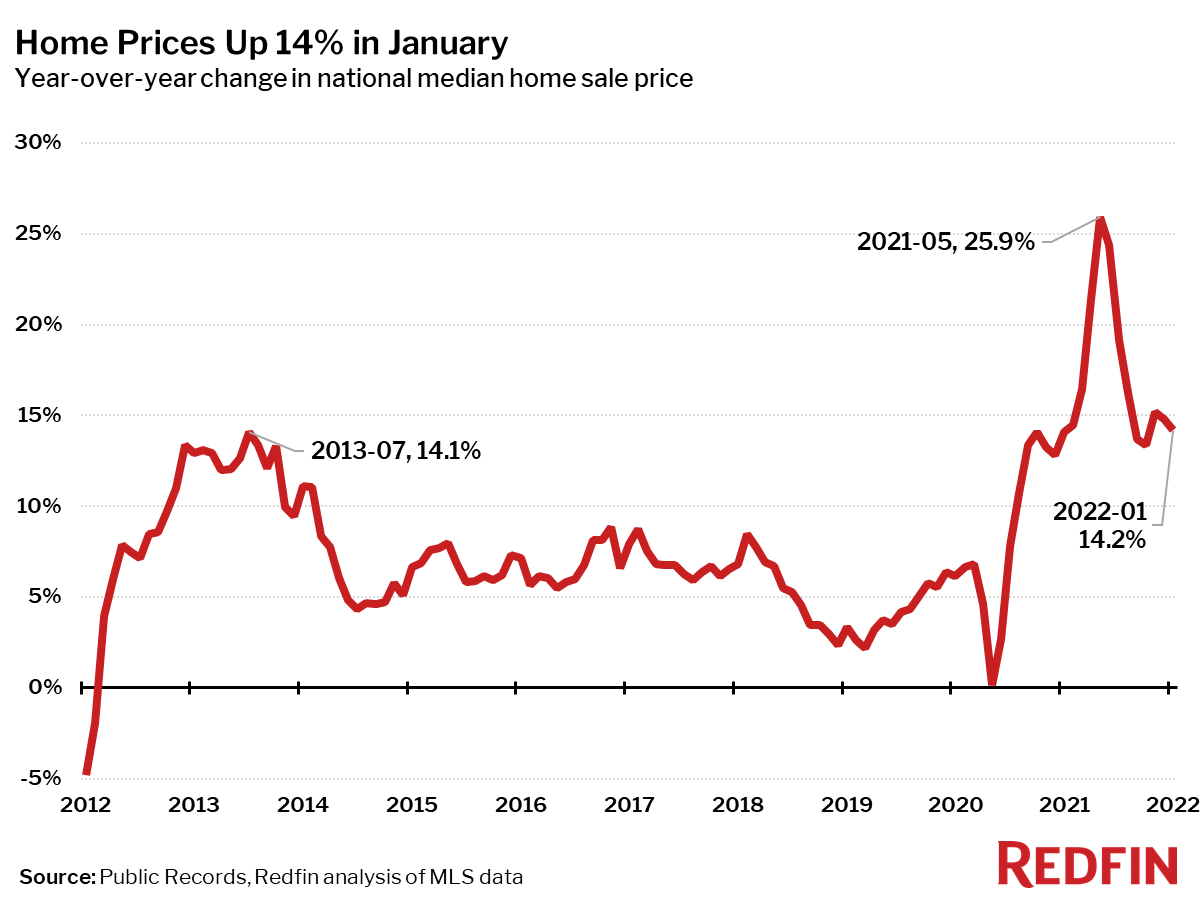
The national median home sale price in January was up 14% from a year earlier to $376,200. Median sale prices increased from a year earlier in all but one of the 88 largest metro areas Redfin tracks. The only metro area with a decrease was Bridgeport, CT, where home prices fell 2% from a year earlier following a 22% year-over-year increase in January 2021. The largest price increases were in North Port, FL (+32%), Austin, TX (+32%) and Phoenix, AZ (+29%).
Seasonally-adjusted home sales in January were up 7.5% from a month earlier and down 4% from a year earlier. Home sales fell from the prior year in 66 of the 88 largest metro areas Redfin tracks. The biggest sales declines were in Fresno, CA (-29%), Seattle (-22%) and San Francisco (-20%). The largest gains were in Honolulu (+26%), Miami (+10%) and Tulsa, OK (+10%).
Seasonally adjusted active listings—the count of all homes that were for sale at any time during the month—fell 18% year over year to an all-time low in January.
All 88 of the largest metros tracked by Redfin posted year-over-year decreases in the number of seasonally adjusted active listings of homes for sale. The biggest year-over-year declines in active housing supply in January were in Allentown, PA (-46%), Anaheim, CA (-42%) and San Jose, CA (-41%).
The 12% year-over-year drop in seasonally adjusted new listings is the largest decline since May 2020. This large decline was due in part to a series of severe winter storms along the East Coast. New listings were down 20% or more in some of the hardest-hit areas, like Boston, Providence, RI, Raleigh, NC, and Washington, D.C.. New listings fell from a year ago in 84 of the 88 largest metro areas. The only metro areas that saw more listings than a year earlier were Tulsa, OK (+2%), Las Vegas, NV (+2%), Indianapolis, IN (+1%) and Detroit, MI (+1%).
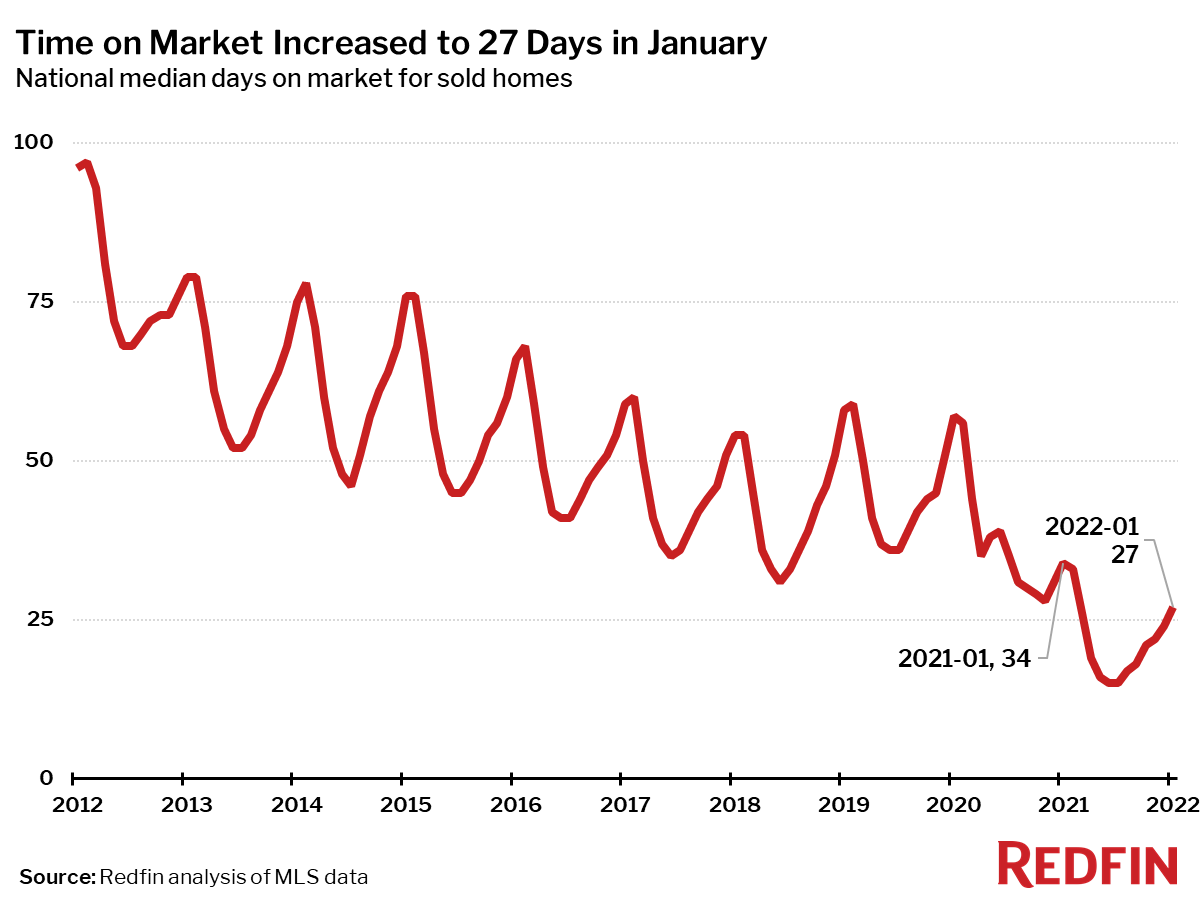
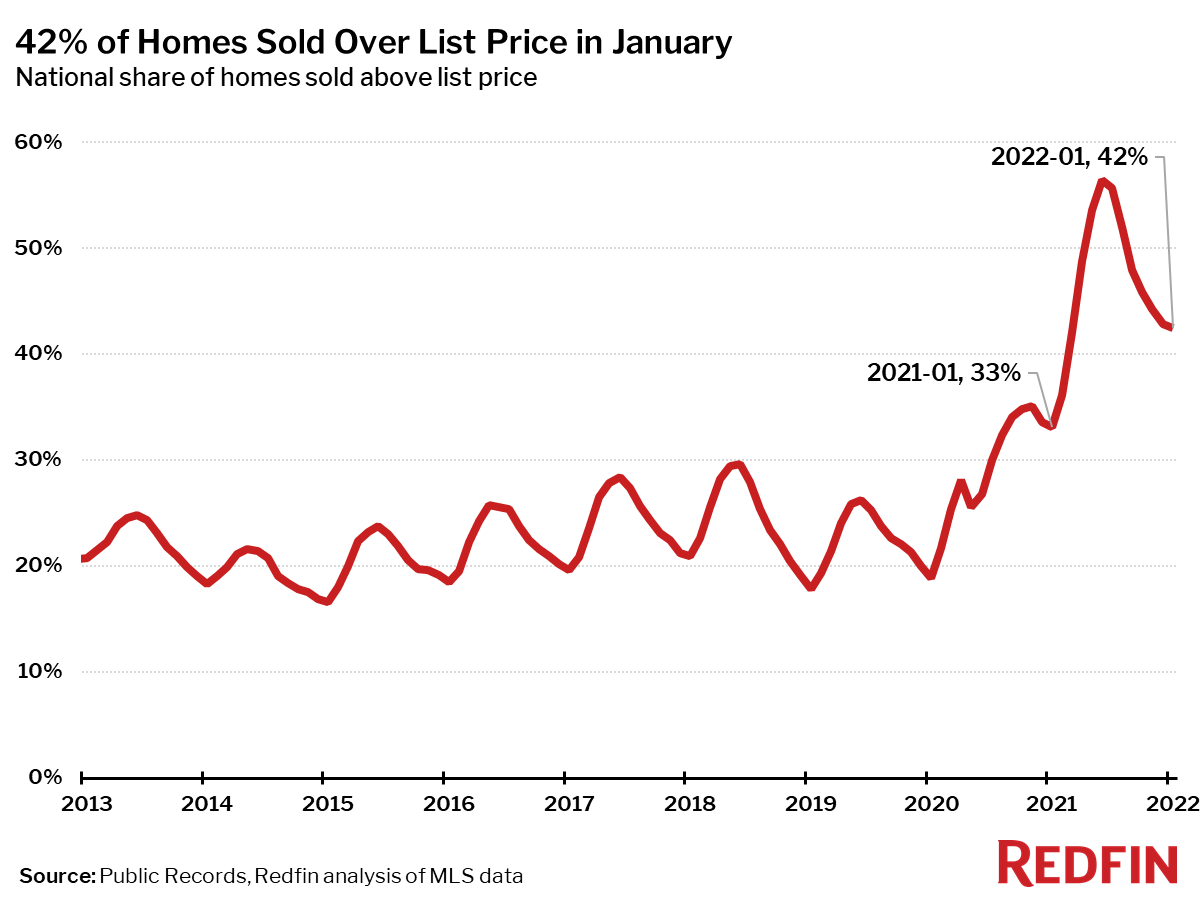
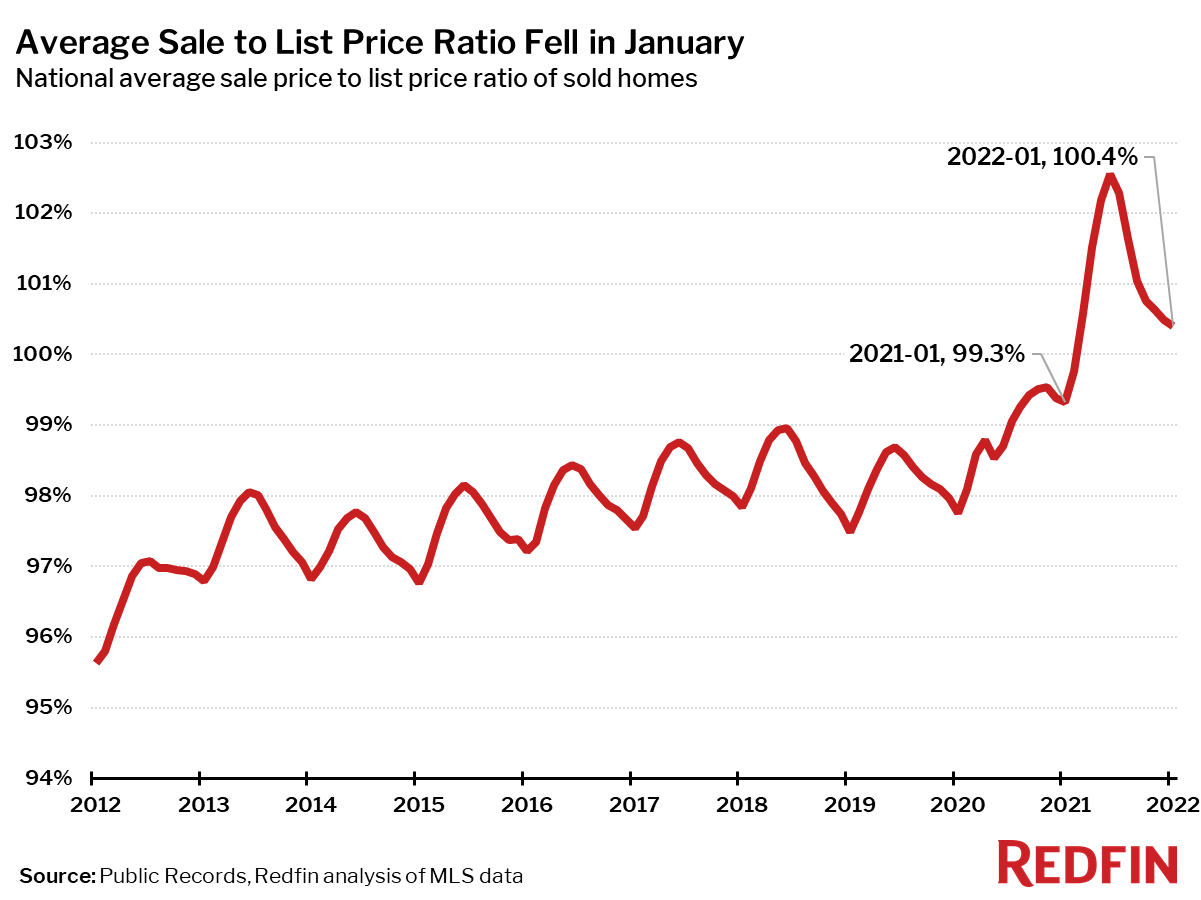
Despite rising prices, home sales that closed in January reflected a slightly less competitive housing market in the prior months. Homes spent longer on the market and were less likely to sell above list price compared to mid-2021.
The typical home that sold in January went under contract in 27 days—a week faster than a year earlier, when homes sold in a median 34 days, and up 12 days from the record low of 15 days in June.
In January, 42% of homes sold above list price, down 14 percentage points from the record high in June, but up 9 percentage points from a year earlier.
The average sale-to-list price ratio in December was 100.4%, down from a record high of 102.6% in June but up from 99.3% a year earlier.
Below are market-by-market breakdowns for prices, inventory, new listings and sales for markets with populations of 750,000 or more. For downloadable data on all of the markets Redfin tracks, visit the Redfin Data Center.
