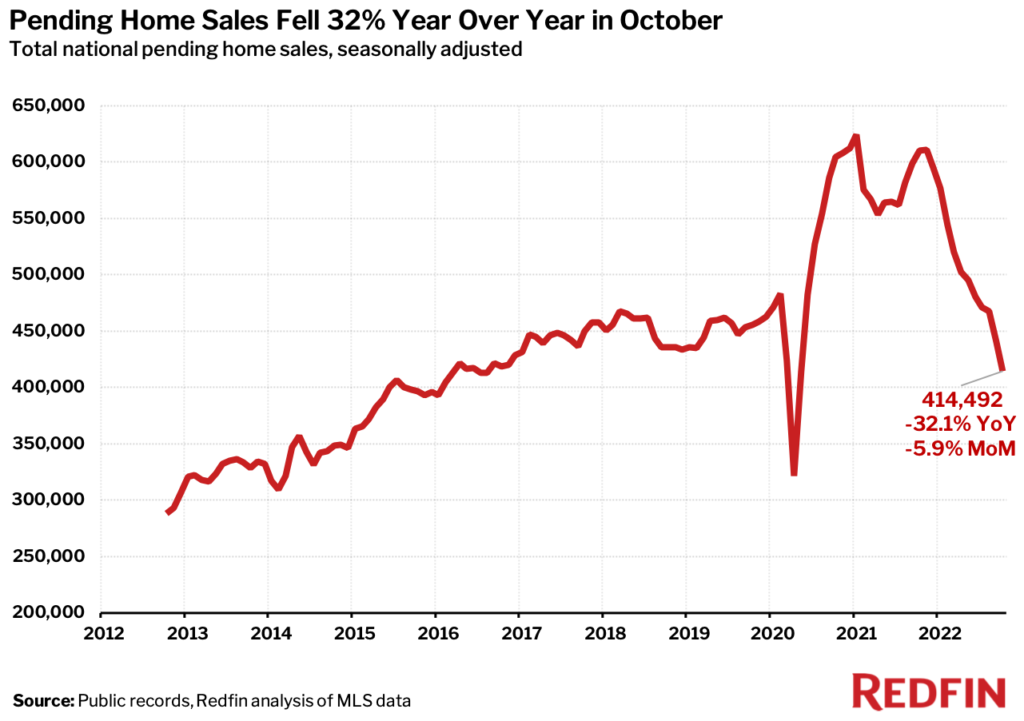
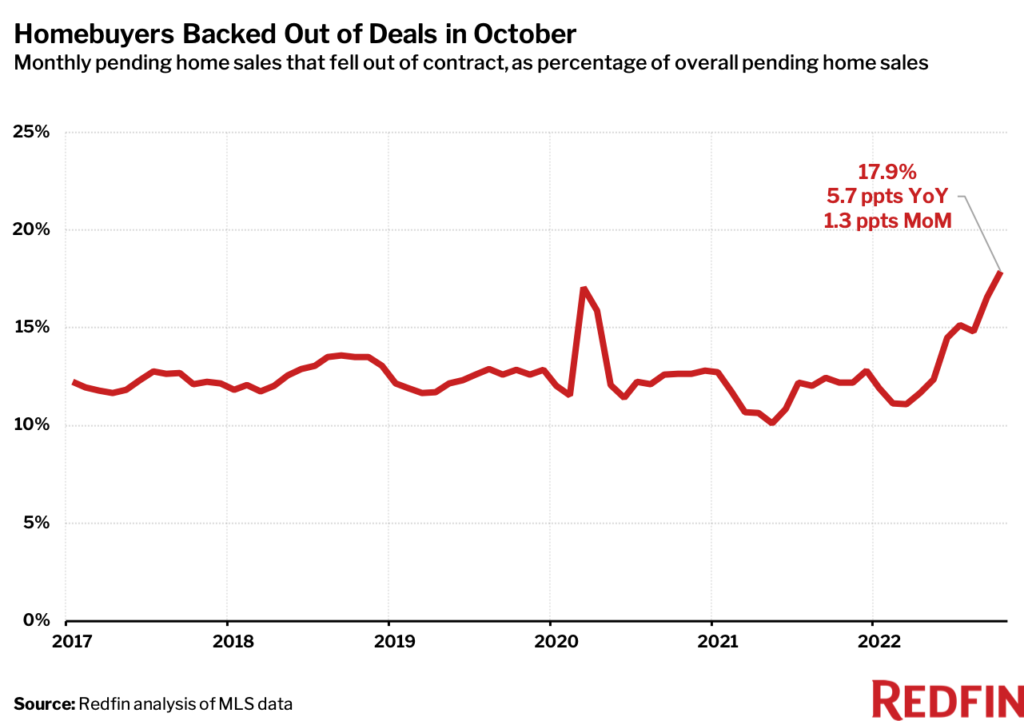
Pending home sales fell the most on record in October and deal cancellations and price cuts hit record highs as buyers were spooked by the biggest mortgage-rate jump in over four decades.
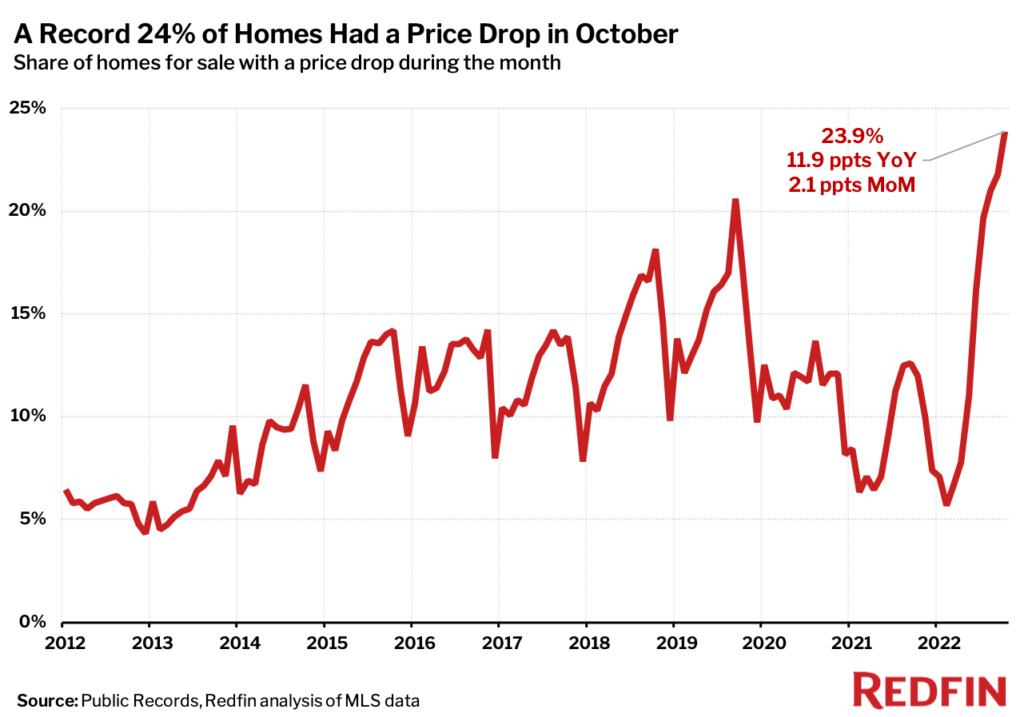
Pending sales dropped 32.1% year over year last month, the largest decline since at least 2013, when Redfin’s records begin. Nearly 60,000 home-purchase agreements fell through, equal to a record 17.9% of homes that went under contract. Meanwhile, almost one-quarter (23.9%) of homes for sale experienced a price drop, double the rate of a year earlier.
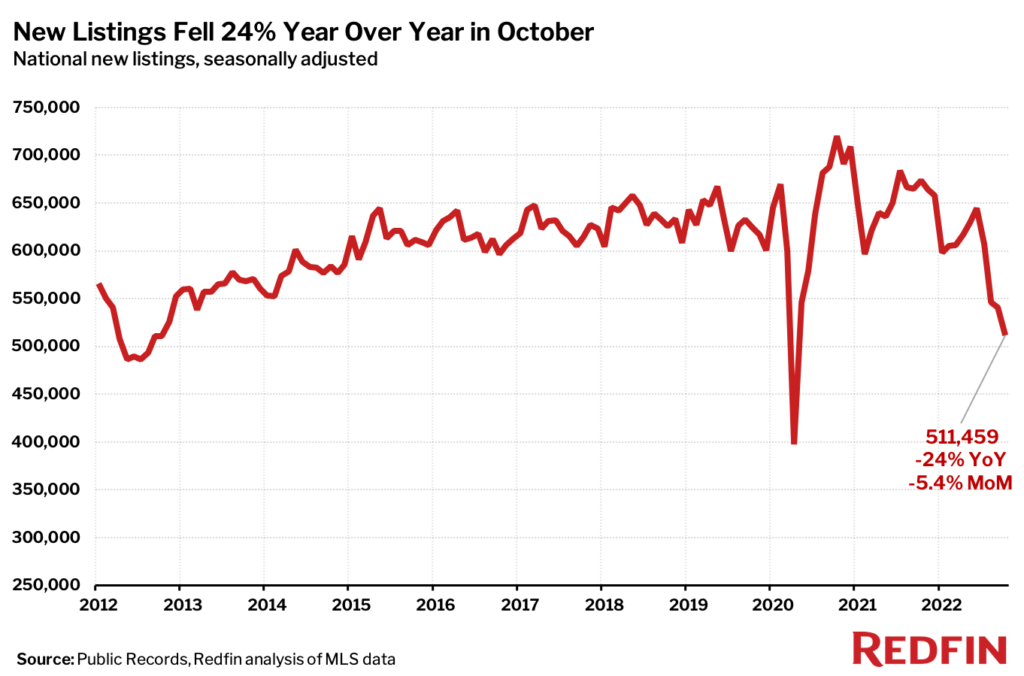
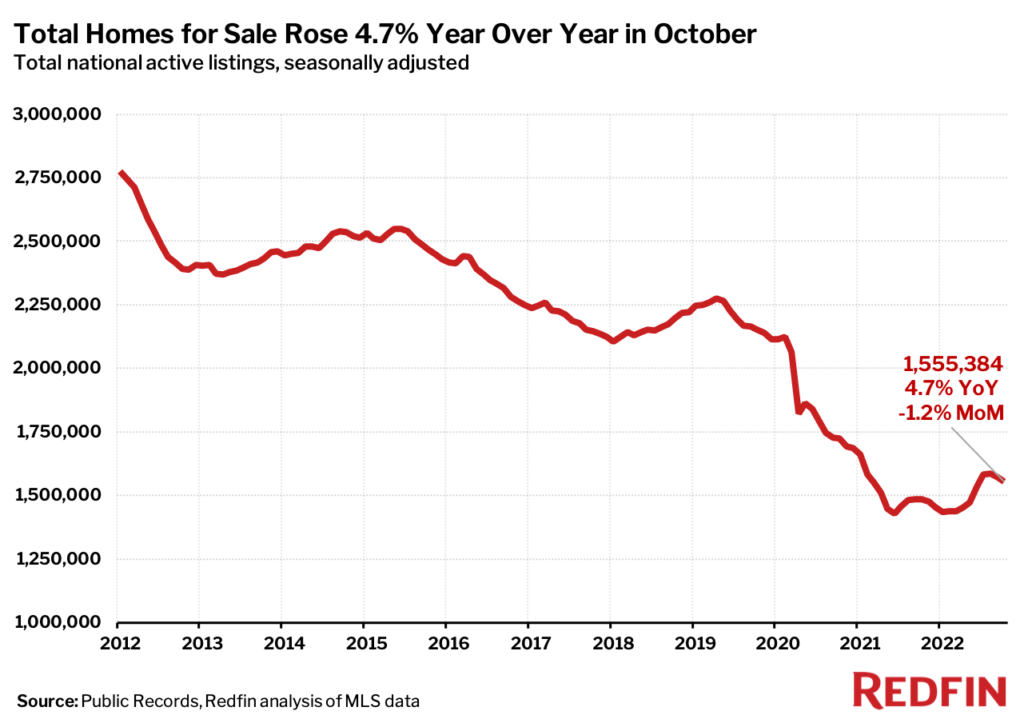
Surging mortgage rates also caused would-be sellers to stay put due to the lock-in effect. The average 30-year-fixed mortgage rate was 6.9% in October, up 3.83 percentage points from 3.07% one year earlier—the largest year-over-year increase during any month since 1981. That contributed to a 24% year-over-year drop in new listings, the steepest decrease on record aside from April 2020, when the onset of the pandemic brought the housing market to a near halt.
“The Fed’s actions to curb inflation are causing the housing market to slow at a pace not seen since the financial crisis,” said Redfin Economics Research Lead Chen Zhao. “There are already early but promising signs that inflation is cooling, which caused mortgage rates to drop last week. If that progress continues, buyers who recently backed out of deals may return to the market and sellers may be less inclined to slash their prices.”
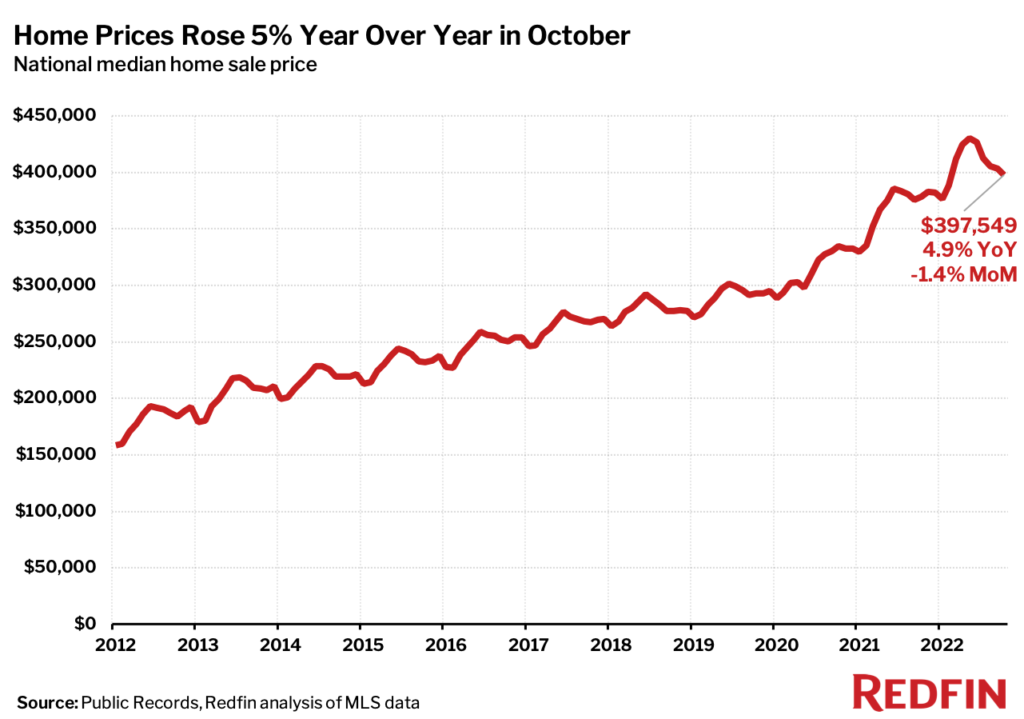
Still, sale prices have room to fall. The median U.S. home sale price declined 1.4% month over month—the largest slowdown during any October since 2012—but was up 4.9% from a year earlier.
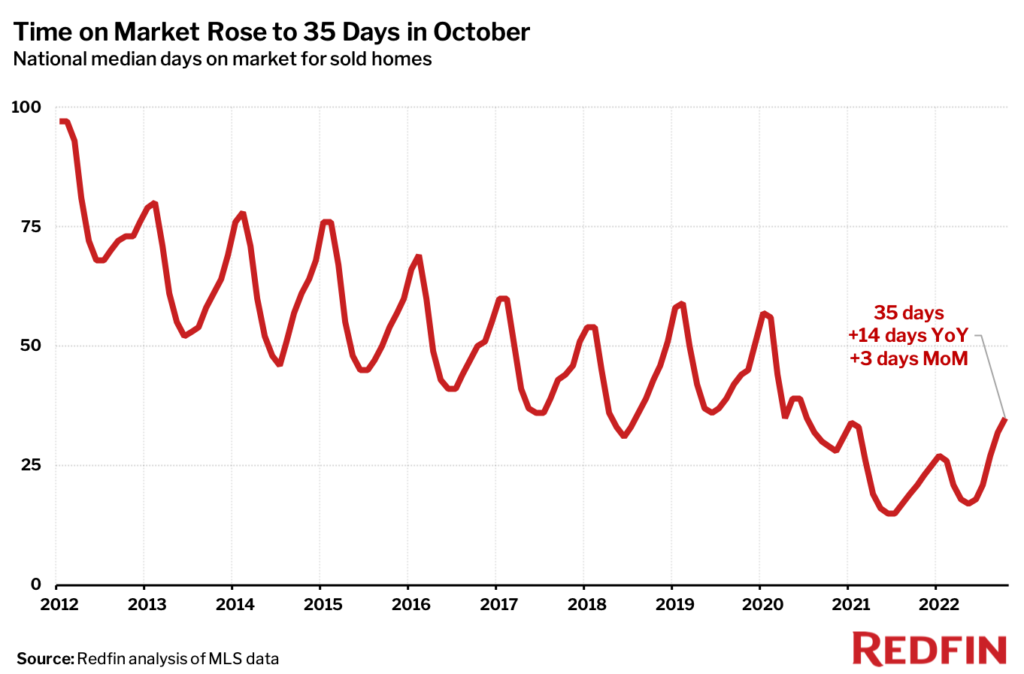
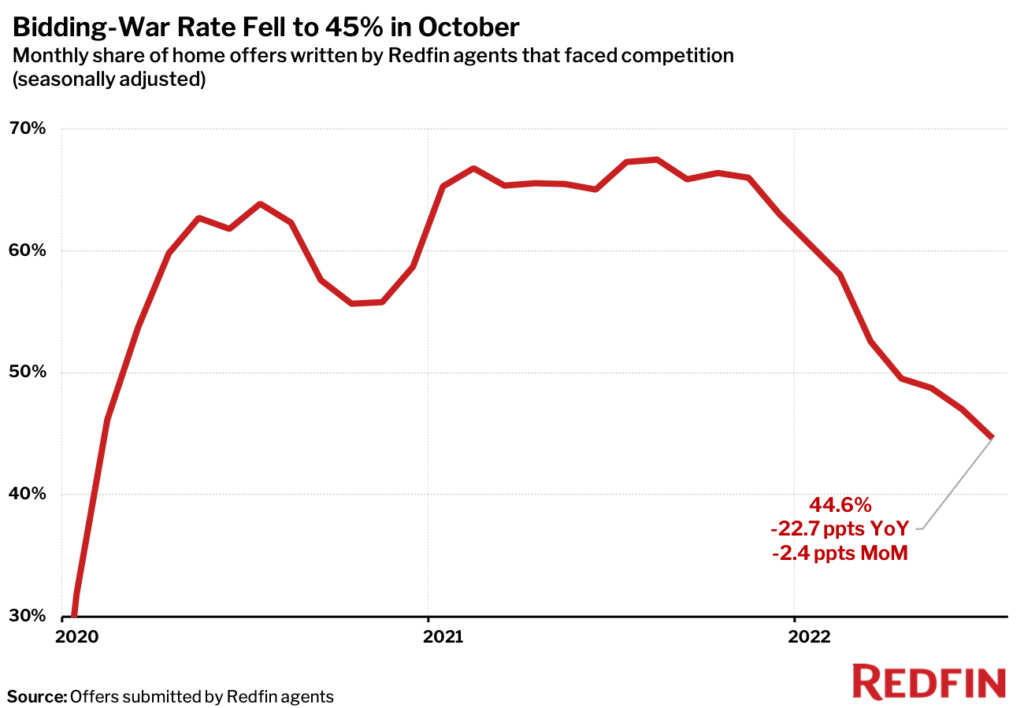
Prices may ease as listings linger on the market and competition slows. Homes that sold in October were on the market for a median of 35 days, up from 21 days a year earlier, and less than half (44.6%) of home offers written by Redfin agents faced competition. That compares with more than two-thirds (67.3%) in October 2021.
Note: Data is subject to revision
Bulleted rankings below came from a list of the 93 U.S. metro areas that have populations of at least 750,000, with the exception of rankings of bidding-war rates and home-purchase cancellations. The bidding-wars ranking came from a list of 36 metros—those that had a monthly average of at least 50 offers submitted by Redfin agents from March 2021 to March 2022. The home-purchase cancellations ranking came from a list of the 50 most populous metro areas. All changes are year over year unless otherwise noted.
For more metro-level trends, head to the Redfin Data Center.
Scroll down for national charts and market-by-market breakdowns. For downloadable data on all of the markets Redfin tracks, visit the Redfin Data Center. Refer to our metrics definition page for explanations of the metrics used in this report.