

The median sale price of U.S. luxury homes jumped 25.8% year over year in the second quarter, while the median sale price of the country’s most affordable homes rose 18.7%. By comparison, prices of mid-priced and affordable homes grew just 16% and 13.2%, respectively.
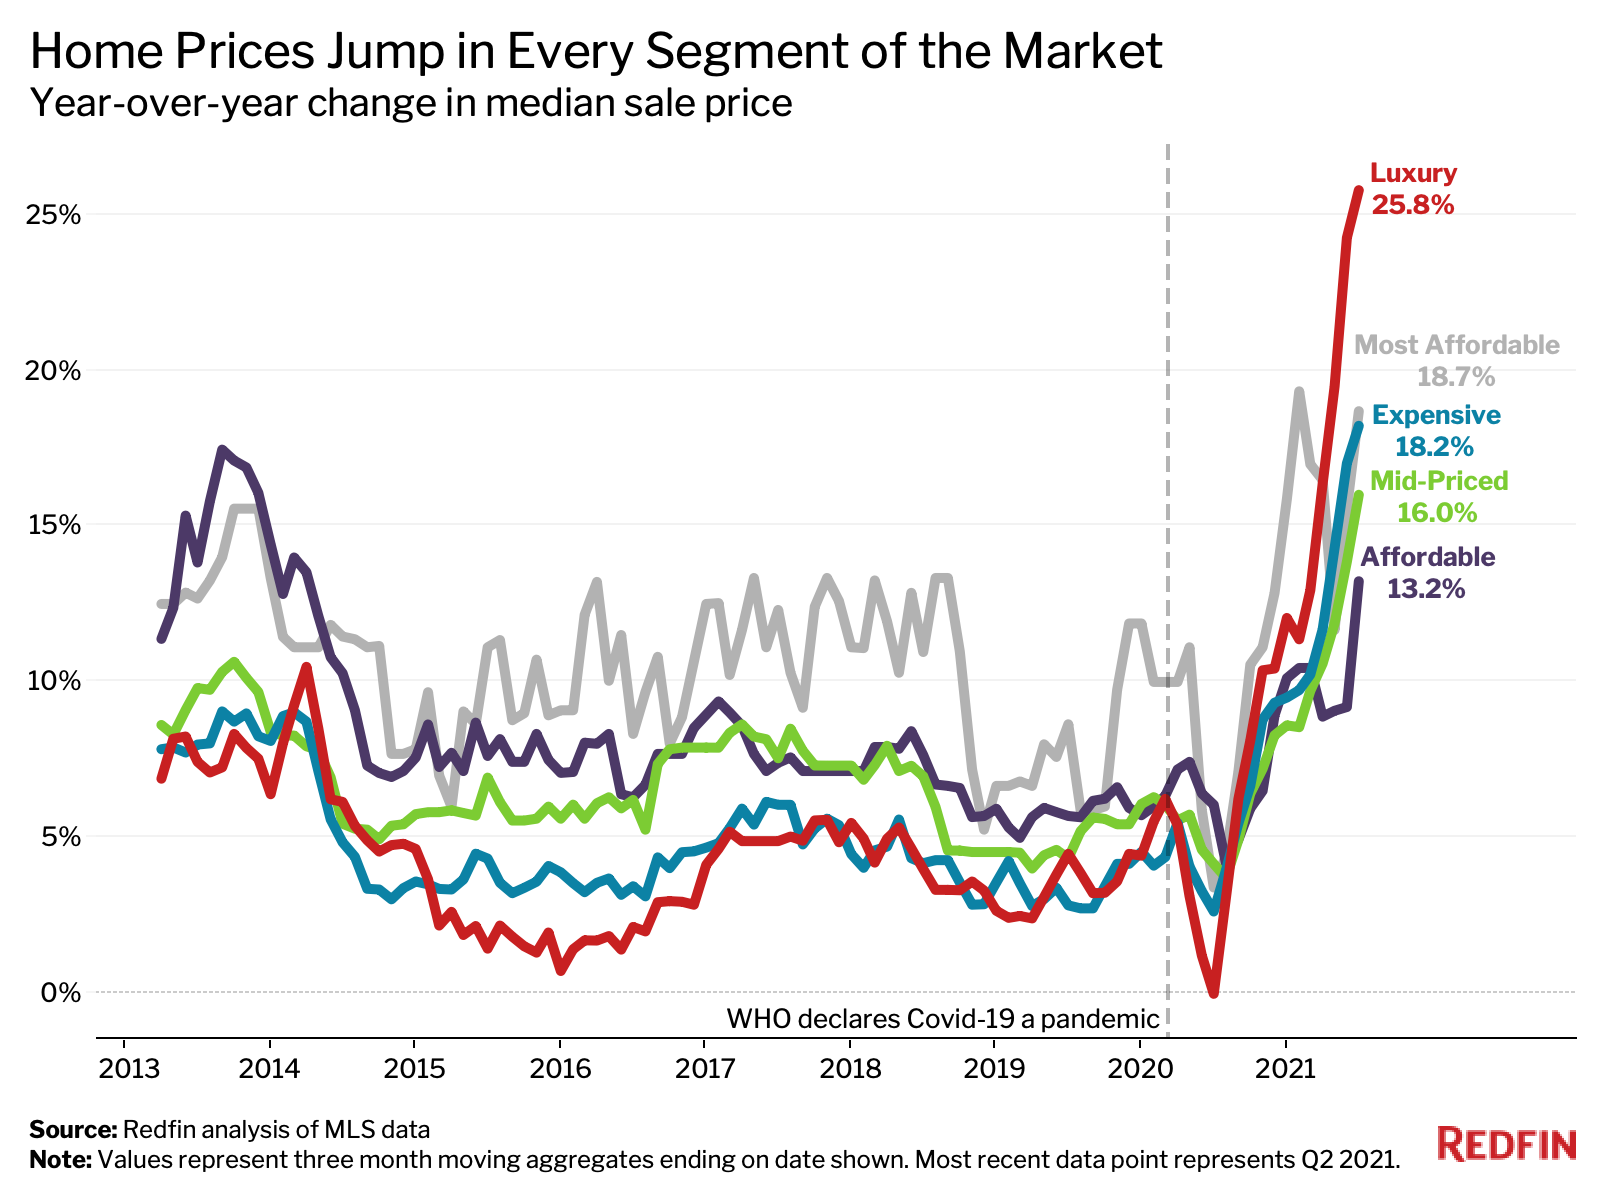
That’s according to an analysis that divided all U.S. residential properties into five price tiers—luxury, expensive, mid-priced, affordable and most affordable—based on Redfin Estimates of the homes’ market values. When we refer to a “record” in this report, the record dates back to the year 2013. It’s important to note that year-over-year gains may appear especially large due to the housing-market slowdown in the second quarter of 2020, when activity stalled due to pandemic restrictions.
“Home prices and sales plummeted at the beginning of the pandemic, but have now more than recovered—especially in the luxury and most affordable price tiers—due to low mortgage rates and strong homebuyer demand during the pandemic,” Redfin Chief Economist Daryl Fairweather said.
Fairweather continued: “Surging prices can be especially problematic for first-time and lower-income homebuyers, but the good news is that the supply of the country’s most affordable homes is growing. That means there could be more homes to choose from and less competition for buyers in that segment of the market.”
While luxury home prices have been on the rise, sellers in the high-end market have started to slash prices in recent weeks, according to Boise, ID Redfin real estate agent Kristin Lopez.
“I’m starting to see price drops for homes in the $600,000 to $800,000 range,” Lopez said. “Some sellers are pricing their properties too high because they think the market can sustain the red-hot dynamic we’ve seen over the past year. Homes below $400,000 are still selling like hotcakes, as locals compete with out-of-towners who have moved to Boise because they can now work remotely.”
Purchases of luxury homes in the U.S. surged 88.2% year over year in the second quarter, while purchases of the most affordable homes rose 56.8%. By comparison, purchases of homes in other price tiers increased between 30% and 45%.
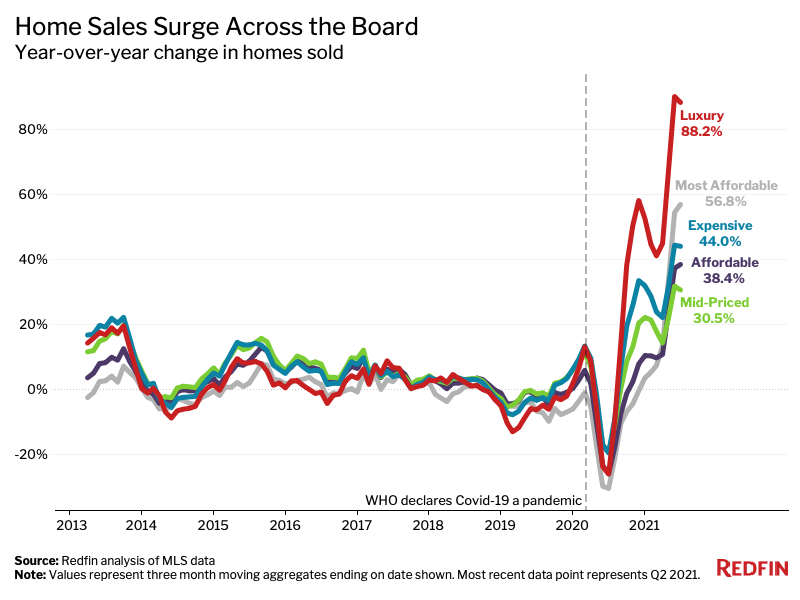
Home sales have soared across the board during the pandemic as Americans have taken advantage of low mortgage rates and the flexibility to work from anywhere. But sales in the luxury and most affordable price tiers have seen especially large increases. For luxury homes, that’s partly because affluent Americans have reaped the gains of a strong stock market and swelling savings accounts. For the most affordable homes, it’s likely due in part to a rebound in investor activity. Home purchases by real estate investors—who commonly buy lower-priced properties—jumped to a record high in the second quarter.
“With the pandemic eviction moratorium coming to an end and many Americans priced out of homeownership, investors are keen on buying up inexpensive properties and turning them into rentals,” Fairweather said. “A relative abundance of homes hitting the market in both the most affordable and luxury tiers has also enabled purchases in these segments to flourish.”
The number of homes for sale in the most affordable price tier rose 11.3% year over year during the second quarter. The next-biggest increase was in the luxury tier, which saw supply grow 1.3%. Supply in the remaining three tiers either declined or grew less than 1%.
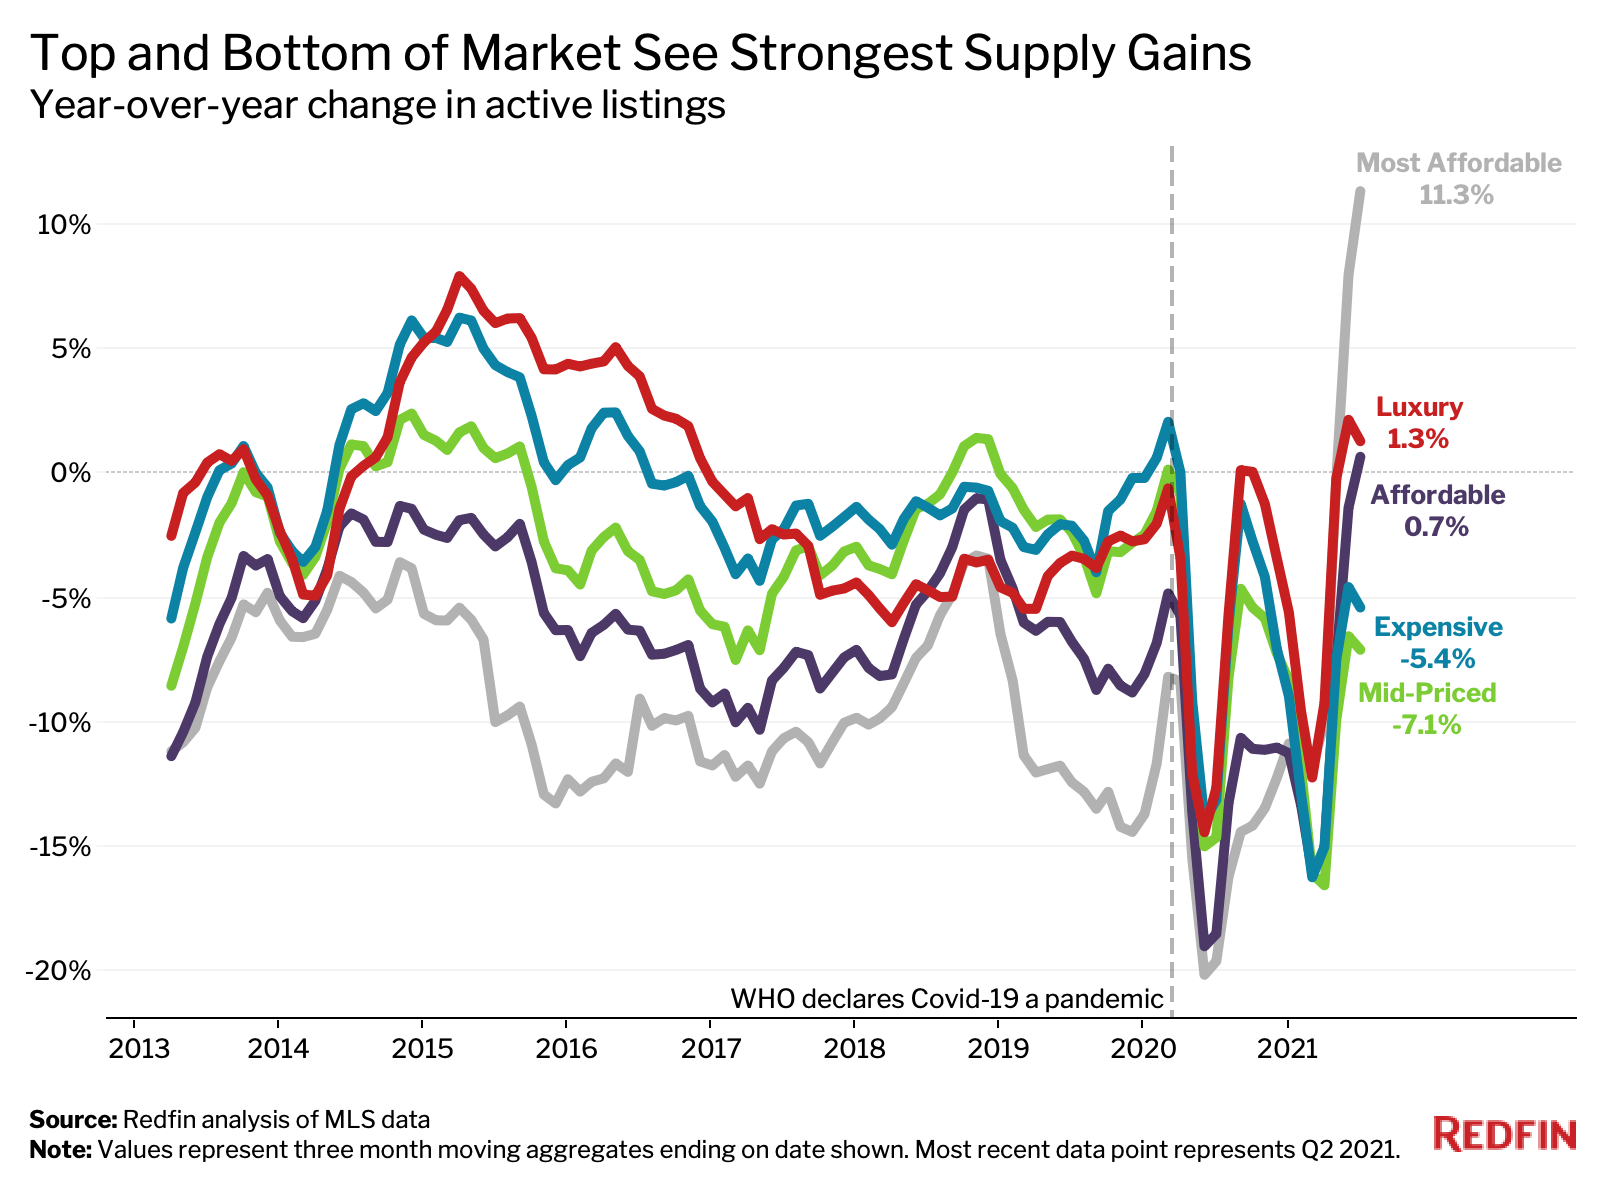
“The government’s pandemic mortgage forbearance program is coming to an end, which is likely boosting the supply of America’s most affordable homes,” Fairweather said. “Some homeowners are putting their properties on the market because they’re concerned about being foreclosed upon when forbearance dries up, while other owners of affordable homes are selling because they want to avoid the increase in seller competition that’s likely to occur when forbearance ends.”
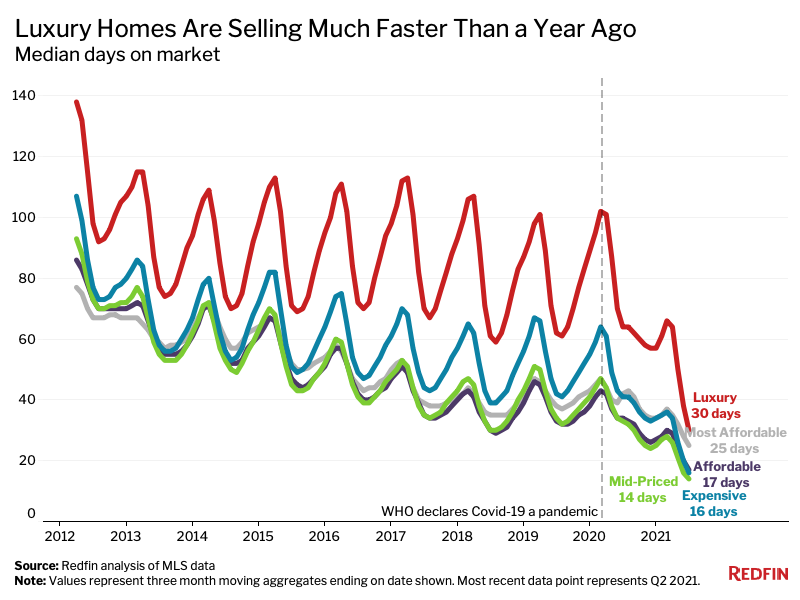
Historically, luxury homes have taken much longer to sell than homes in other price tiers, but the gap has narrowed during the pandemic—likely due to increased competition for high-end homes that offer space and privacy.
The typical luxury home that was for sale in the second quarter spent 30 days on the market—34 fewer days than the same period in 2020. The most affordable homes spent 25 days on the market, 17 fewer days than a year earlier. Homes in the remaining three price tiers spent about two weeks on the market and also sold faster than they did in 2020.
Below are the most interesting metro-level takeaways for the second quarter. We analyzed the 50 most populous U.S. metropolitan areas. Scroll down to see a full table including all five price tiers.
Prices
Sales
Supply
Speed
We divided all U.S. residential properties into five buckets. There are three equal-sized tiers, as well as tiers for the bottom 5% and top 5% of the market, based on Redfin Estimates of the homes’ market values as of July 22, 2021. The top 5% of the market by price is considered “luxury” for the purposes of this report, while the bottom 5% is titled “most affordable.” The “affordable” tier is homes estimated to be in the 5th-35th percentile. The “mid-priced” tier represents homes estimated to be in the 35th-65th percentile. The “expensive” tier represents homes estimated to be in the 65th-95th percentile. By using Redfin Estimates of homes’ market value, we are able to use the same group of homes to report on price, sales and inventory.
