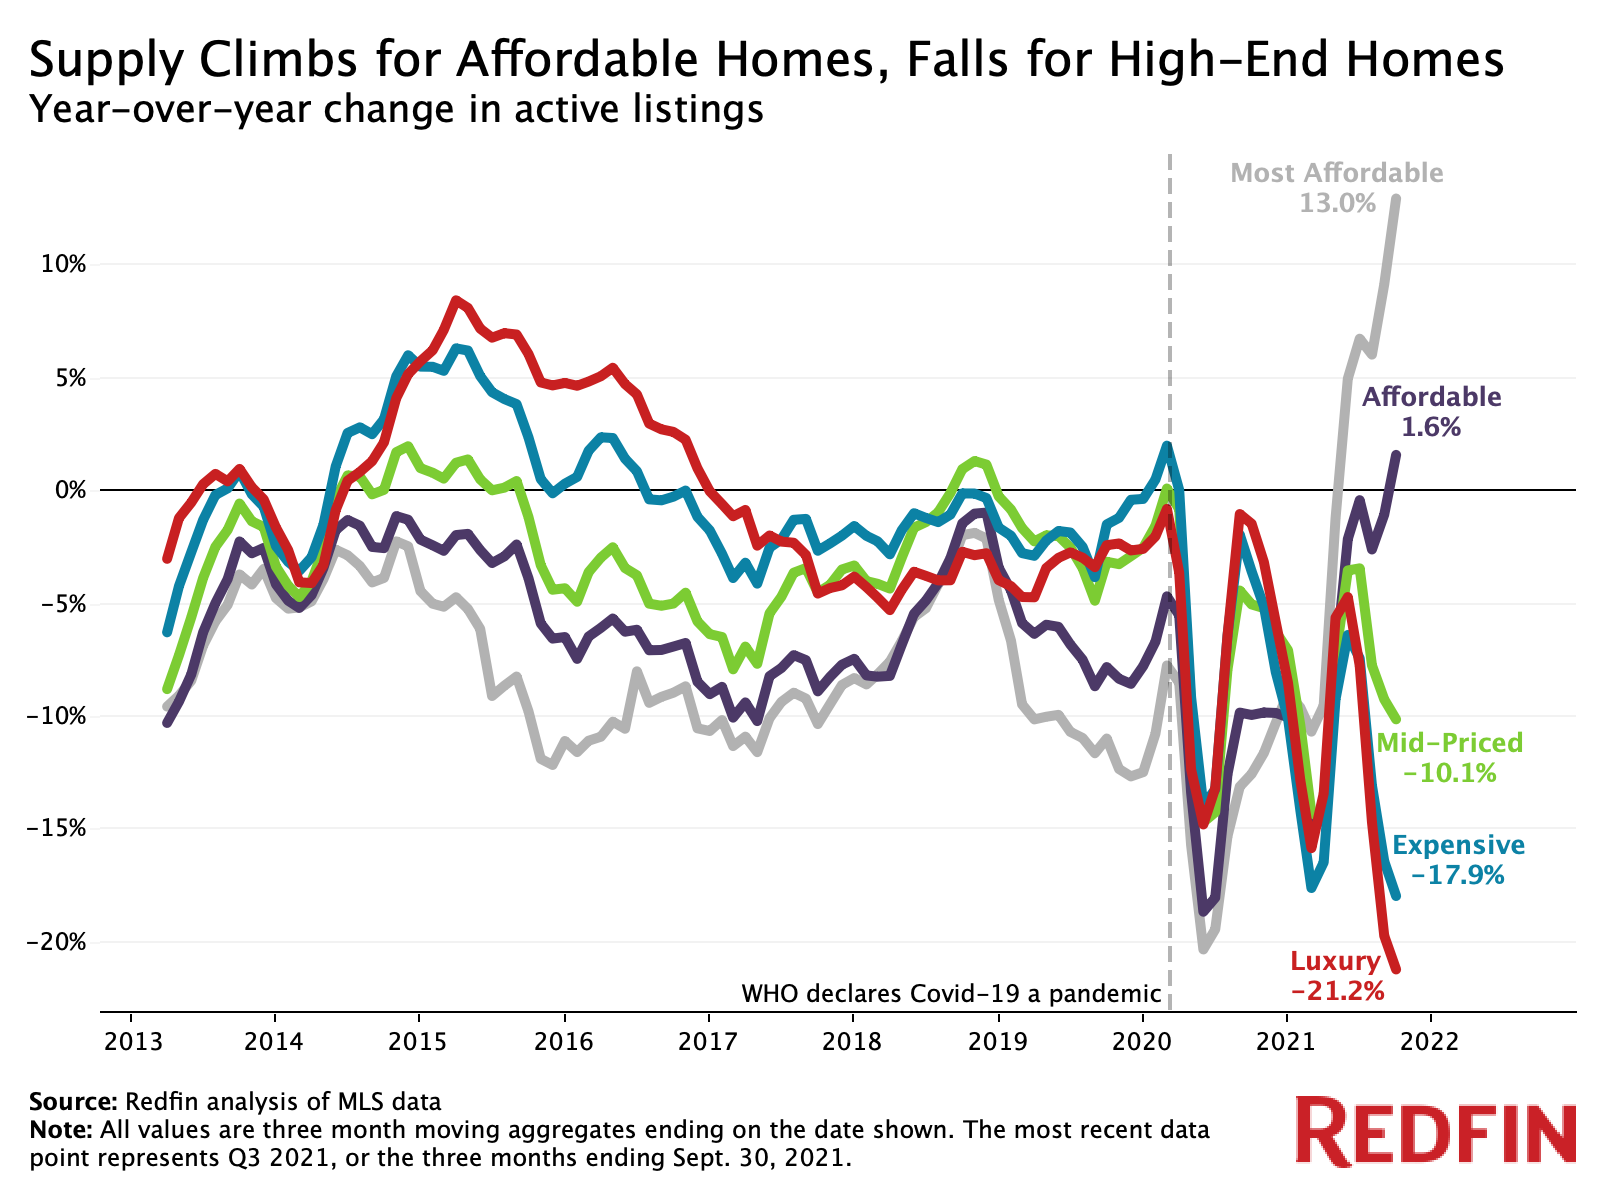
The supply of America’s most affordable homes for sale jumped a record 13% year over year in the third quarter as mortgage forbearance programs came to an end, prompting many owners of low-cost homes to put their properties on the market.
That’s according to an analysis that divided all U.S. residential properties into five price tiers—most affordable, affordable, mid-priced, expensive and luxury—based on Redfin Estimates of the homes’ market values. When we refer to a “record” in this report, the record dates back to the year 2013. The data in this analysis covers rolling three month periods, the most recent of which is the three months ending Sept. 30, 2021 (AKA the third quarter).

The supply of homes for sale in the affordable price tier also grew at a record pace, rising 1.6% year over year in the third quarter. Meanwhile, housing supply in the other three segments tumbled, with the number of luxury and expensive homes on the market dropping a record 21.2% and a record 17.9%, respectively.
The Biden Administration last year passed the CARES Act, an economic stimulus bill aimed at helping Americans financially burdened by the coronavirus pandemic. It allowed millions of homeowners to enter forbearance, or temporarily pause or reduce mortgage payments. This contributed to a decline in listings of low-cost homes last year. But many forbearance plans have an 18-month limit, meaning that in recent months, scores of homeowners have had to restart payments or sell their homes.
“The end of forbearance has forced many lower-income Americans to put their homes up for sale and become renters,” said Redfin Chief Economist Daryl Fairweather. “This has caused the number of affordable homes on the market to surge, helping replenish inventory amid an acute housing shortage. It’s a rain storm after a long drought, but the drought isn’t over yet.”
Housing supply in both the most affordable and affordable price tiers remains below historic levels despite the recent record increase. There were 78,000 active listings in the most affordable tier during the third quarter, compared with more than 100,000 during each of the same periods from 2013 through 2016. In the luxury price tier, there were 158,000 active listings in the third quarter, the fourth-lowest level on record.
“The luxury market remains strong, but is past its pandemic peak,” Fairweather said. “Now that life is somewhat back to normal and travel restrictions have been lifted, many affluent Americans are opting to spend their money on things other than housing.”
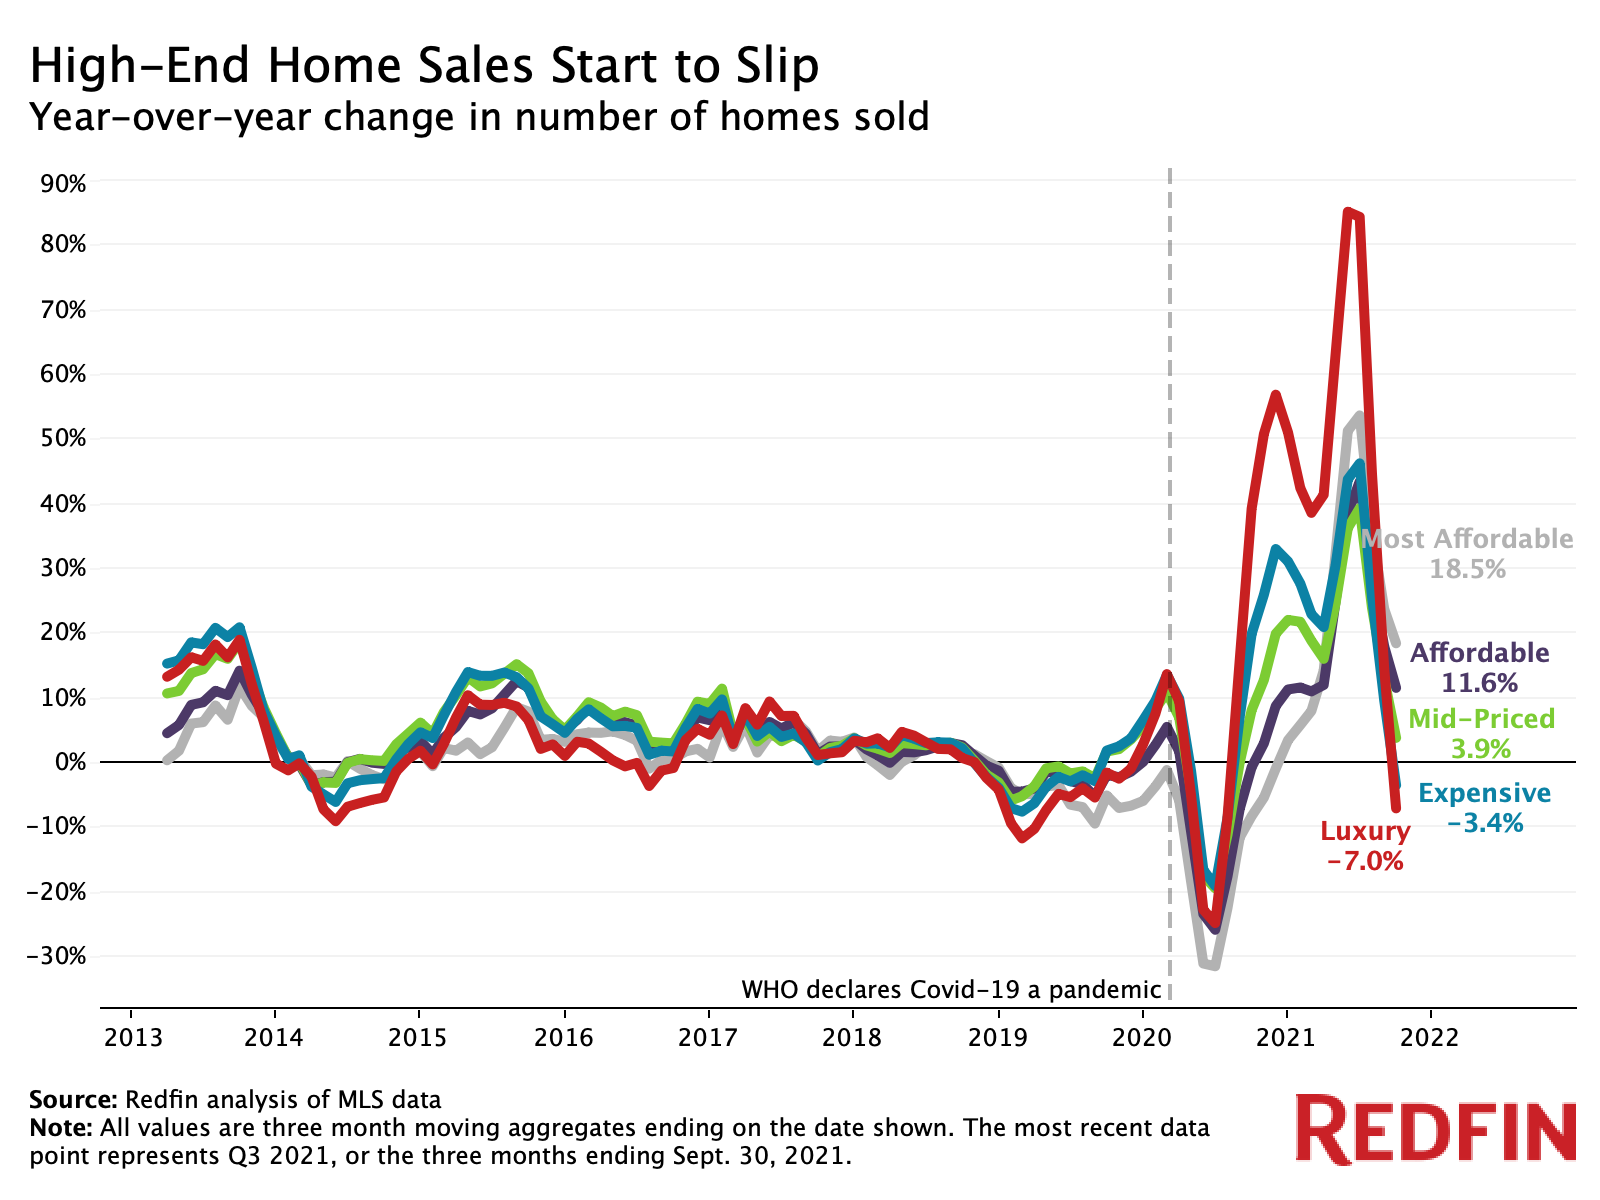
Purchases of luxury homes fell 7% year over year in the third quarter and purchases of expensive homes slid 3.4%—the first declines since the three months ending July 31, 2020. The remaining three price tiers posted growth, albeit slower growth than earlier in 2021, as the overall housing market cooled from its pandemic peak.

The lack of high-end housing inventory is one factor restricting sales in that segment of the market. Luxury-home purchases are also likely returning to more normal levels following an outsized surge in the third quarter of 2020 that was fueled by wealthy remote workers looking to escape major cities, Fairweather added.
While the ongoing housing shortage is limiting home sales, strong price growth and market speed indicate that buyer demand remains strong across the board.
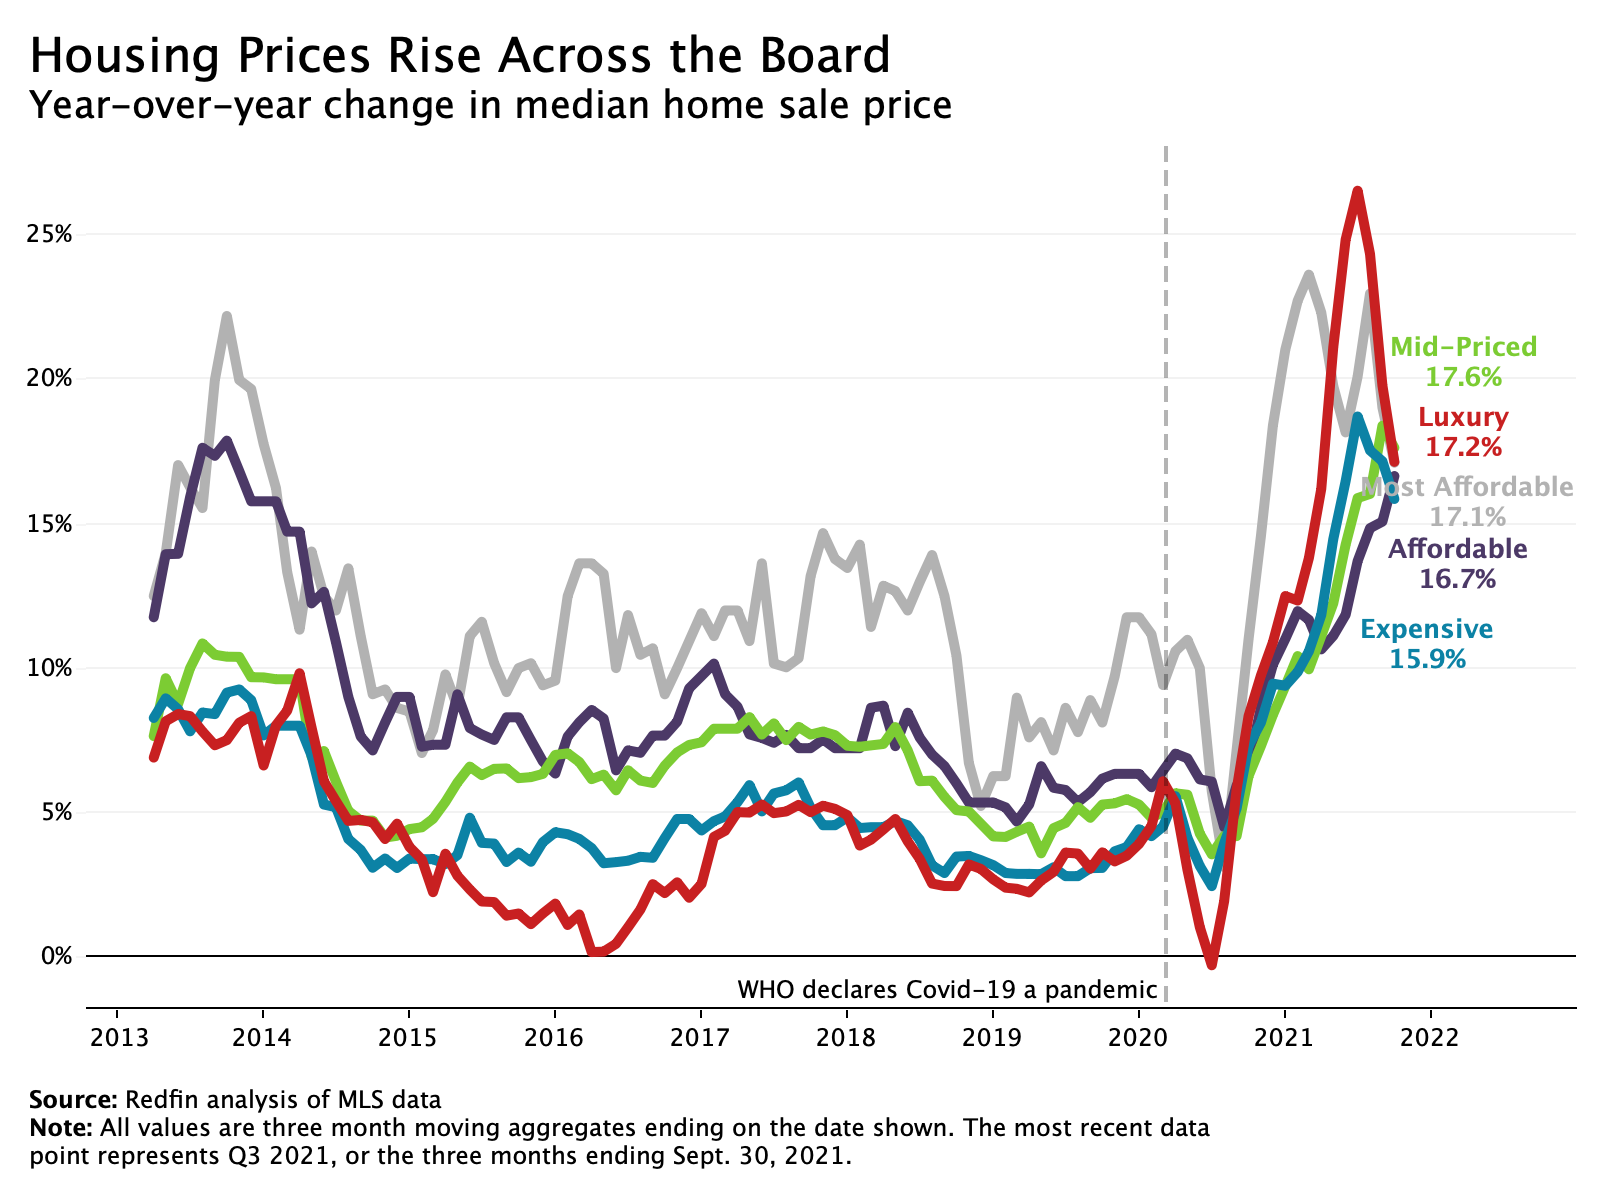
Median sale prices climbed at least 15% year over year in every price tier during the third quarter, with the mid-priced segment seeing record growth and the affordable segment seeing near-record growth.

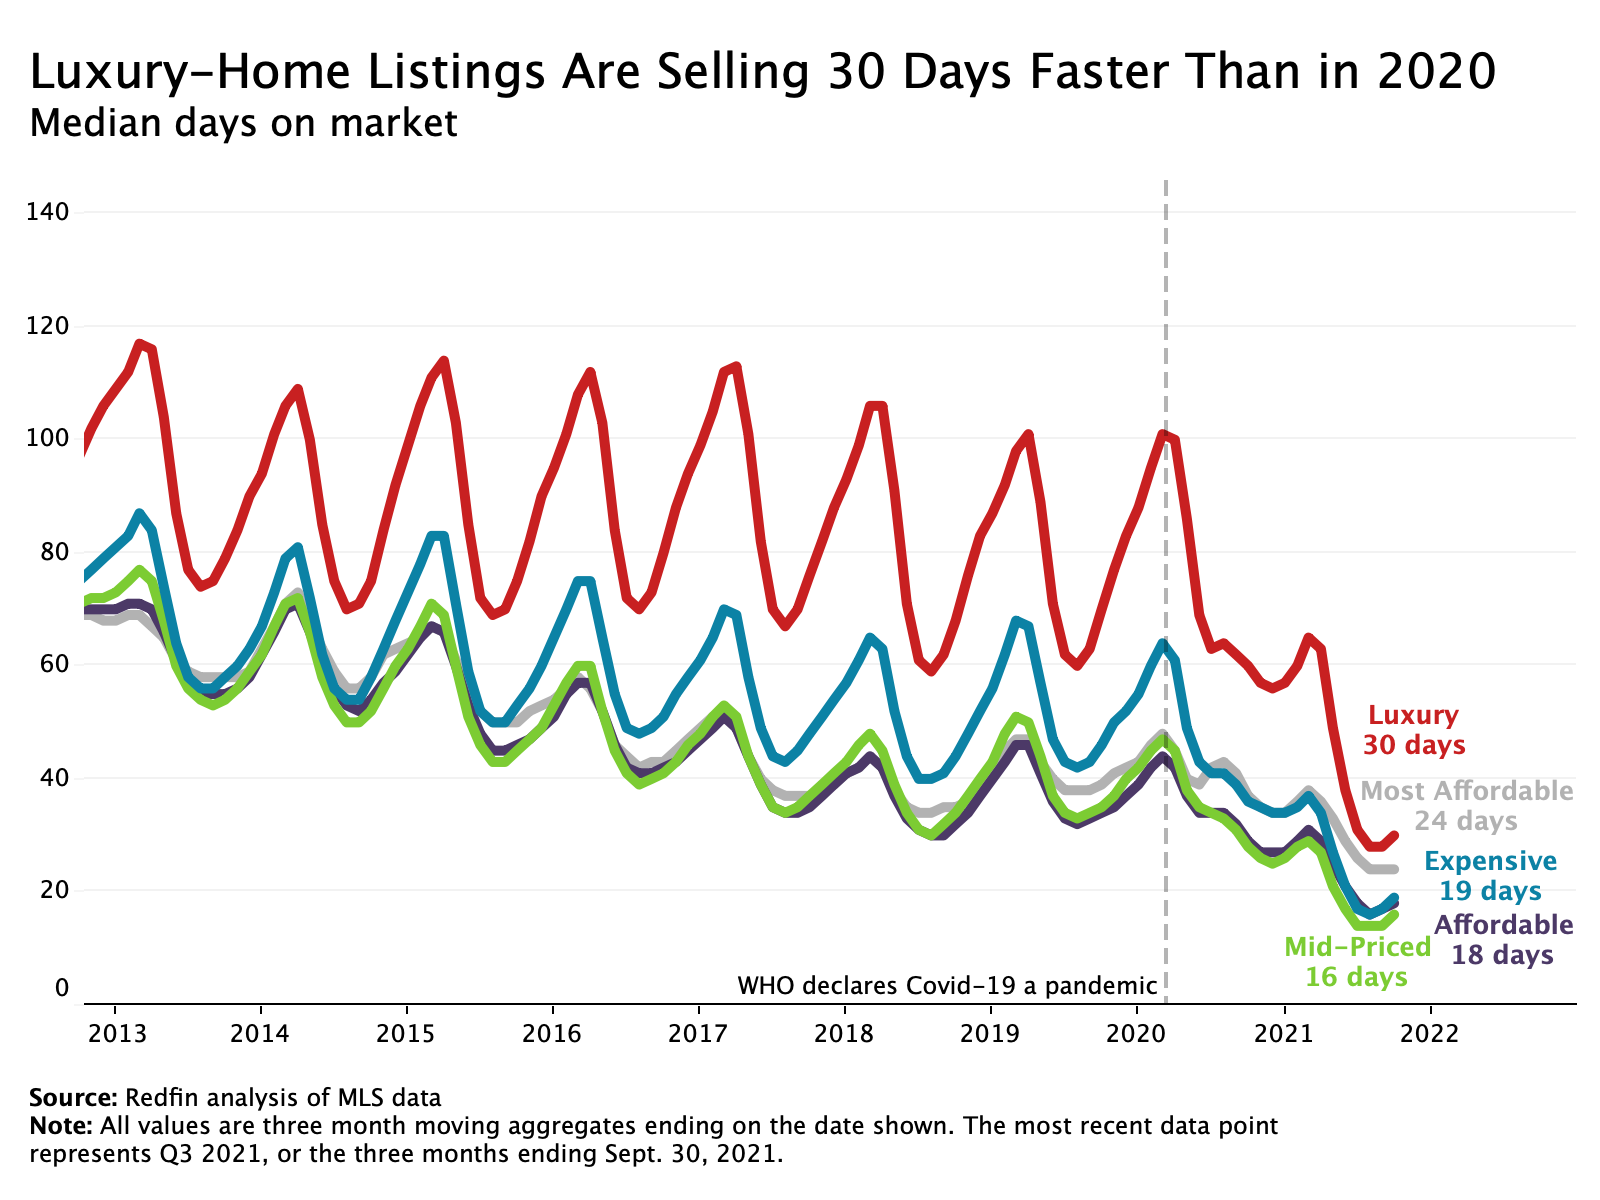
Homes also continued to sell at a much faster pace than last year in the third quarter. The typical luxury home for sale spent 30 days on the market—30 fewer days than the same period a year earlier. The other four price tiers also saw year-over-year increases in market speed.
A recent Redfin report found that one-third of all homes that sold during the four weeks ending Oct. 24 went under contract within seven days of hitting the market, indicating that the market has continued to speed up in the fourth quarter at a time of year when it typically slows down.
We divided all U.S. residential properties into five buckets. There are three equal-sized tiers, as well as tiers for the bottom 5% and top 5% of the market, based on Redfin Estimates of the homes’ market values as of Oct. 25, 2021. The top 5% of the market by price is considered “luxury” for the purposes of this report, while the bottom 5% is titled “most affordable.” The “affordable” tier is homes estimated to be in the 5th-35th percentile. The “mid-priced” tier represents homes estimated to be in the 35th-65th percentile. The “expensive” tier represents homes estimated to be in the 65th-95th percentile. By using Redfin Estimates of homes’ market value, we are able to use the same group of homes to report on price, sales and inventory.


