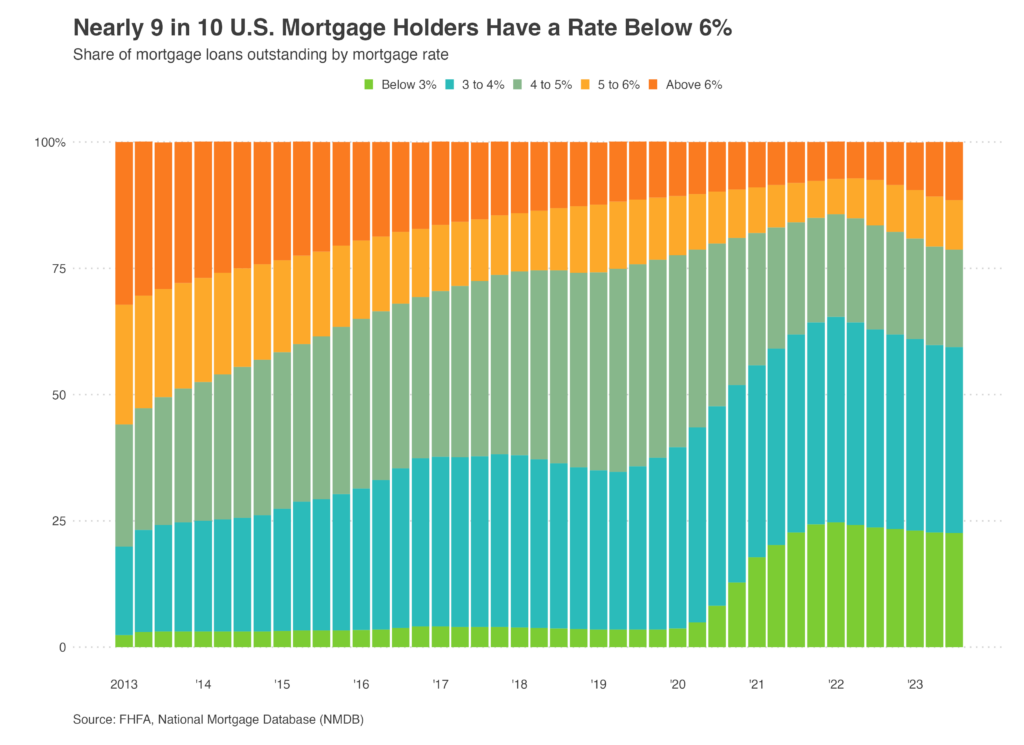
Most homeowners with mortgages have a rate below today’s average, prompting many to stay put. But the share of homeowners with relatively low rates has fallen from its record high because some have given up on waiting to move until rates nosedive, and everyone who has purchased a home in the last year has done so when rates were above 6%.
Nationwide, 88.5% of U.S. homeowners with mortgages have an interest rate below 6%, down from a record high of 92.8% in mid-2022.
That means more than 88.5% of homeowners with mortgages have a rate below the current weekly average of 6.66%, prompting many to stay put instead of selling and buying another home at a higher rate—a phenomenon called the “lock-in effect.”
But for most people, it’s not realistic to stay put forever. The share of homeowners with a rate below 6% has fallen from its record high partly because some homeowners are opting to bite the bullet and give up their low rate in order to move. Many are selling because a major life event like a divorce has given them no other choice, while others are putting their homes on the market because they want to live in a different house or city.
Another reason the share has dipped: Everyone who purchased a home in the last year—repeat buyers and first-time buyers alike—was entering the market at a time when the average mortgage rate was above 6%.

This is according to a Redfin analysis of data from the Federal Housing Finance Agency’s National Mortgage Database as of the third quarter of 2023, the most recent period for which data is available. The share of homeowners with rates below 6% likely fell further in the fourth quarter because a dip in mortgage rates drove more people to buy and sell homes, even as rates remained above 6%.
“I’m working with a lot of homeowners who are selling because of things like divorces, new jobs or deaths in the family,” said David Palmer, a Redfin Premier real estate agent in Seattle.
“I’m also working with homeowners who are bursting at the seams and selling because they’ve outgrown their current home.”
It’s worth noting that for some homeowners, the fact that home prices soared during the pandemic means they have enough equity to justify selling and taking on a higher rate—especially if they’re downsizing or moving somewhere more affordable.
Americans continue to face a shortage of homes for sale, and a primary reason is the lock-in effect.
But home listings have been ticking up year over year, in part because some homeowners simply have to move, as discussed above. Listings are also rising because mortgage rates have fallen enough in recent weeks to convince some homeowners to let go of their low rate. Today’s 6.66% average mortgage rate is down from a peak of roughly 8% in October.
“Sellers have started coming out of the woodwork because that’s typical for January and because mortgage rates have dropped,” Palmer said. “They’re also coming to terms with the fact that rates aren’t going back down to 3% any time soon, which makes it easier to pull the trigger on selling. But a lot of sellers are worried about finding their next house because even though listings are rising, there’s still a housing shortage. That’s part of the reason so many sellers remain on the sidelines.”
Here’s the full breakdown of where today’s homeowners fall on the mortgage-rate spectrum:
The typical homebuyer purchasing today’s median-priced U.S. home at the average mortgage rate takes on a monthly payment of $2,399. While that’s down more than $300 from the all-time high in 2022, it’s still up 7.4% from a year ago. That’s because both mortgage rates and home prices are higher than they were at this time last year.
Nearly all homeowners with a mortgage have a rate below the one they would get if they bought a home today, but the difference in monthly payments varies depending on each individual situation. A mortgage holder in the 3% to 4% range is more likely to feel handcuffed to their home than someone in the 5% to 6% range, for instance.
This report is based on a Redfin analysis of third quarter 2023 data from the FHFA’s National Mortgage Database, which is a nationally representative 5% sample of all first-lien, closed-end purchased or refinanced residential mortgages in the U.S. The third quarter is the most recent period for which data on outstanding mortgages is available. We assume each loan represents a homeowner with a mortgage, though some homeowners may have multiple loans.
While the prevailing mortgage rate for homebuyers often changes quickly, rates for existing homeowners don’t typically change significantly from quarter to quarter, as most buyers take out 30-year mortgages. Roughly 60% of U.S. homeowners have an outstanding mortgage.

