

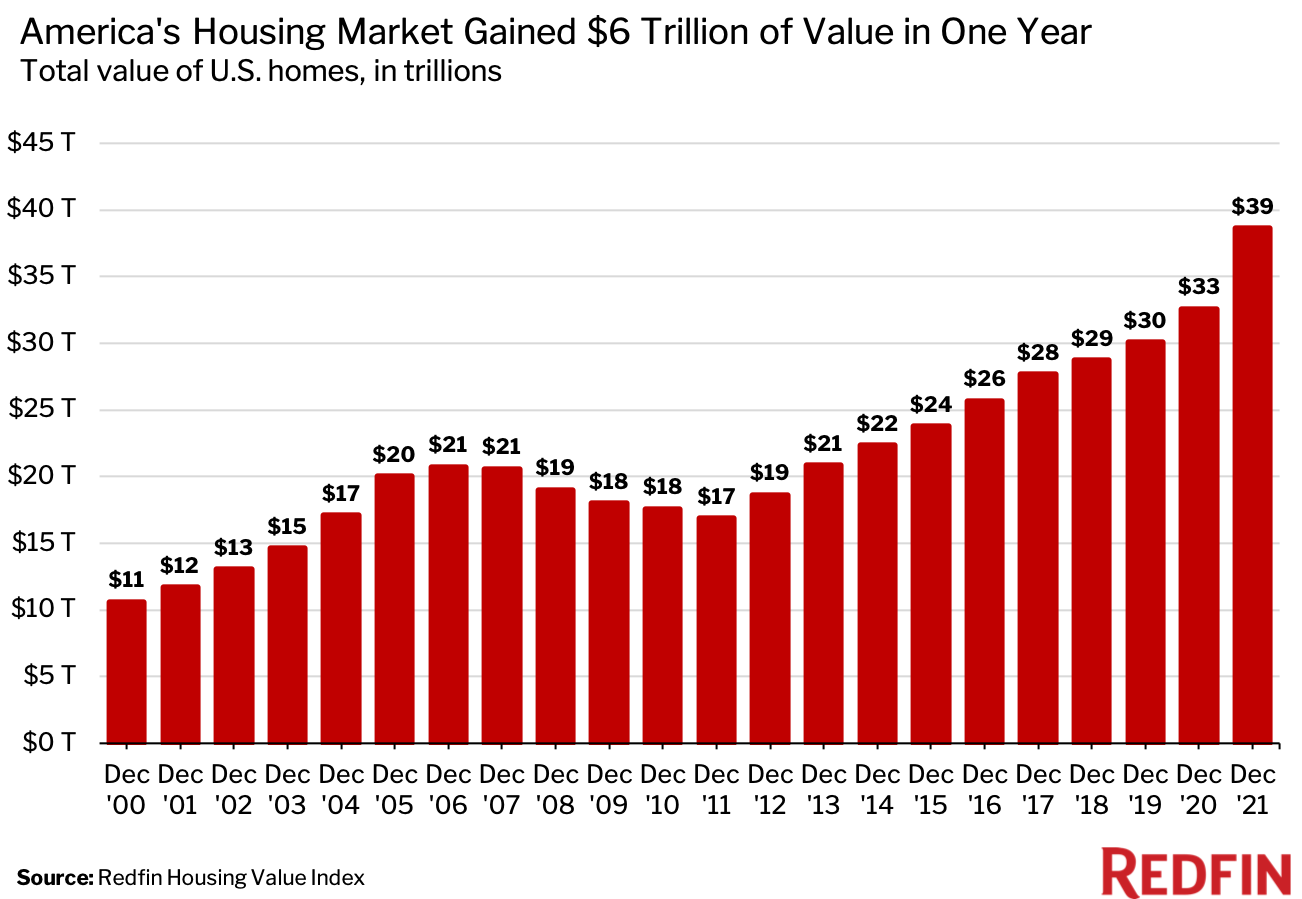
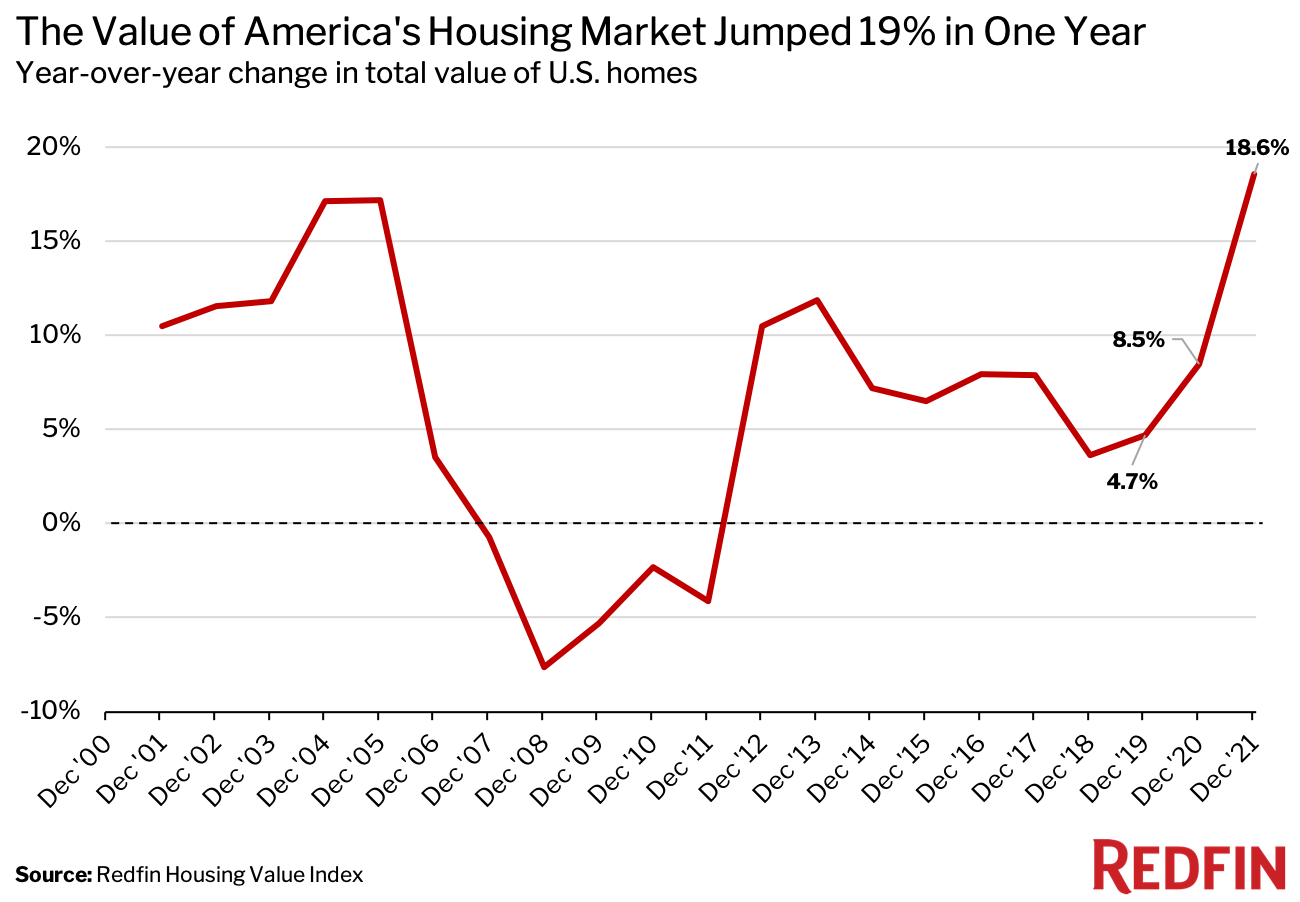
The total value of U.S. homes surged 18.6% ($6 trillion) over the past year—to a record $38.6 trillion in December 2021 from $32.6 trillion in December 2020—as housing prices continued to climb amid a severe shortage of homes for sale. In both dollar and percentage terms, that’s the largest annual gain seen during any December since at least 2001.
In Austin, TX, the total value of homes skyrocketed twice as fast, jumping 39.2% year over year—a bigger gain than any other metro Redfin analyzed.
This analysis uses the Redfin Housing Value Index—a model that incorporates the Redfin Estimate, public records and MLS data to estimate the current and historical value of more than 85 million single-family homes, condos, townhouses and multifamily properties in the U.S. The figures in this report represent December 2021, unless otherwise noted. The Redfin Housing Value Index goes back to the year 2000, meaning the year-over-year growth figures in this report go back to 2001.
This report estimates the total value of U.S. homes, not home prices or homeowner equity—though rising home prices have contributed to the increase in total home value.
Home prices have skyrocketed during the pandemic as low mortgage rates, remote work and a soaring stock market have fueled a swell in homebuyer demand amid an ongoing housing shortage. December marked the 17th-straight month of double-digit price gains, while the number of homes for sale sunk to a record low.
“The surge in housing values during the pandemic has widened the gap between homeowners and renters in America. Homeowners have seen their wealth increase significantly over the past year, while renters have missed out on those gains and are now grappling with rent inflation,” said Redfin Chief Economist Daryl Fairweather. “The silver lining is that housing values didn’t just climb in large affluent cities. Homeowners in rural America, who don’t normally see substantial home-value increases, also reaped the benefits of a booming housing market.”
The total value of homes in Austin surged 39.2% year over year to $365.9 billion in December—the largest gain among the 100 most populous U.S. metropolitan areas. The $103 billion increase in the Texas capitol is roughly equal to the 2020 GDP of Ecuador. Next came Cape Coral, FL (36.9%), Grand Rapids, MI (33.1%), Phoenix (32.8%) and Boise, ID (32.8%). Rounding out the top 10 were North Port-Sarasota, FL (31.9%), Raleigh, NC (29.4%), Las Vegas (29.1%), Salt Lake City (28.4%) and Tampa, FL (28.3%).
Homebuyers have flocked to Sun Belt states during the pandemic as remote work has allowed them to prioritize affordability over proximity to the office. Phoenix, Las Vegas, Tampa, Cape Coral and North Port have consistently been among the hottest spots for homebuyers looking to relocate during the pandemic. In the fourth quarter, all five made Redfin’s top 10 list of migration destinations, which is based on net inflow—a measure of how many more Redfin.com home searchers looked to move into a metro than leave. Austin has been knocked out of the top 10 in recent months as many house hunters have found themselves priced out.
Out-of-towners moving to Austin tend to pay more for homes than locals, which has boosted housing prices in the metro overall as people from more expensive cities like San Francisco and New York have moved in. A July Redfin report found that the typical home purchased by out-of-towners in Austin sells for $470,000, versus $447,500 for locals.
With home prices surging across the Sun Belt, Fairweather predicts homebuyers will increasingly start moving to more affordable northern cities like Indianapolis, Columbus, OH and Harrisburg, PA.
St. Louis was the only metro in this analysis that saw a decline, with total home value falling 2.1% to $184.8 billion. The metros with the smallest increases were all in the East or Midwest: Albany, NY (7.3%), Chicago (7.5%), Washington, D.C. (8.8%), Pittsburgh (9%), Frederick, MD (9.1%), Philadelphia (9.4%), Milwaukee (9.7%), Baltimore (10.3%) and Rochester, NY (10.3%). Many of these metros have relatively little new construction, which could be contributing to the relatively small increases in total home value.
“St. Louis doesn’t typically see big jumps in home prices. That’s the way it has been historically, and that’s how it is now,” said local Redfin real estate agent Kevin Barnett. “We’ve seen more folks migrate here during the pandemic, but we’ve also seen out-migration. The city is also predominantly older homes that need work. In the past, that meant they wouldn’t sell very easily, though we’re starting to see them sell for higher prices.”
St. Louis also experienced record home-value growth in 2020, which may be another reason for the year-over-year decline at the end of 2021.
Scroll to the bottom of this report for a table that details home-value gains in each of the 100 most populous metro areas.
The total value of rural homes rose 19.5% year over year to a total of $4.2 trillion in December. By comparison, the value of suburban homes climbed 19.2% to $22.2 trillion and the value of urban homes increased 15% to 10.7 trillion.

While cities have been bouncing back from a coronavirus slowdown, rural and suburban areas remain more popular than they were before the pandemic as remote workers continue to seek extra space and relative affordability.
The total value of single-family homes climbed 19.6% year over year to $29.2 trillion in December. By comparison, the value of multi-family properties climbed 15.6% to $1.3 trillion, the value of condos rose 15.4% to $6.8 trillion and the value of townhouses increased 15.3% to $1.3 trillion.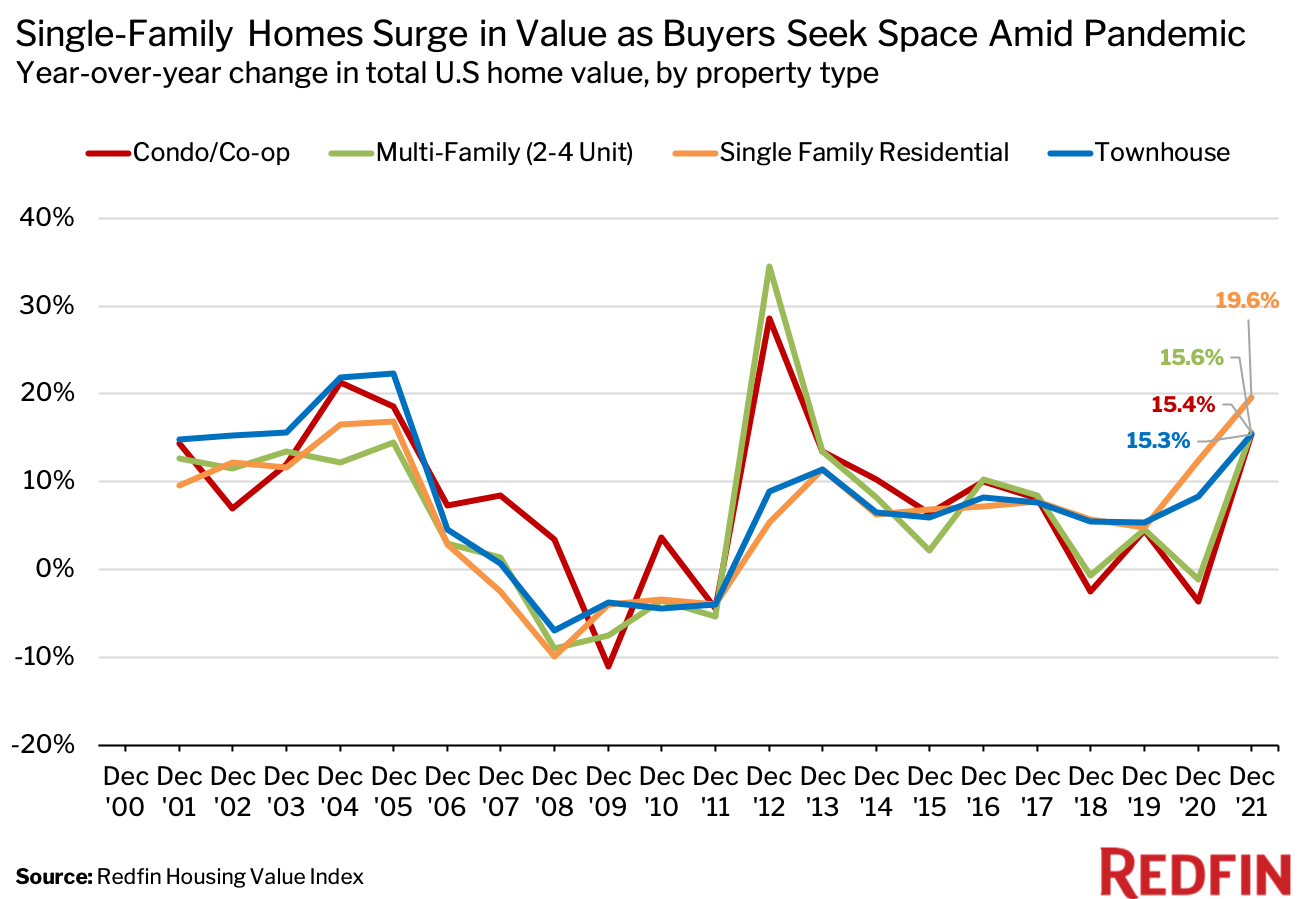
Single-family homes became a hot commodity during the pandemic, with scores of Americans exchanging cramped condos for bigger houses in the suburbs and rural areas. That said, condo demand has started to rebound as cities have bounced back and buyers have found themselves priced out of the single-family home market due to surging housing values.
The total value of homes owned by millennials grew 34.3% year over year to a total of $4.6 trillion in the third quarter of 2021—the most recent period for which data was available. By comparison, the value of homes owned by Generation X rose 20% to $11.9 trillion and the value of homes owned by baby boomers increased 11.9% to $15.9 trillion. Meanwhile, the value of homes owned by the Silent Generation fell 1.7% to $4.4 trillion, as many older Americans downsized or moved into retirement homes.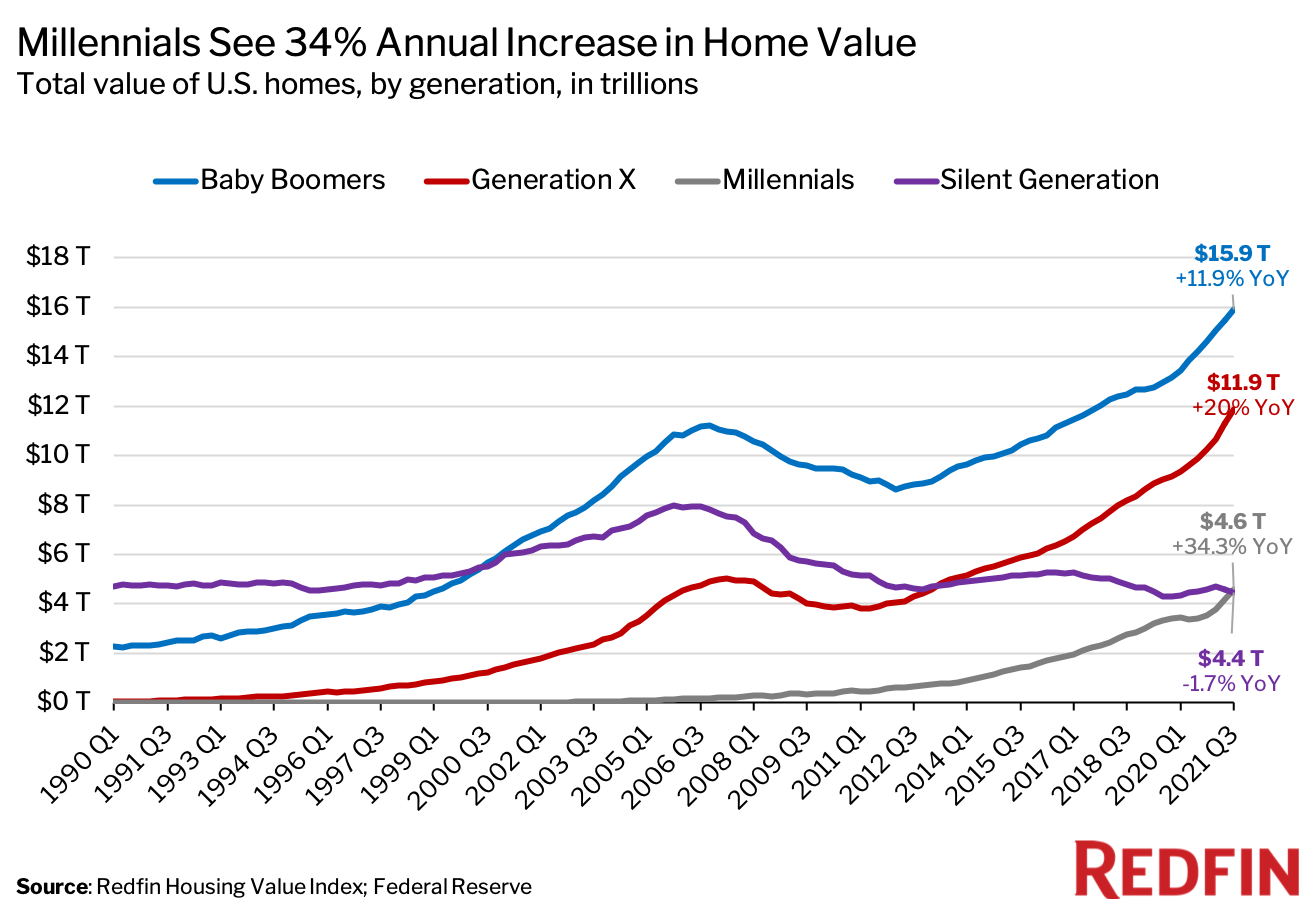
Millennials have taken up an increasing share of the U.S. housing market as they’ve grown into homeowning age, accounting for more than half of mortgage applications last year. Many of them bought their first home in 2020—when housing values began to skyrocket—which meant they saw significant wealth gains during their first year of homeownership.
The total value of homes in neighborhoods that are majority Native Hawaiian and other Pacific Islander rose 25.9% year over year in December. By comparison, majority white neighborhoods saw a 17.9% increase and majority Black neighborhoods experienced a 17.1% gain. Meanwhile, Hispanic or Latino neighborhoods saw 19.1% growth and Asian neighborhoods experienced an 18.2% gain.
Most groups saw housing-market gains of around 18%. That’s different from previous years, in which there were larger gaps between groups.
“The pandemic has been somewhat of an equalizer when it comes to housing-market-value gains, at least on a percentage basis,” Fairweather said. “That’s a positive for some groups, including Asian homeowners, who last year reaped a large gain after seeing one of the smallest increases the year before. But it also poses challenges for renters in those groups, who may now be priced out of homeownership.”
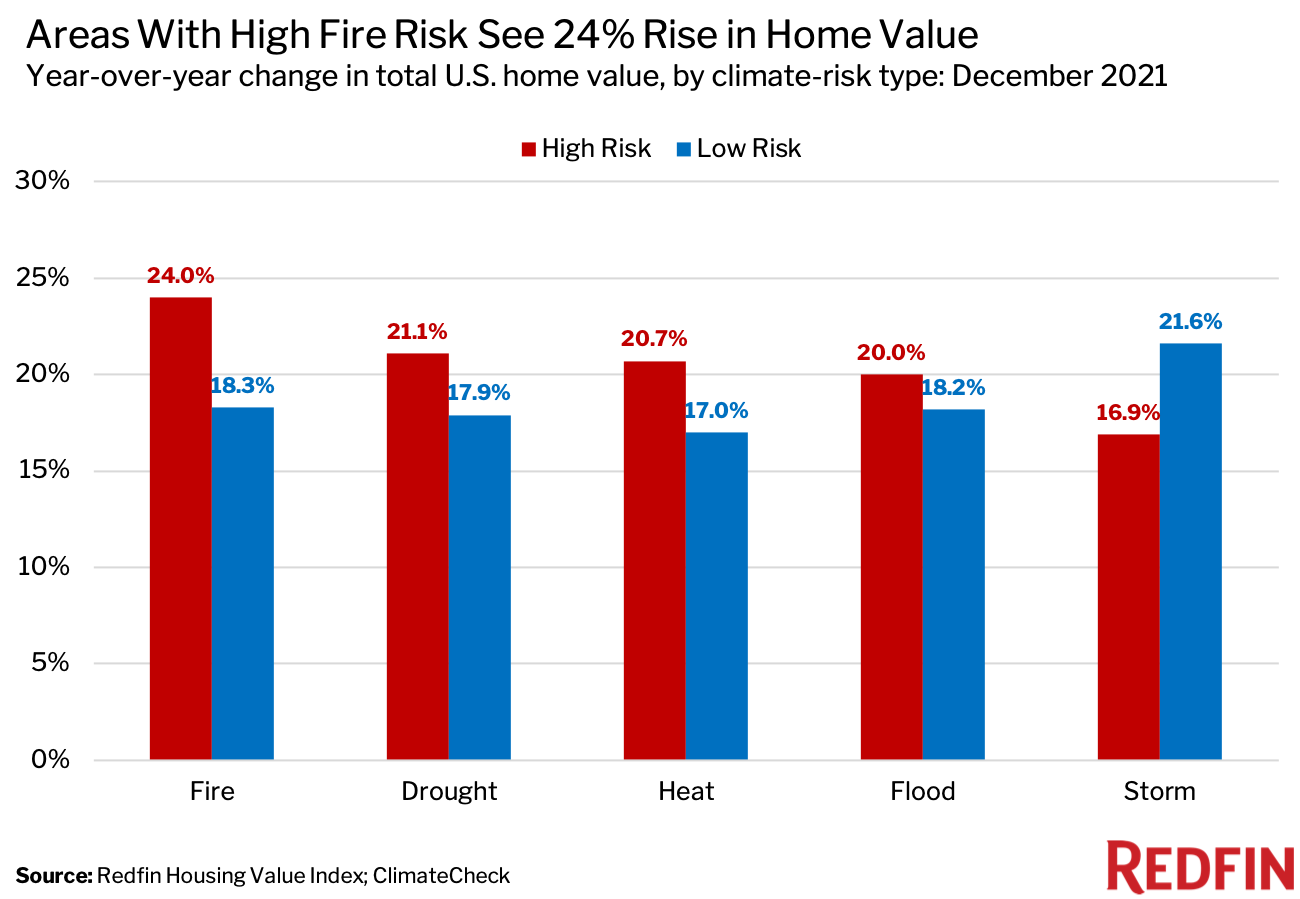
The total value of homes in areas with high fire risk rose 24% year over year in December. By comparison, the value of homes in areas with high drought, heat and flood risk climbed about 21%. Areas with high storm risk saw a 17% increase. For every category except storm, areas with high risk saw greater increases in value than areas with low risk.
While research has shown that most people consider climate change when buying or selling homes, there are often other factors—like affordability, proximity to family and/or access to the outdoors—that drive them to high-risk places anyway. Overall, more people are moving into than out of areas facing high risk from climate change, an August Redfin analysis found.
Many high-fire risk areas are also hot spots for second homes, which have been in high demand during the pandemic as affluent Americans have sought respite from city life. California’s Lake Tahoe, for example, has surged in popularity. Earlier this year, the Caldor Fire burned more than 200,000 acres in the area and became the 15th-largest fire in the state’s history. Other vacation and migration destinations, including Bend, OR and Boise, ID, have also seen scores of remote workers and second-home buyers move in who now face fire risk.
This analysis uses the Redfin Housing Value Index—a model that incorporates the Redfin Estimate, public records and MLS data to estimate the current and historical value of more than 85 million single-family homes, condos, townhouses and multifamily properties in the U.S. Current values (December 2021) were calculated using the Redfin Estimate, which is available in most but not all parts of the U.S. Historical values were imputed using public records and MLS data on price per square foot trends by zip code (or city, county, or state when zip-code data is insufficient). The Redfin Home Value Index includes both existing homes and new-construction homes, and dates back to the year 2000. Homes are not added to the index until they are first built or sold.
Homes are determined to be rural, suburban or urban based on categories for the census tract of the property from the U.S. Department of Housing and Urban Development (HUD). HUD has a model that describes neighborhood types based on responses to the 2017 American Housing Survey.
Home values by race or ethnicity are based on a classification of the home’s census tract. We classified a census tract as Black, Hispanic/Latino, Asian, American Indian and Alaskan Native, Native Hawaiian and Other Pacific Islander, white, or two or more races if more than 50% of owner-occupied households were owned by Black, Hispanic/Latino, Asian, American Indian and Alaskan Native, Native Hawaiian and Other Pacific Islander, white, or two or more races from 2015 through 2019, according to owner-occupied household race data from the five-year American Community Survey. A census tract was classified as mixed race if no race had a greater than 50% of the owner-occupied household share in the tract.
Home values by generation are based on the Distributional Financial Accounts data from the Federal Reserve.Home values by climate risk are aggregated according to the climate-risk category they fall under. Climate-risk data for drought, fire, flood, heat, and storm comes from ClimateCheck, which assigns six different climate-risk categories to properties across the U.S.—very low, low, moderate, high, very high and extreme. For this report, a “high-risk” property is one that falls into the high, very high, or extreme category—a score greater than 50. A “low-risk” property is one that falls into the very low, low or moderate category—a score of 50 or less. The climate-risk data in this report is as of March 31, 2021.
