This week marks the two-year anniversary of the coronavirus pandemic, which the World Health Organization officially declared a pandemic on March 11, 2020. Here’s a look at how drastically the housing market has changed since then. Unless otherwise noted, the data below represents the four weeks ending March 6, 2022, compared with roughly the same period two years earlier (the four weeks ending March 8, 2020).
The number of homes on the market is down 49.9% from two years ago to a record low of roughly 456,000. The records in this report date back to 2017 unless otherwise noted.
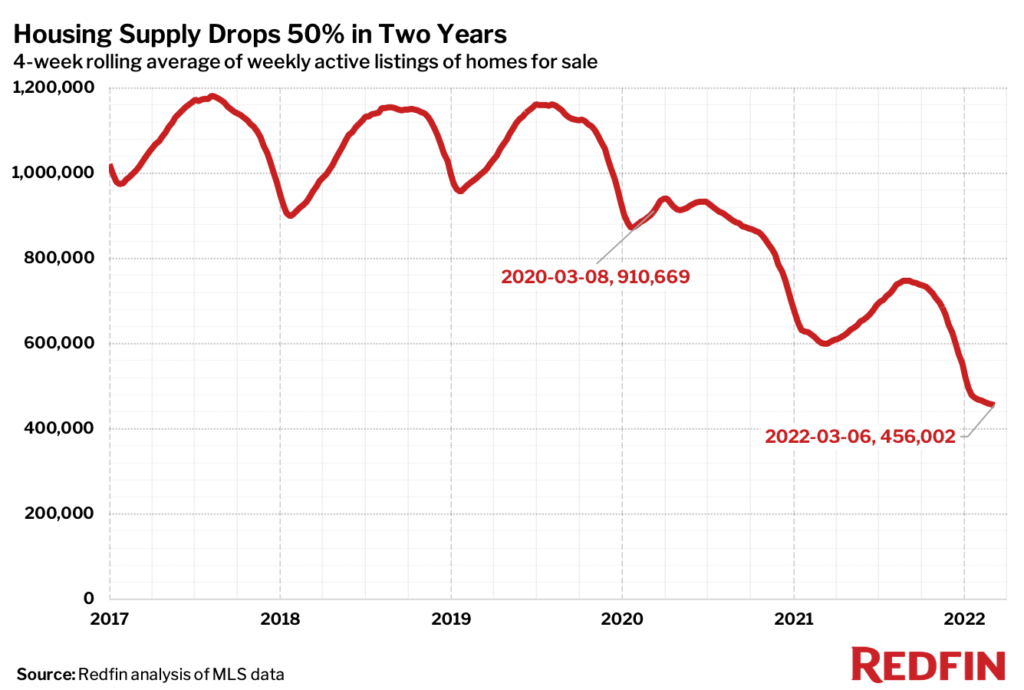
Remote work and record-low mortgage rates prompted scores of Americans to move during the pandemic, intensifying a housing shortage that began in the wake of the 2008 financial crisis. With so few homes available to purchase, house hunters have waged fierce bidding wars, causing prices to surge.
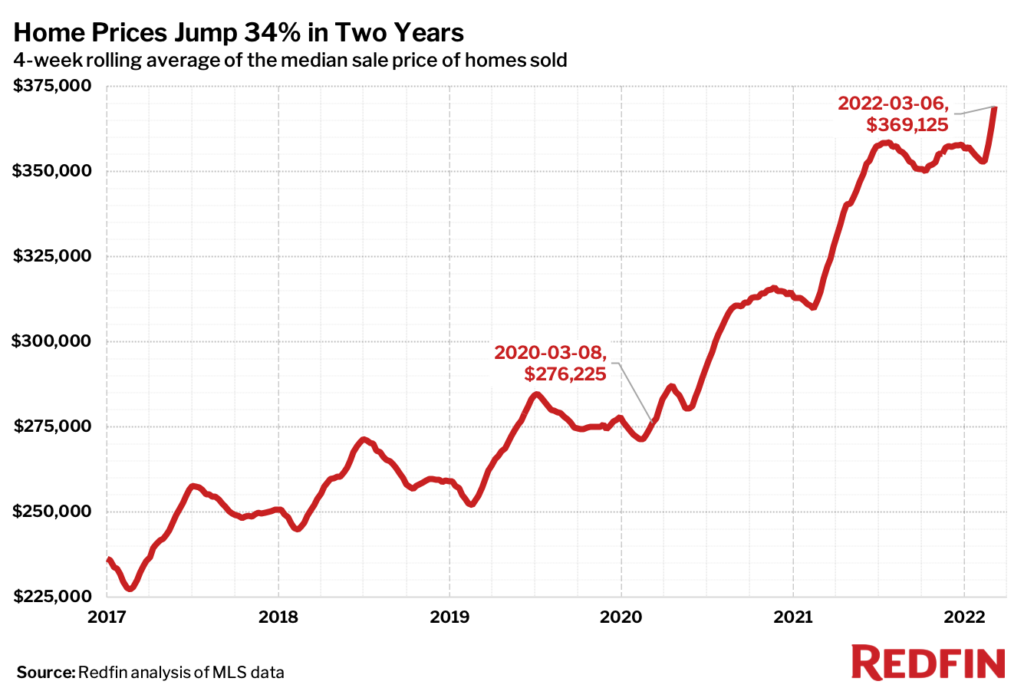
The median home sale price is $369,125, the highest on record and up 33.6% from $276,225 two years ago. That’s a significantly larger jump than the prior two-year period (2018 to 2020), during which home prices grew about 10%.
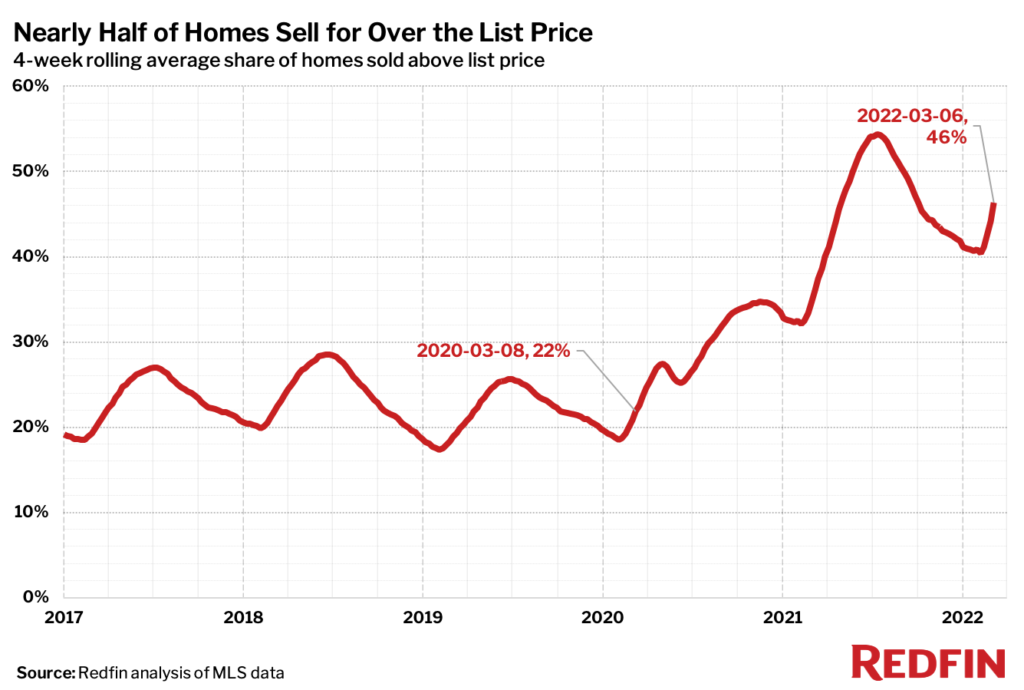
Homebuyers are now twice as likely to pay above the asking price as they strive to beat out the competition, which is one reason home prices have climbed so high. Nationwide, 46.3% of homes sell for more than the asking price, up from 21.8% two years ago. Some bidders are paying significant premiums to win. Nearly 6,000 homes have sold for $100,000 or more over asking price so far this year, up from 2,241 during the same period last year, a recent Redfin analysis found.
“One of my clients was recently outbid on a home after offering $80,000 over the $650,000 asking price. The house got 45 offers—10 of which were for $800,000 or more—and ultimately sold for $870,000,” said Dallas Redfin real estate agent Barbara Tidwell-Vincent. “The buyers winning today are offering as much as 20% above the list price, waiving contingencies, and picking up the cost of the title policy. Unfortunately, not all buyers can afford to pull out all of the stops, so some folks have been priced out of the housing market.”
The typical home sells in 25 days, down from 53 days two years ago.

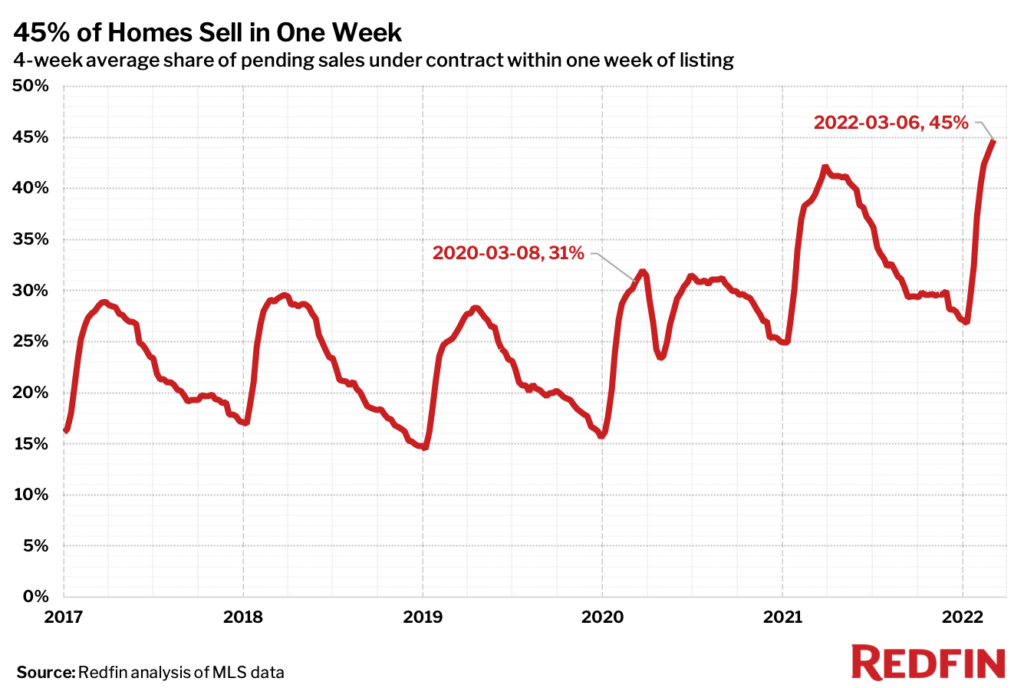
A record 44.7% of homes sell within just one week, compared with 30.8% two years ago.
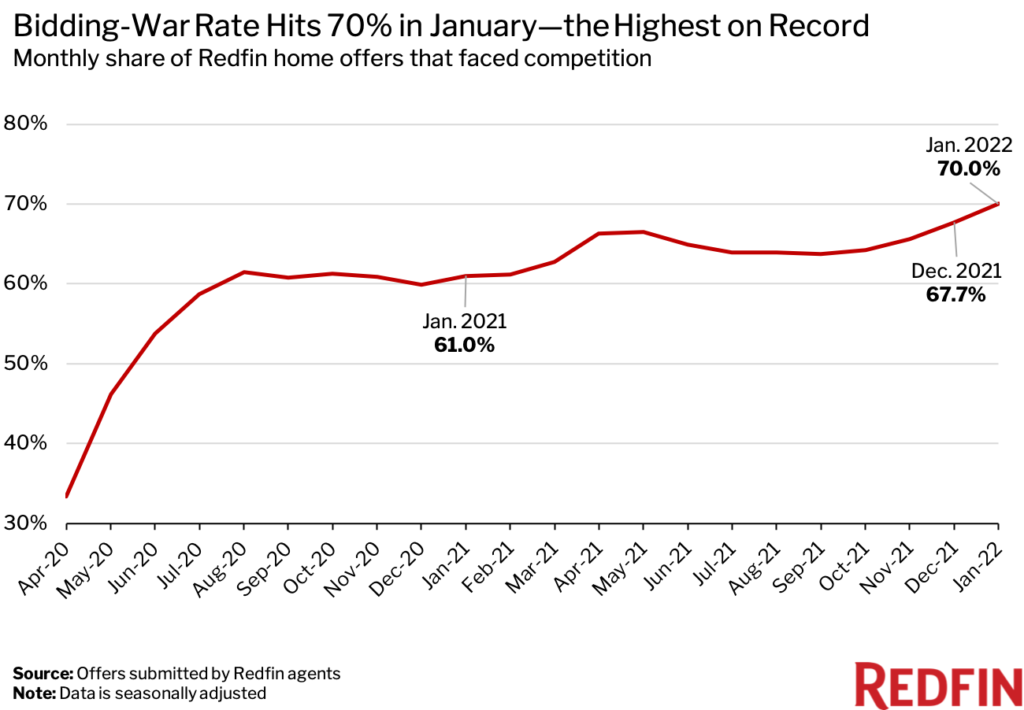
A record 70% of home offers written by Redfin agents faced bidding wars on a seasonally adjusted basis in January—the most recent month for which we have data. That’s up from 33.4% in April 2020, the earliest month in Redfin’s records. An offer is considered part of a bidding war if a Redfin agent reported that it received at least one competing bid.
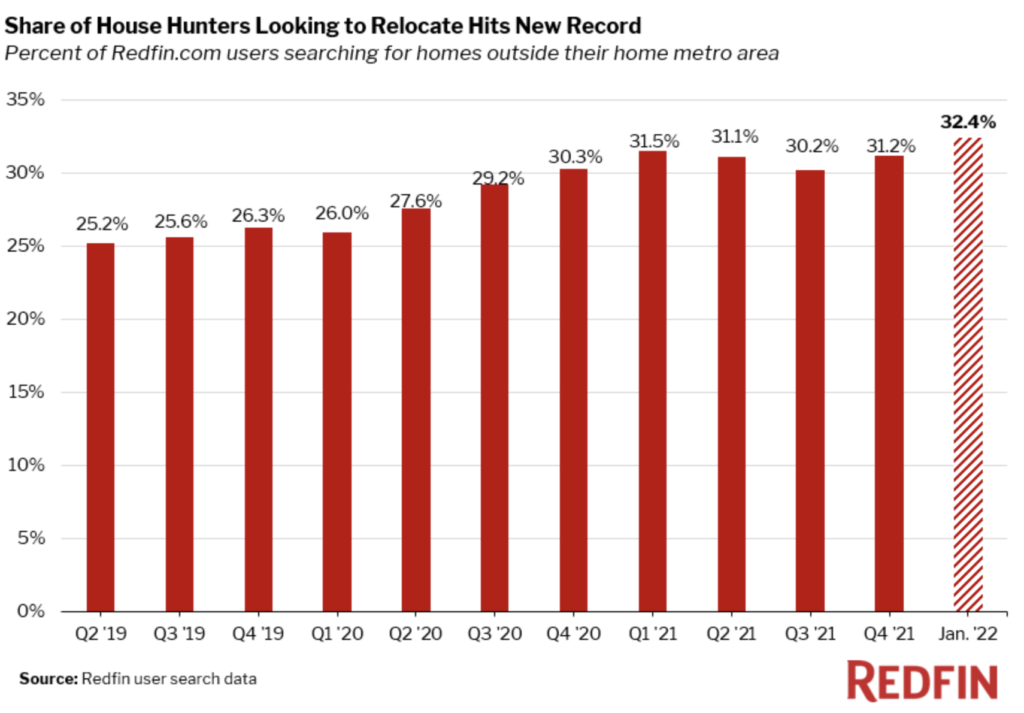
A record 32.4% of Redfin.com users nationwide looked to move to a different metro area in January—the most recent period for which data is available. That’s up from the previous peak of 31.5% in the first quarter of 2021 and significantly higher than before the pandemic, when about one-quarter of homebuyers were looking to relocate.
The most popular destinations in January were Miami, Phoenix, Tampa, Sacramento and Las Vegas. Relatively affordable, warm metros normally top the list, and have only become more popular during the pandemic as people have left expensive coastal markets in search of lower prices and more space in the Sun Belt. San Francisco, Los Angeles, New York, Seattle and Washington, D.C. were the top metros homebuyers looked to leave in January.
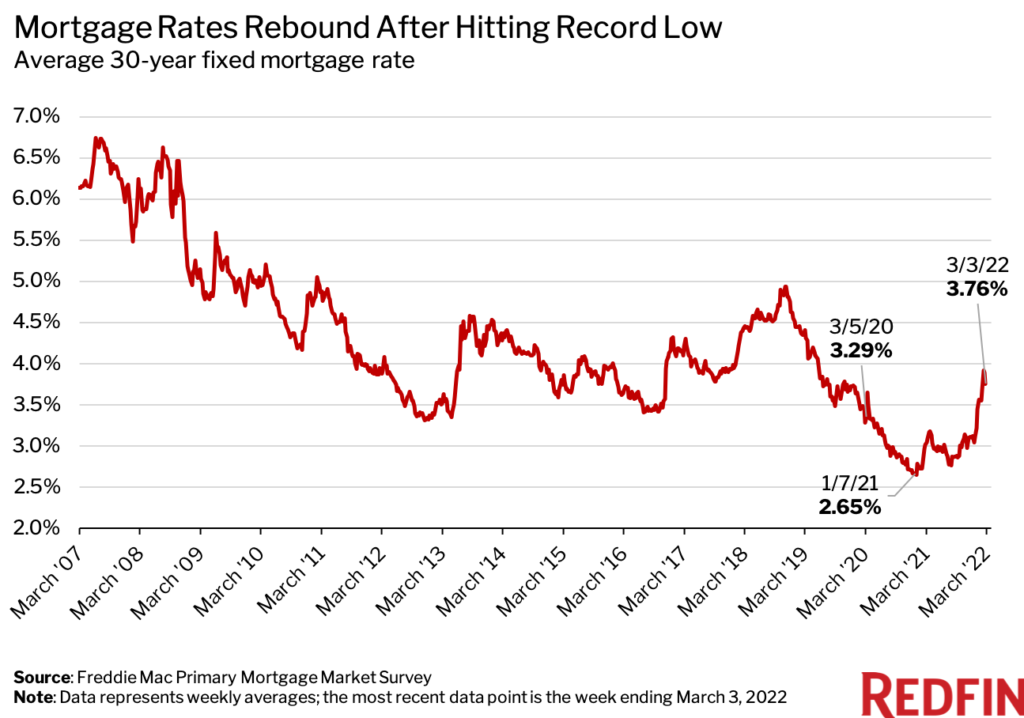
Mortgage rates are back above pre-pandemic levels after hitting an all-time low of 2.65% in January 2021. The average 30-year fixed mortgage rate was 3.76% during the week ending March 3, 2022, according to the latest data from Freddie Mac. That’s up from 3.29% two years earlier, when early signs of the pandemic had already started to put downward pressure on mortgage rates. Rates started rising sharply at the end of 2021, though they’ve dropped slightly in recent weeks as Russia’s invasion of Ukraine has shaken global financial markets. Overall, rates remain near historic lows. By comparison, the average 30-year fixed mortgage rate was close to 7% in 2007 and higher than 18% in the 1980s.
Homebuyer demand for second homes was up 87% from pre-pandemic levels in January—the most recent period for which data is available. That’s the highest level in a year and just shy of the record 90% gain in September 2020. It’s worth noting that preliminary February data suggests second-home demand slowed as mortgage rates jumped.
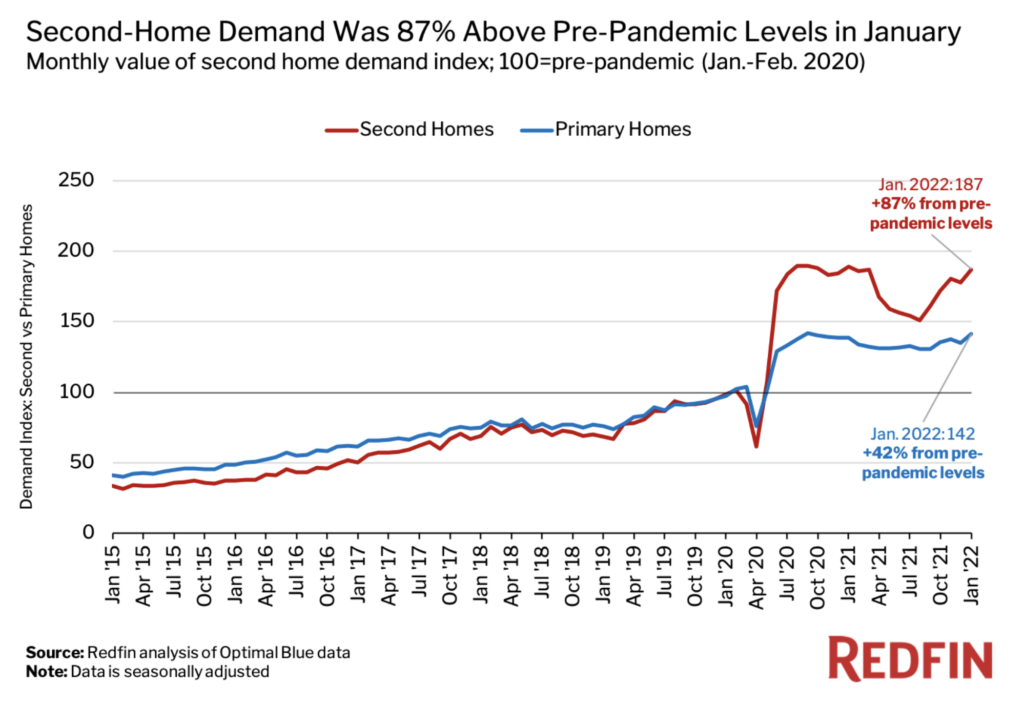
That’s according to a Redfin analysis of mortgage-rate lock data from real estate analytics firm Optimal Blue. Redfin created a seasonally adjusted index of Optimal Blue data to compare second-home demand before and during the pandemic. We define “pre-pandemic” as January and February 2020 and set the index for that period to 100. Any data point above 100 represents second-home demand that’s above pre-pandemic levels. Read more on our methodology here.
Interest in second homes surged during the pandemic because many affluent Americans purchased vacation properties to escape crowded, boarded-up cities. Additionally, some Americans bought second homes not as vacation properties, but as full-time residences to live in while they rent out their old homes.
“Milwaukee is gaining residents, but many homeowners aren’t selling because they’re worried they won’t be able to find anything to buy,” said local Redfin real estate agent Rick Szekely. “When they eventually do find a new home, a lot of them are still holding onto their previous one because they’ve found they can cash in on the surging rental market.”


