

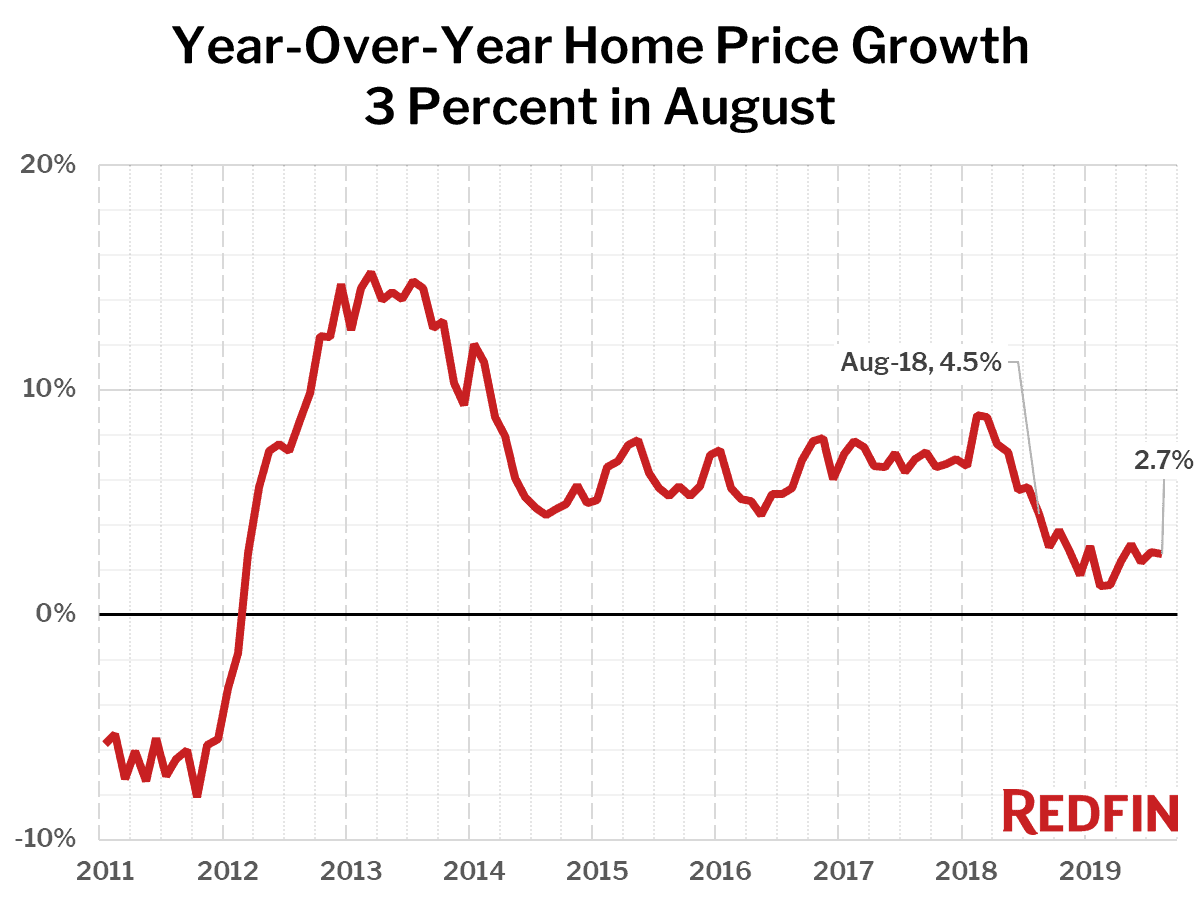
U.S. home-sale prices increased 2.7 percent year over year in August to a median of $312,200 across the 217 metros Redfin tracks. Home prices have been growing in a tight range between 1 and 3 percent year over year since September 2018.
“Although home-price gains remained relatively modest in August, supply and demand are now heading back toward sellers’ favor,” said Redfin chief economist Daryl Fairweather. “Home sales are accelerating as buyers eat into a diminishing number of homes for sale. While these trends are to be expected given that mortgage rates have been declining since late last year, global economic uncertainty and talk of a looming recession in the U.S. are staving off many aspects of hot seller’s market–think bidding wars, fast sales and huge price escalations–at least for now.”
The metro areas that saw the biggest gains in median price from a year ago were all smaller, more affordable areas: Knoxville, TN (median price $219,000, up 15.3%), Camden, NJ ($213,000, +12.7%), Greenville, SC ($222,500, +11.8%). In fact, you have to go all the way down to #18 on the list of metros with the fastest-rising prices before you hit one with a median price above the national median: Salt Lake City, UT at $340,000, up 7.9 percent from a year earlier.
Just six of the 85 largest metro areas Redfin tracks saw a year-over-year decline in their median sale price, the biggest of which was in San Jose, California, where home prices fell 11.6 percent from a year earlier. Bridgeport, CT (-2.0%), Albany, NY (-1.8%), Anaheim, CA (-1.3%), San Francisco, CA (-1.0%) and Oakland, CA (-0.1%) rounded out the list of metro areas with price drops.
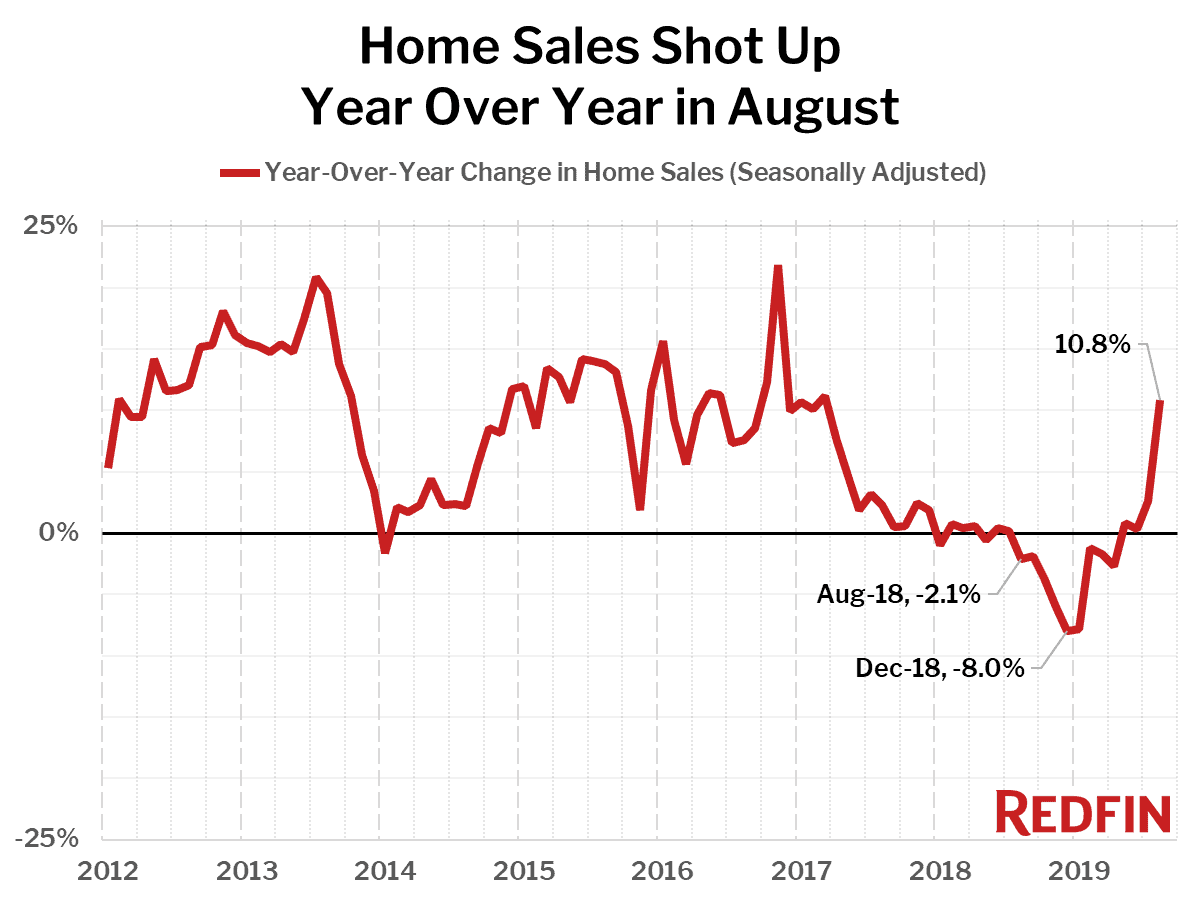
Home sales shot up 10.8 percent in August year over year—the largest increase we’ve seen since March 2017.
The big overall sales increase was driven by relatively affordable metro areas, with the largest year-over-year sales jumps recorded in Camden, NJ (median price $213,000, sales +38.6%), Baltimore, MD ($290,000, +27.6%) and Minneapolis, MN ($286,950, +26.7%).
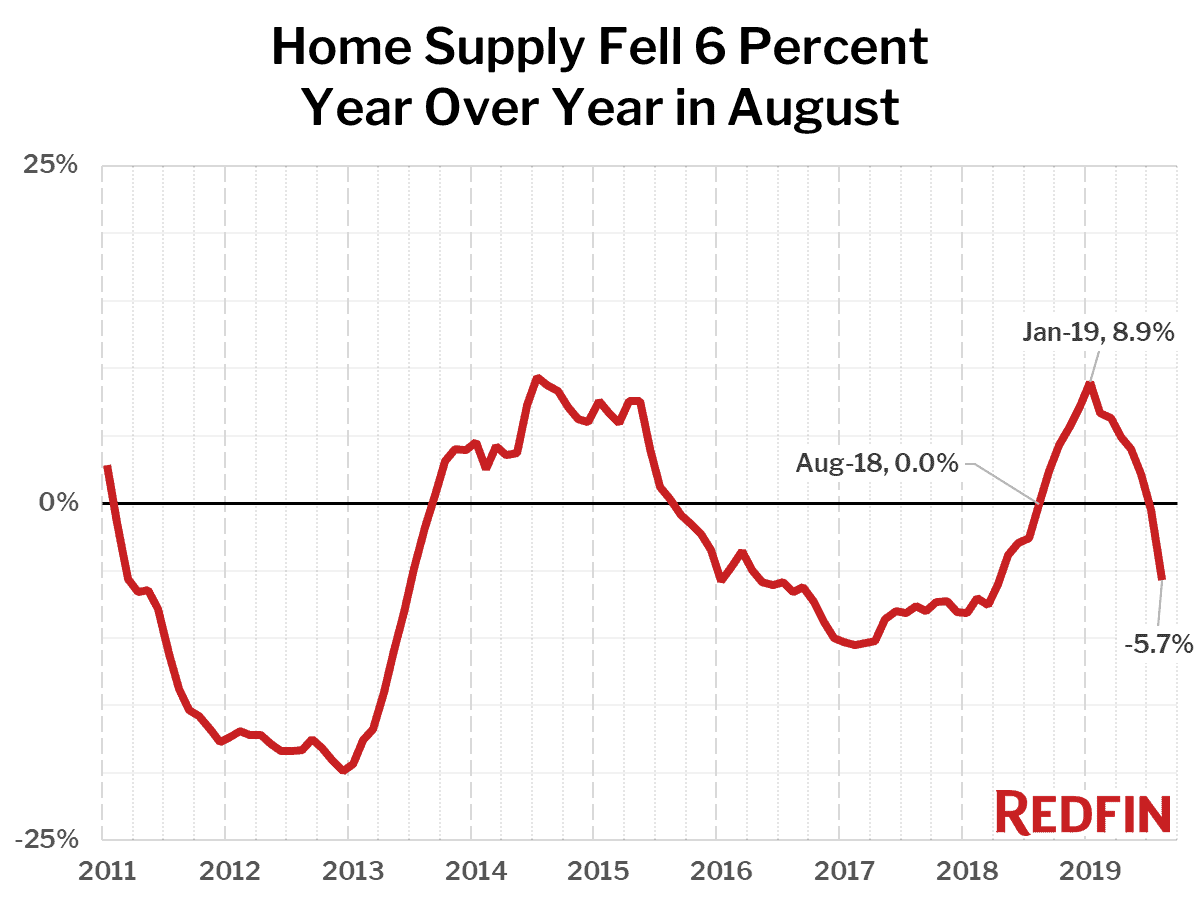
The supply of homes for sale fell 5.7 percent year over year, the biggest decline since April 2018. Just 20 of the 85 largest metros tracked by Redfin saw an increase in the number of homes for sale compared to a year earlier. Housing inventory is falling even faster than we expected it to, thanks to a dearth of new listings, which fell 3.7 percent year over year in August, the largest decline on record since Redfin began recording this data in 2012.
The biggest declines in the number of homes for sale were in Tacoma, WA (-26.8%), Salt Lake City (-26.1%) and Tulsa, OK (-24.4%)—all relatively affordable metros. The three metro areas with the biggest increases in the number of homes for sale were all metro areas with home prices well above the national median: San Jose (+12.5%), Oxnard, CA (+11.5%) and Honolulu, HI (+11.4%).
“It’s important to remember that in August 2018, prices, sales and inventory were just beginning to indicate the onset of a cooling housing market,” said Redfin economist Taylor Marr. “With that in mind, last month’s year-over-year sales increase and inventory decrease are only slightly exaggerated. The fact that our seasonally adjusted measure of sales increased 4.9 percent from July to August as new listings and overall inventory declined tells us that supply is constricting and demand is growing meaningfully, signs that the market is heating up as we head into Fall. If not for recession fears, price and sales growth would likely be even stronger given this summer’s record-low mortgage rates.”
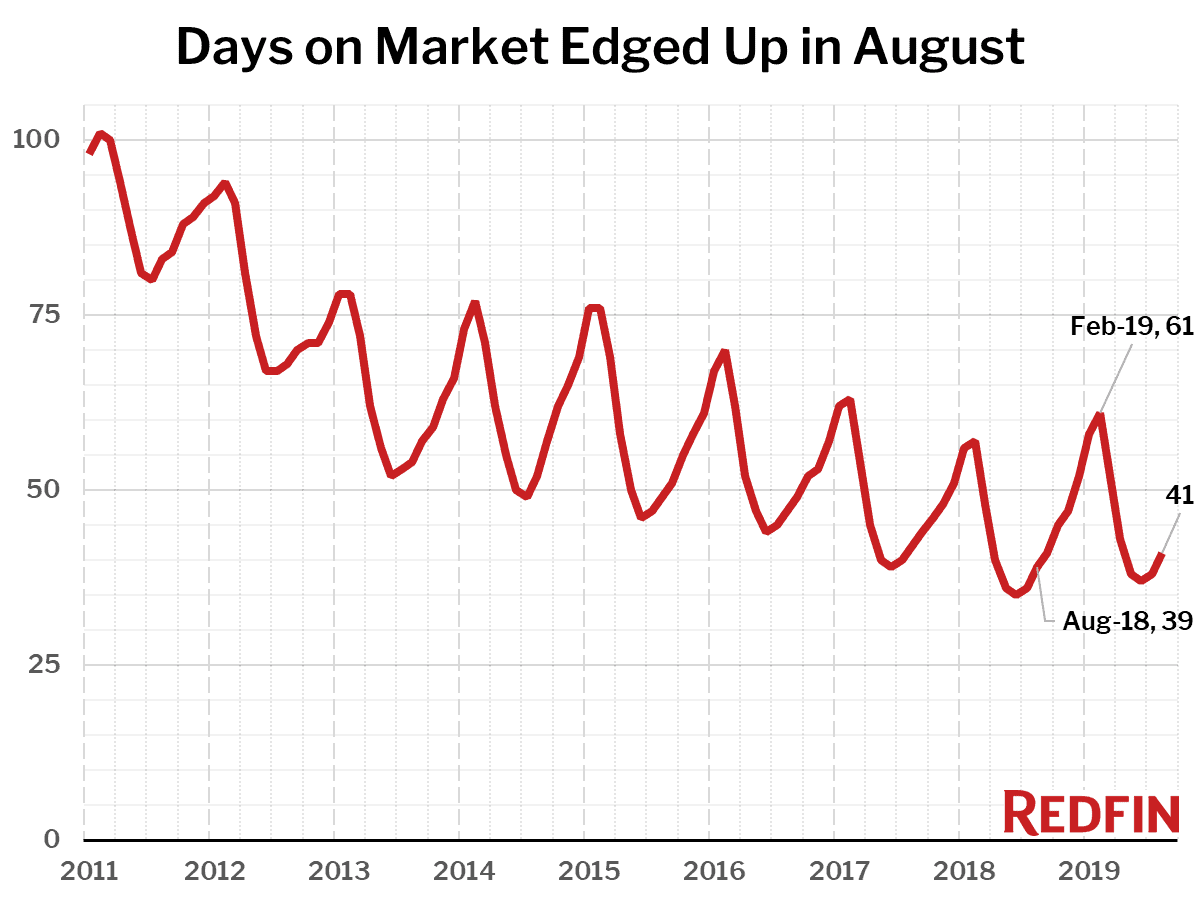
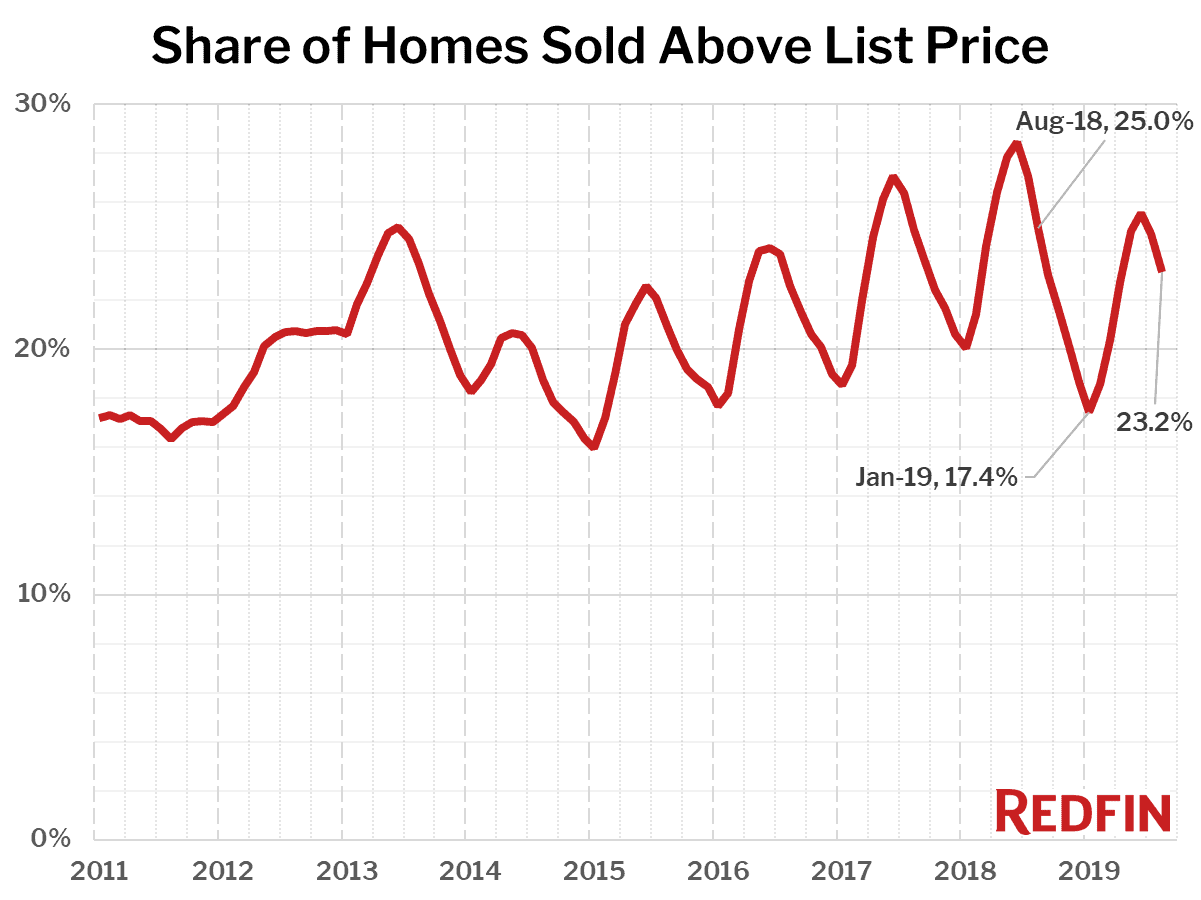
As such, measures of competition still indicate that the US housing market was slightly cooler in August than it was a year earlier. The speed at which homes went off the market slowed slightly, to 41 days, up from 39 in August 2018. This is a continuation of the trend over the past eight months, when the speed of sales has slowed by an average of two days compared to last year. The share of homes sold above list price fell to 23.2 percent in August, down from 25 percent a year earlier, following the same trend that we have seen for over a year.
Also, 28 percent of homes listed for sale had a price drop in August, up from 27.4 percent in August 2018. This is the second-highest rate of price drops on record, only surpassed by the 29.6 percent rate last October.
Competition
Prices
Sales
Inventory
Redfin Estimate
Below are market-by-market breakdowns for prices, inventory, new listings and sales for markets with populations of 750 thousand or more. For downloadable data on all of the markets Redfin tracks, visit the Redfin Data Center.
