

The total value of U.S. homes was $45.3 trillion at the end of 2022, down 4.9% ($2.3 trillion) from a record high of $47.7 trillion in June. That’s the largest June-to-December drop in percentage terms since 2008. While the total value of U.S. homes was up 6.5% from a year earlier in December, that’s the smallest year-over-year increase during any month since August 2020. This is according to an analysis of Redfin Estimates on more than 99 million U.S. residential properties.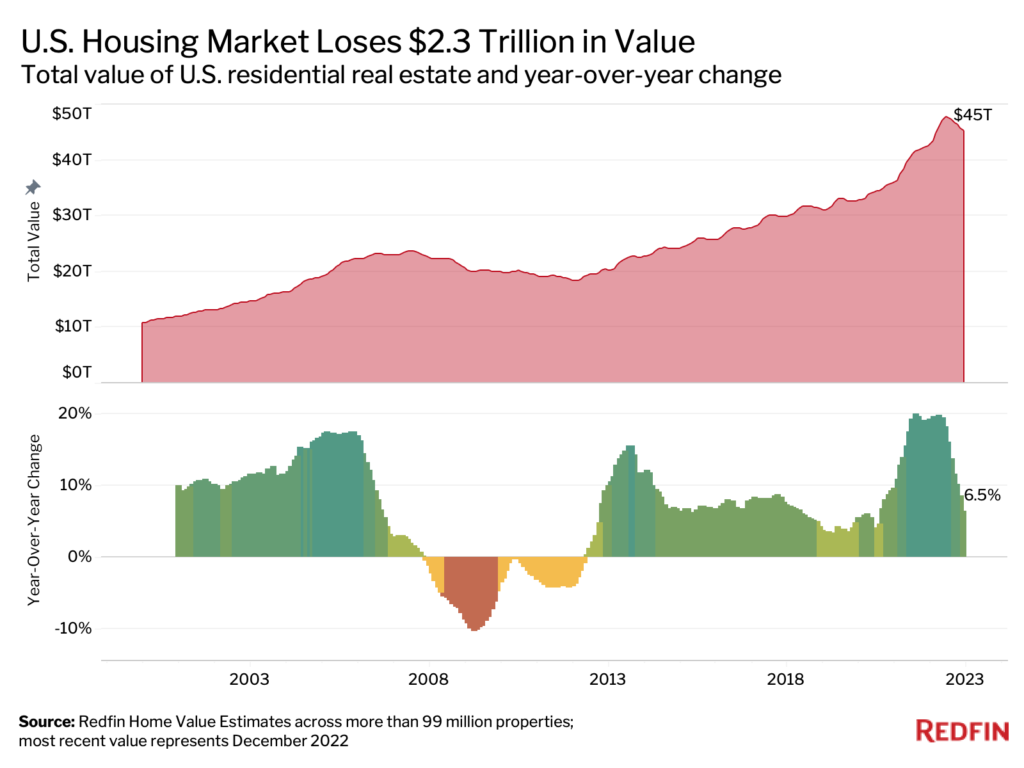
The housing market has been shedding value because homebuyer demand has waned, which has also caused home prices to fall from their peak. The median U.S. home sale price was $383,249 in January, down 11.5% from a peak of $433,133 in May, and up just 1.5% from January 2022.
Homebuyer demand slowed in large part because rising mortgage rates—a consequence of the Federal Reserve’s effort to curb inflation—made purchasing a home more expensive. The average 30-year fixed mortgage rate was 6.36% in December. While that’s down from the 20-year high of 7.08% in November, it’s roughly double the level from the start of 2022. Rates fell at the beginning of February, giving buyers some hope, but have since crept back up to December levels.
“The housing market has shed some of its value, but most homeowners will still reap big rewards from the pandemic housing boom,” said Redfin Economics Research Lead Chen Zhao. “The total value of U.S. homes remains roughly $13 trillion higher than it was in February 2020, the month before the coronavirus was declared a pandemic.”
Zhao continued: “Unfortunately, a lot of people were left behind. Many Americans couldn’t afford to buy homes even when mortgage rates hit rock bottom in 2021, which means they missed out on a significant wealth building opportunity.”
We primarily use year-over-year comparisons rather than comparisons to the peak for the metro-level and demographic breakdowns in the remainder of this report, as different metros and groups saw home values peak at different times.
The total value of San Francisco homes fell 6.7% year over year to $517.5 billion in December (a $37.3 billion decline)—a larger drop in percentage terms than any other major U.S. metropolitan area. Next came two other Bay Area markets: Oakland (-4.5%) and San Jose (-3.2%). Only three other metros saw year-over-year declines: New York (-1%), Seattle (-0.4%) and Boise, ID (-0.3%). This analysis includes the 100 most populous metro areas, with the exception of Albuquerque, NM, which had insufficient data.
Pricey coastal tech hubs have experienced outsized declines in home values for a few reasons:
The good news for Bay Area buyers is that home prices are down and competition remains far lower than it was during the pandemic homebuying boom. San Francisco’s median home sale price dropped 9.4% year over year to $1.3 million in January—the second biggest decline in the country. The good news for sellers is that the steep decline in prices has lured some buyers back.
“Three of my listings recently went under contract after sitting on the market for more than a month,” said Ali Mafi, a Redfin real estate agent in San Francisco. “They all had a few showings here and there in the fall, but no buyer wanted to pull the trigger. And then suddenly in the new year, we had 10 or 15 people touring each property.”
Hover your mouse above the circles on the map below to see data for your metro area.
The total value of homes in Miami rose 19.7% year over year ($77 billion) to $468.5 billion in December—the largest annual increase in percentage terms among the metros Redfin analyzed. Miami’s housing market had roughly the same value in December as it did when it peaked in July at $472 billion.
Next came North Port-Sarasota, FL (+17.8%), Knoxville, TN (+17.7%), Charleston, SC (+17.4%) and Lakeland, FL (+16.9%). Florida was home to six of the 10 metros with the largest annual home-value gains, in percentage terms—even after Hurricane Ian caused billions of dollars in damage and displaced thousands of Floridians in fall 2022.
“Florida’s housing market is being sustained by folks moving in from the North and as of recently, the West Coast,” said Elena Fleck, a Redfin real estate agent in Palm Beach, FL. “People are pouring in from New Jersey and New York, in large part because Florida has relatively affordable homes and no income tax. They can get a lot more bang for their buck here.”
The total value of homes in American suburbs rose 6.4% year over year to $25.4 trillion in December. By comparison, the value of urban homes climbed 2.5% to $10.8 trillion. Rural homes—which make up a relatively small portion of the housing market—also fared better than cities, with total home value increasing 8.5% to $6.2 trillion.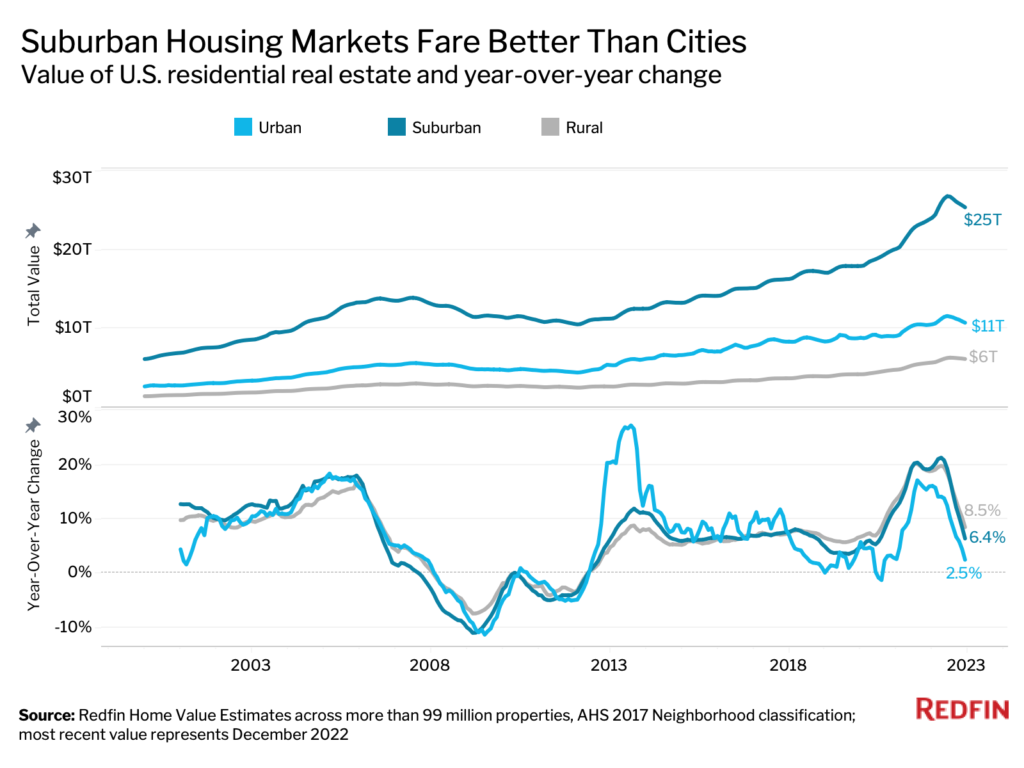
The suburbs came back into vogue during the pandemic while cities fell out of favor—largely due to the shift to remote work and the housing affordability crisis.
The total value of U.S. homes owned by millennials rose 26.7% year over year to $5.6 trillion in the third quarter of 2022—the most recent period for which data is available. Generation X saw the second largest increase (+18.4% to $13.9 trillion), followed by Baby Boomers (+12.9% to $18.1 trillion). The Silent Generation experienced a decrease (-6.7% to $4.4 trillion), as many of its members have passed away or moved into retirement homes.
Millennials are gaining more value largely because they’re in prime homebuying age, which means they’re purchasing substantially more homes than they were in recent years.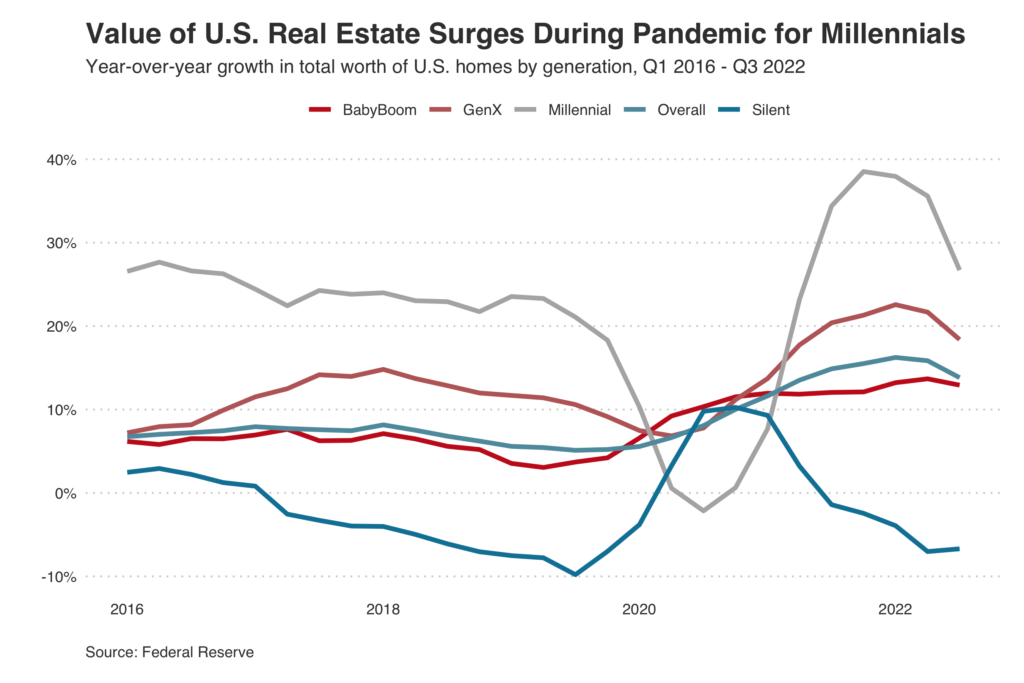
Home values in places that face high risk from climate change have performed roughly the same or better as home values in places that face low climate risk—an indication that climate risk isn’t yet priced into the U.S. housing market.
The total value of homes in areas with high flood risk rose 8.1% year over year in December, outpacing the 5.5% gain in low-risk areas. Similarly, the value of homes in areas with high heat risk was up 7.3%, compared with 1.9% growth in places with low heat risk. Areas with high risk from storms and/or fires saw values increase roughly the same amount, in percentage terms, as areas facing low risk. Drought was the only natural disaster for which home values climbed more in low-risk places (+6.6%) than in high-risk places (+3.7%).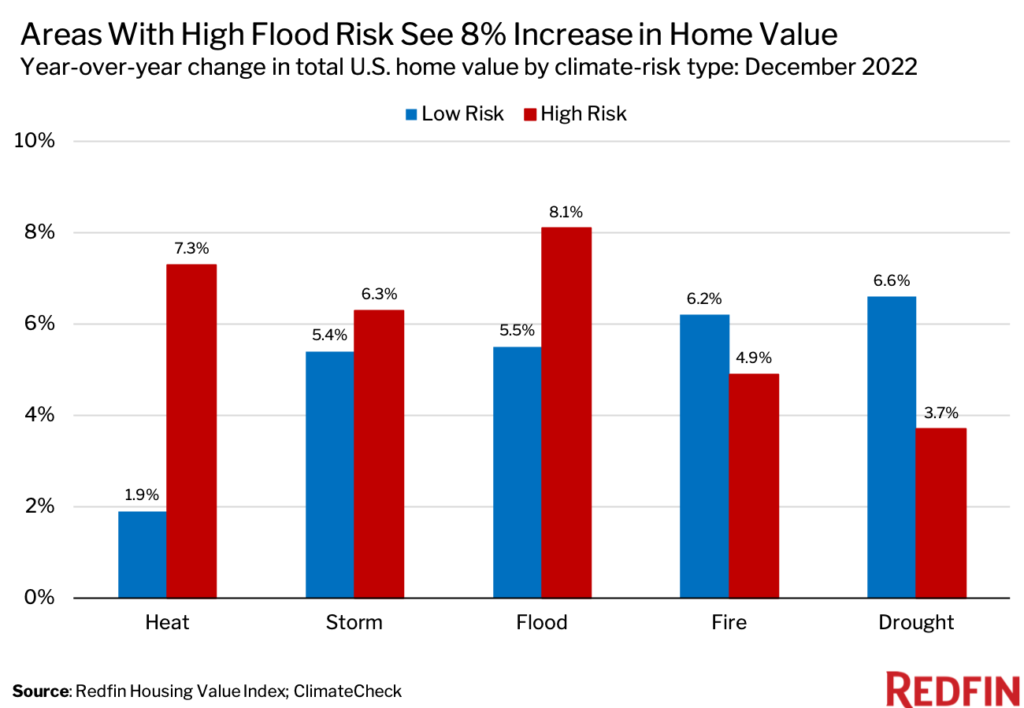
Research has shown that most homebuyers are concerned about climate risks. But there are often other factors—like affordability, proximity to family and/or access to the outdoors—that drive them to high-risk places anyway. Five of the 10 most popular U.S. migration destinations in the fourth quarter were in Florida, which faces high risk from both flooding and heat.
The total value of homes in neighborhoods that are majority Asian fell 0.7% year over year to $1.2 trillion in December. By comparison, majority Black neighborhoods saw a 5.8% gain (to $1.2 trillion), majority white neighborhoods saw a 6.9% gain (to $37.4 trillion) and majority Hispanic/Latino neighborhoods saw a 7.9% gain (to $1.9 trillion).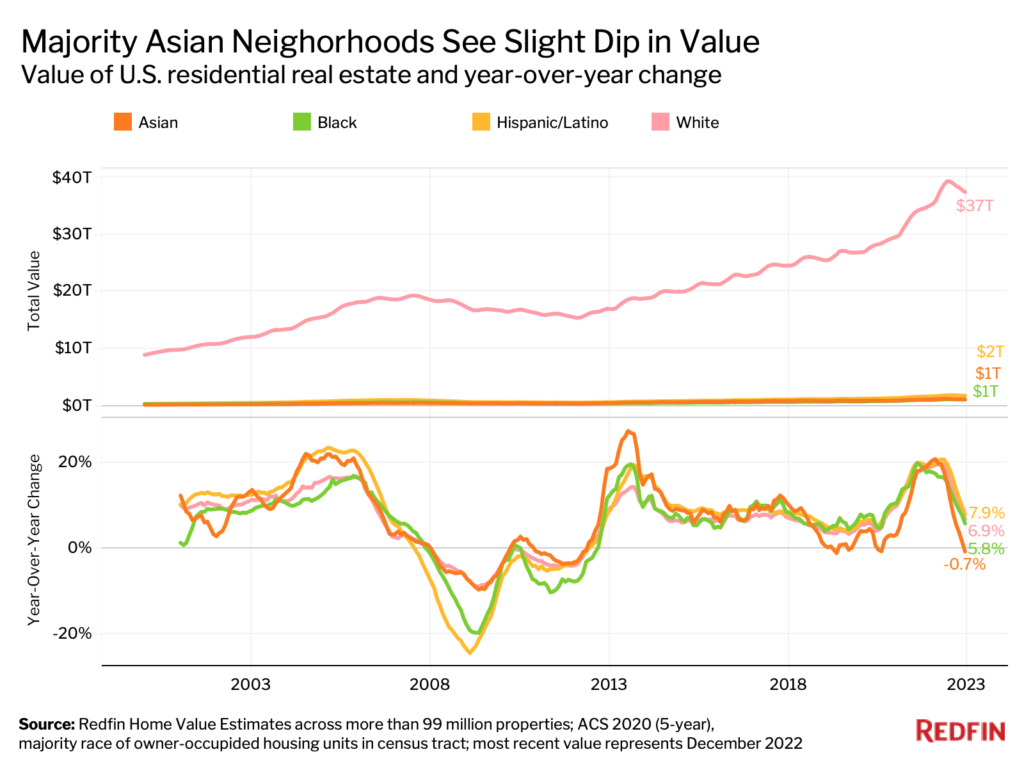
One reason Asian homeowners may be losing more value than other homeowners is that many of them live on the West Coast, which has seen a relatively large dropoff in home value, Zhao said. Almost half of Asian Americans live in the West, with nearly a third in California alone, according to a 2021 report from Pew Research Center.
This analysis uses the Redfin Housing Value Index—a model that incorporates the Redfin Estimate, public records and MLS data to estimate the current and historical value of more than 99 million single-family homes, condos, townhouses and multifamily properties in the U.S. Current values (December 2022) were calculated using the Redfin Estimate, which is available in most but not all parts of the U.S. Historical values were imputed using public records and MLS data on price per square foot trends by zip code (or city, county, or state when zip-code data is insufficient). The Redfin Housing Value Index includes both existing homes and new-construction homes, and dates back to the year 2000. Homes are not added to the index until they are first built or sold.
Homes are determined to be rural, suburban or urban based on categories for the census tract of the property from the U.S. Department of Housing and Urban Development (HUD). HUD has a model that describes neighborhood types based on responses to the 2017 American Housing Survey.
Home values by race/ethnicity are based on a classification of the home’s census tract. We classified a census tract as Black, Hispanic/Latino, Asian or white if more than 50% of owner-occupied households were owned by Black, Hispanic/Latino, Asian or white homeowners from 2017 through 2021, according to owner-occupied household race data from the five-year American Community Survey. A census tract was classified as mixed race if no race had greater than 50% of the owner-occupied household share in the tract.
Home values by generation are based on the Distributional Financial Accounts data from the Federal Reserve.
Home values by climate risk are aggregated according to the climate-risk category they fall under. Climate-risk data for drought, fire, flood, heat, and storm comes from ClimateCheck, which has six different climate-risk categories for properties across the U.S.—relatively low, low, moderate, high, very high and extreme. For this report, a “high-risk” property is one that falls into the high, very high, or extreme category—a score greater than 50. A “low-risk” property is one that falls into the relatively low, low or moderate category—a score of 50 or less. The climate-risk data in this report is as of June 2022.
