
Cooling Homebuyer Demand in June Suggests Home-Price Growth will Slow in August; the Most Substantial Price Relief Since February 2012
August Prices Expected Up Just 2.2% and Sales Up 4.6% Year Over Year in 15-Metro Composite
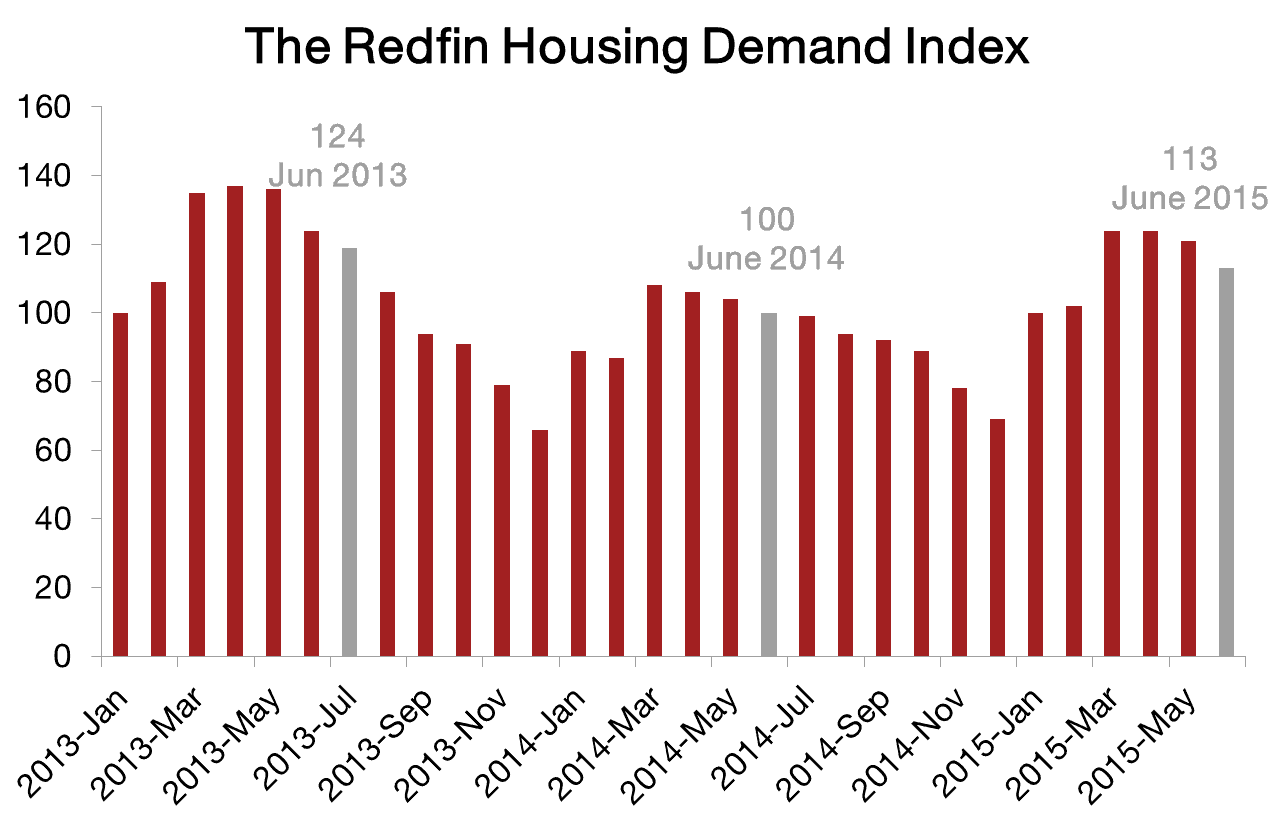
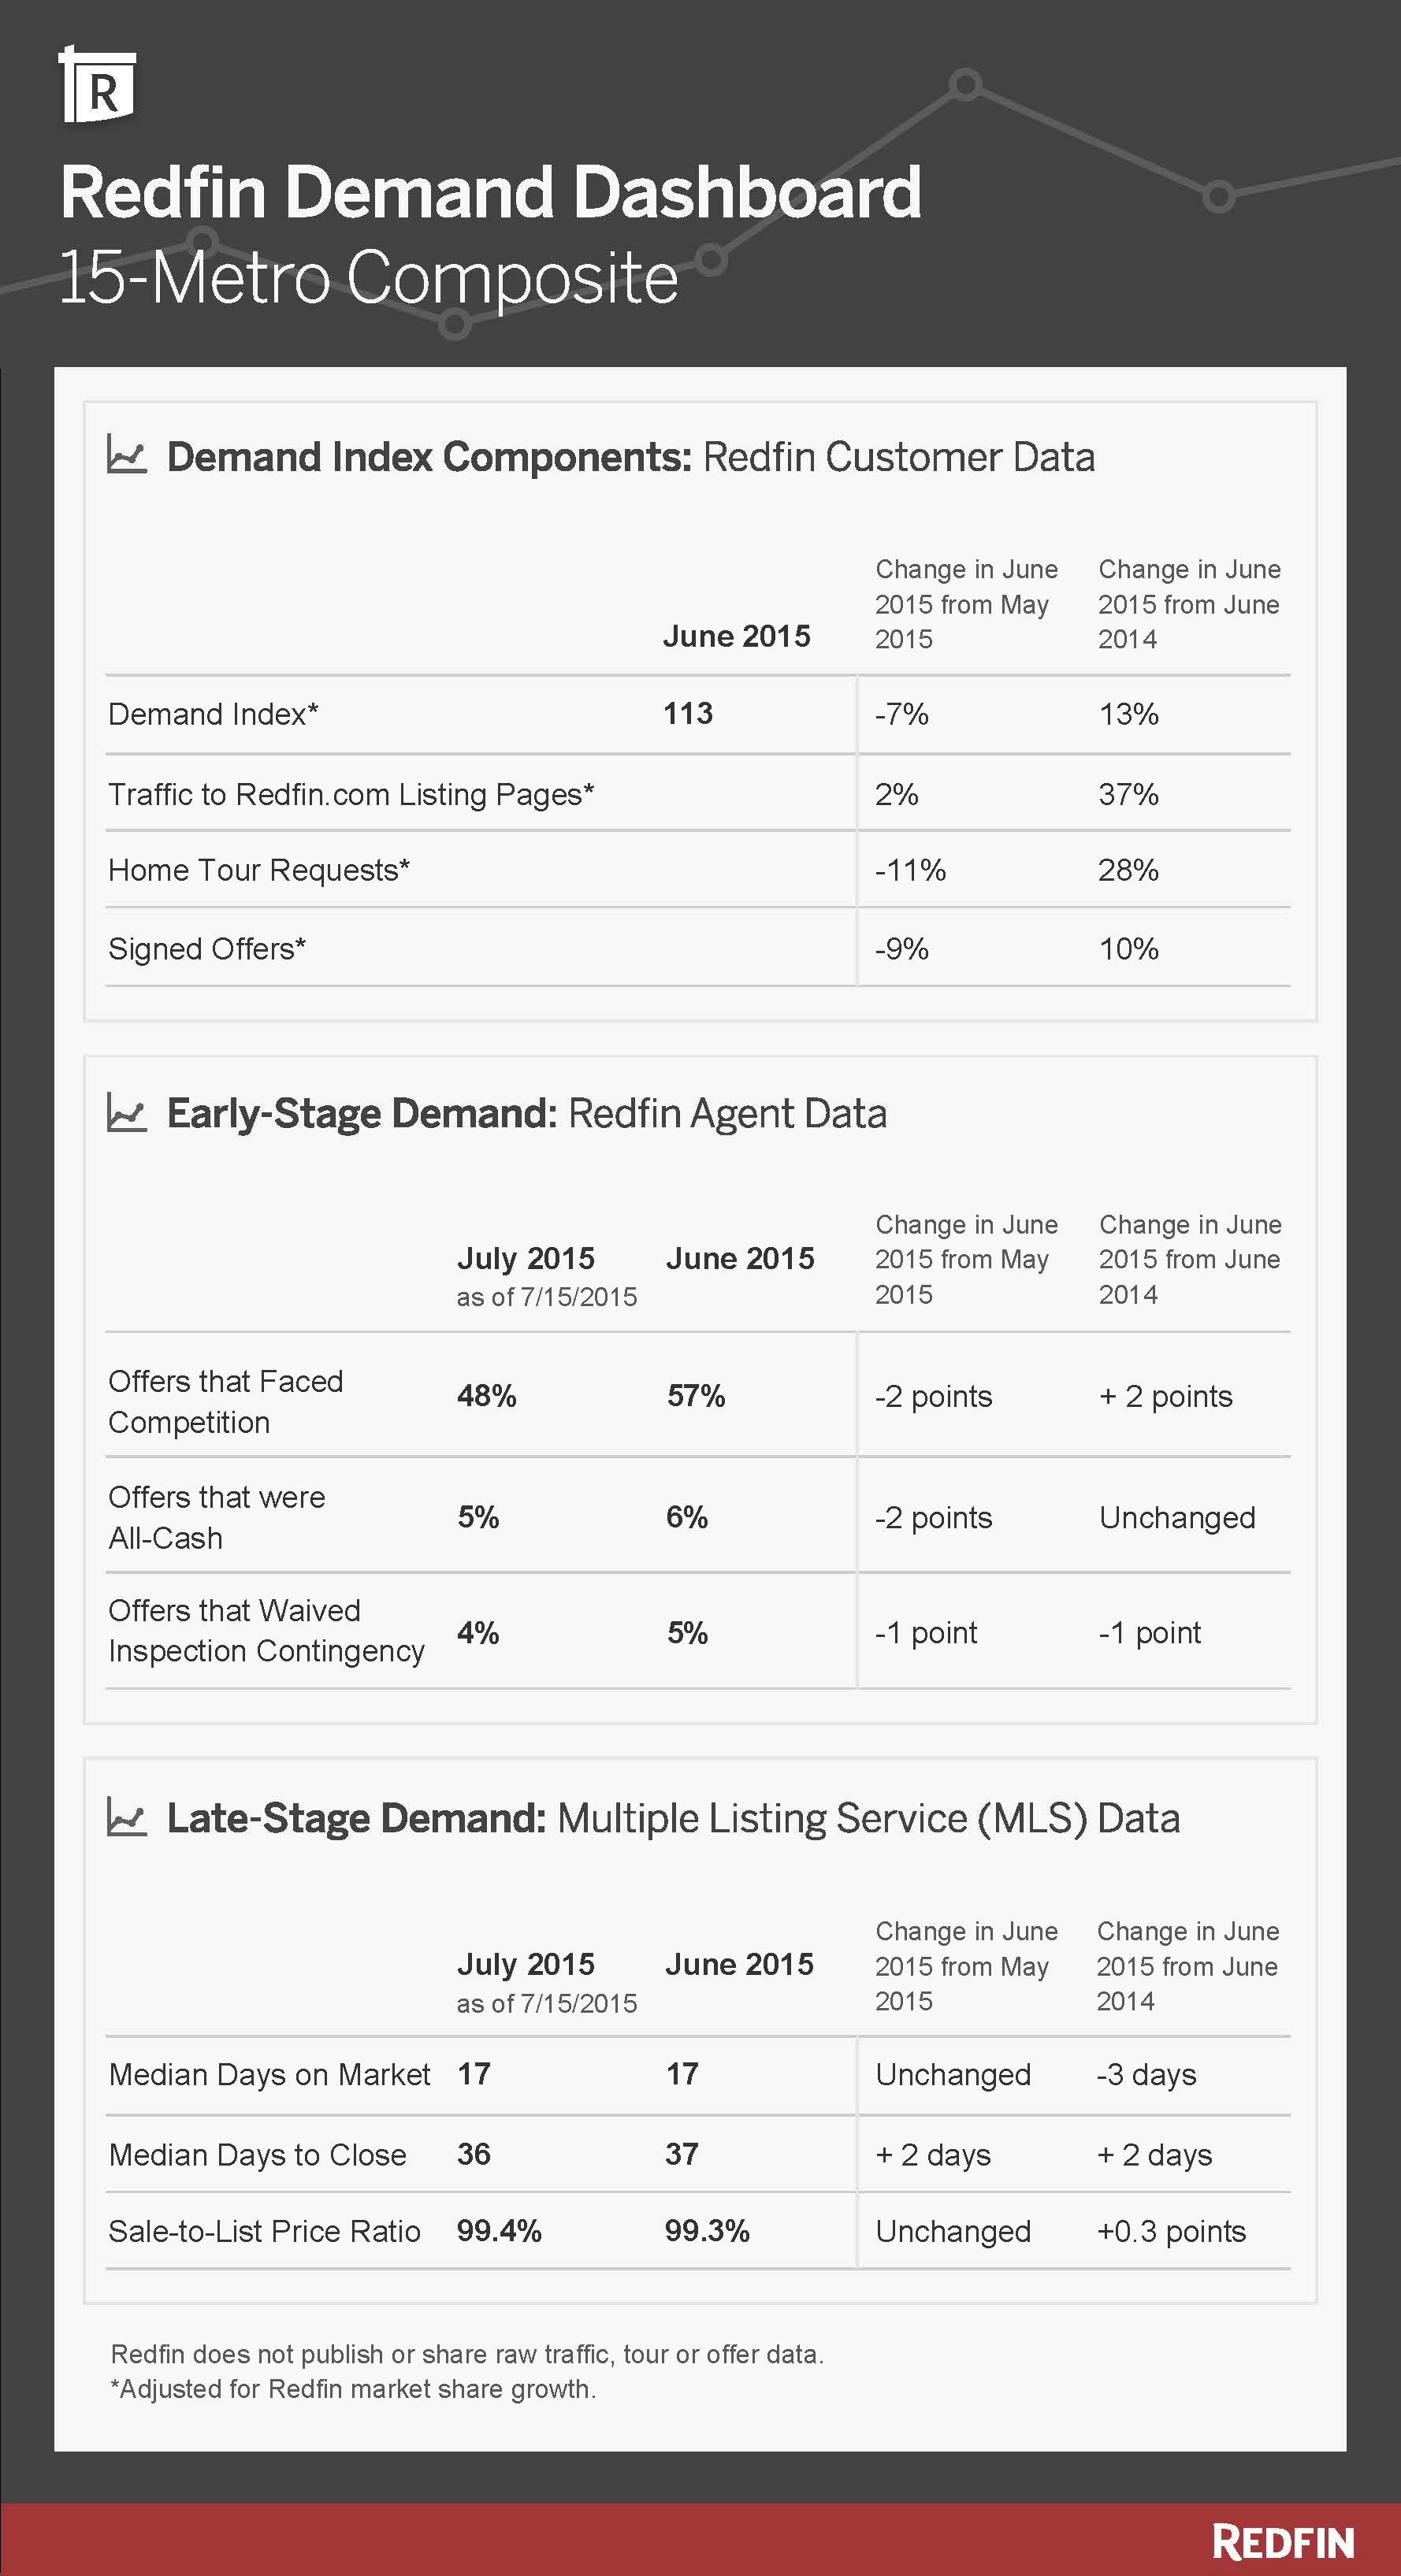
Today we debut the Redfin Housing Demand Index, the industry’s first and only measure of homebuyer activity prior to purchase. The Demand Index, an early indicator of housing-market performance, is based on millions of visits to Redfin.com home-listing pages, and thousands of Redfin customers requesting home tours and writing offers in 15 major metro areas1. It is scaled to equal 100 on January 2013, which is the first month of the estimation period. The Demand Index is adjusted for Redfin’s market share growth.
The Demand Index debuted today at a level of 113, up 13 percent year over year, the smallest increase since January. In 2015, the Demand Index followed a similar seasonal pattern to previous years, increasing from January to April, then beginning to decline. However, this year’s 6.7 percent decline from May to June is steeper than the 3.9 percent decrease for the same period in 2014. Over the past 30 months, the Demand Index has averaged 103.
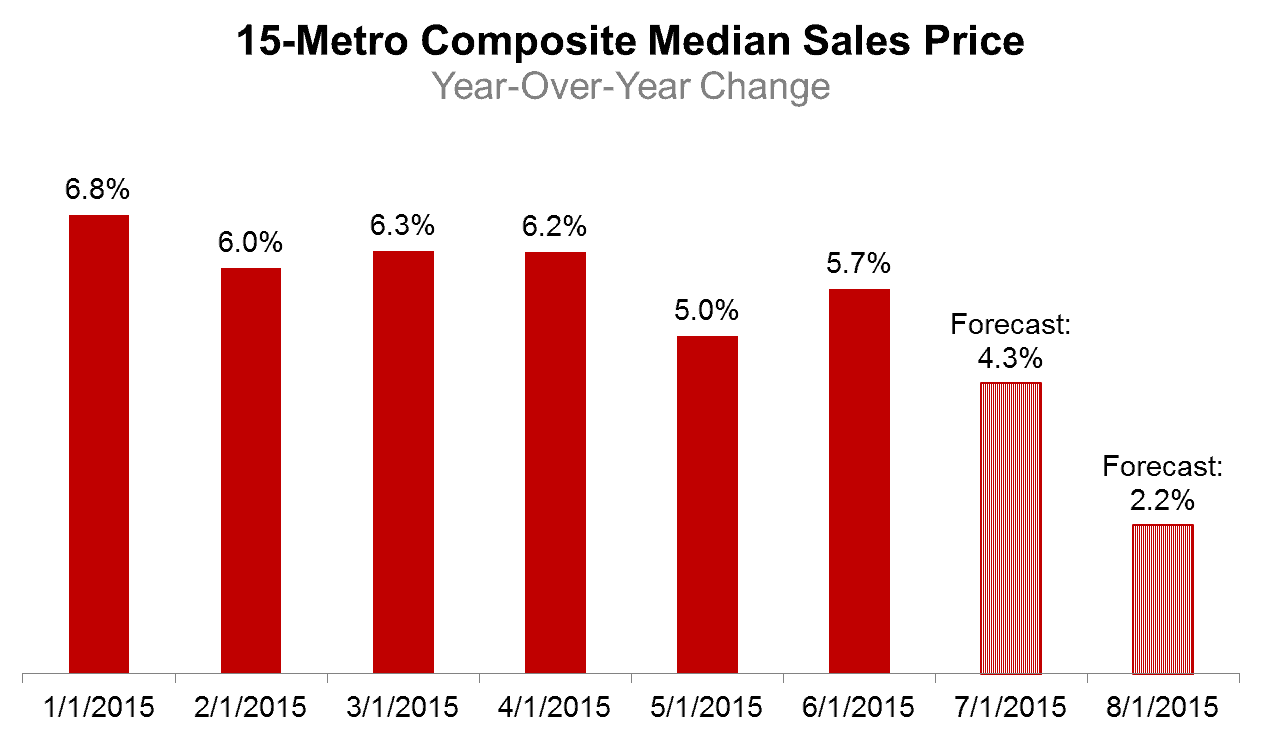
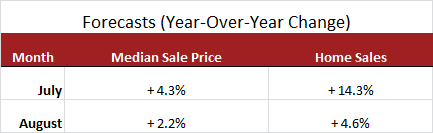
Redfin used its demand data through mid-July and industry housing data from 15 major-metro areas1 to forecast year-over-year changes to national home prices and sales in the current month and one month ahead. Redfin forecasts that year over year, home prices will be up about 4.3 percent in July, and just 2.2 percent in August.
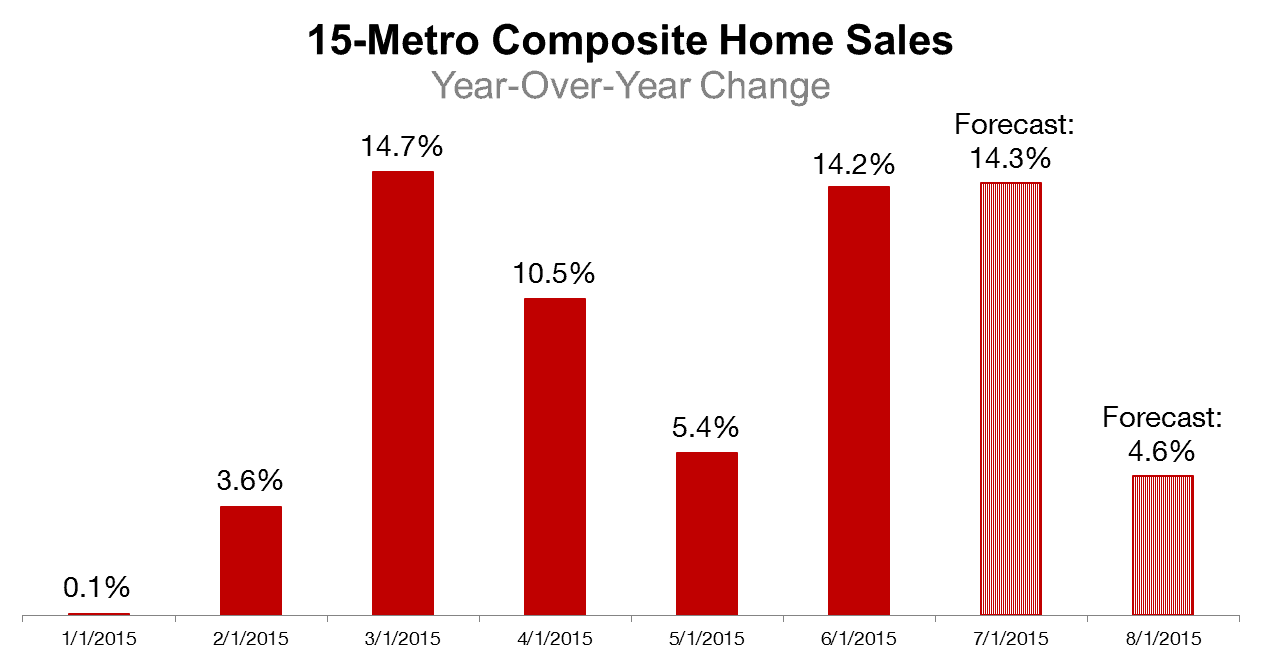
We expect the number of homes sold in July to grow by 14.3 percent year over year, and by 4.6 percent in August.
This year’s seasonal slowdown is more extreme than normal due to buyer fatigue over high prices and low selection, combined with gradually increasing mortgage interest rates. Buyers are still in the market, but they’re setting boundaries on what they’re willing to pay.
“Homebuyers in D.C. have reached their limit when it comes to price,” said Dan Galloway, a Redfin agent in Washington, D.C. “As recently as May, offers $100,000 above list price were common, but home prices are now reaching a line that buyers will not cross.”
Two major factors driving the forecasts are fewer people making offers and lower list prices for homes going under contract.
Homebuyers are still touring in force, but they’re more price sensitive. Fewer are making offers, and when they do, they’re buying less expensive homes. The median list price of pending homes fell by $10,000 to $300,000 in just the last two weeks.
The price model includes:
The sales model includes:
The Redfin Demand Dashboard provides an at-a-glance comparison of 10 demand-related metrics. The Demand Dashboard tracks the same 15 markets1 as the Redfin Demand Index.
1 The Redfin Housing Demand Index covers the following 15 metro-area markets: Atlanta, GA; Austin, TX; Baltimore, MD; Boston, MA; Chicago, IL; Denver, CO; Los Angeles, CA; Oakland, CA; Orange County, CA; Phoenix, AZ; Portland, OR; San Diego, CA; San Francisco, CA; Seattle, WA; Washington, DC.
A detailed methodology of the demand index and forecast models can be found here.
An excel spreadsheet of historical demand index values can be found here.
Other popular posts:
1. How to Safely Observe Wildlife from Your Home
2. How to Create an Autism-Friendly Environment for Kids
3. How to Make Your Backyard a Sanctuary for Wildlife
